Analysis
Fantom: Here are the levels to watch out for after FTM’s $0.65 rejection
Disclaimer: The information presented does not constitute financial, investment, trading, or other types of advice and is solely the writer’s opinion.
- Fantom had a bearish short-term momentum after posting strong gains throughout January.
- A pullback to $0.5 or deeper was possible.
Fantom [FTM] saw a pullback of nearly 20% in the past three days. It is possible that more losses could follow. However, the higher timeframe bias remained strongly bullish. Significant levels of support near $0.5 and $0.43 can see a positive reaction from the price.
Read Fantom’s [FTM] Price Prediction 2023-24
The possibility of a recovery and another move upward for Fantom hinges on Bitcoin [BTC]. A bullish BTC would aid the efforts of FTM’s bulls. Therefore, buyers of FTM can also watch out for a bearish move from BTC. Any drop below $22.3k could spook buyers and lead to a wave of selling.
The Fibonacci retracement levels show further downside is likely for FTM
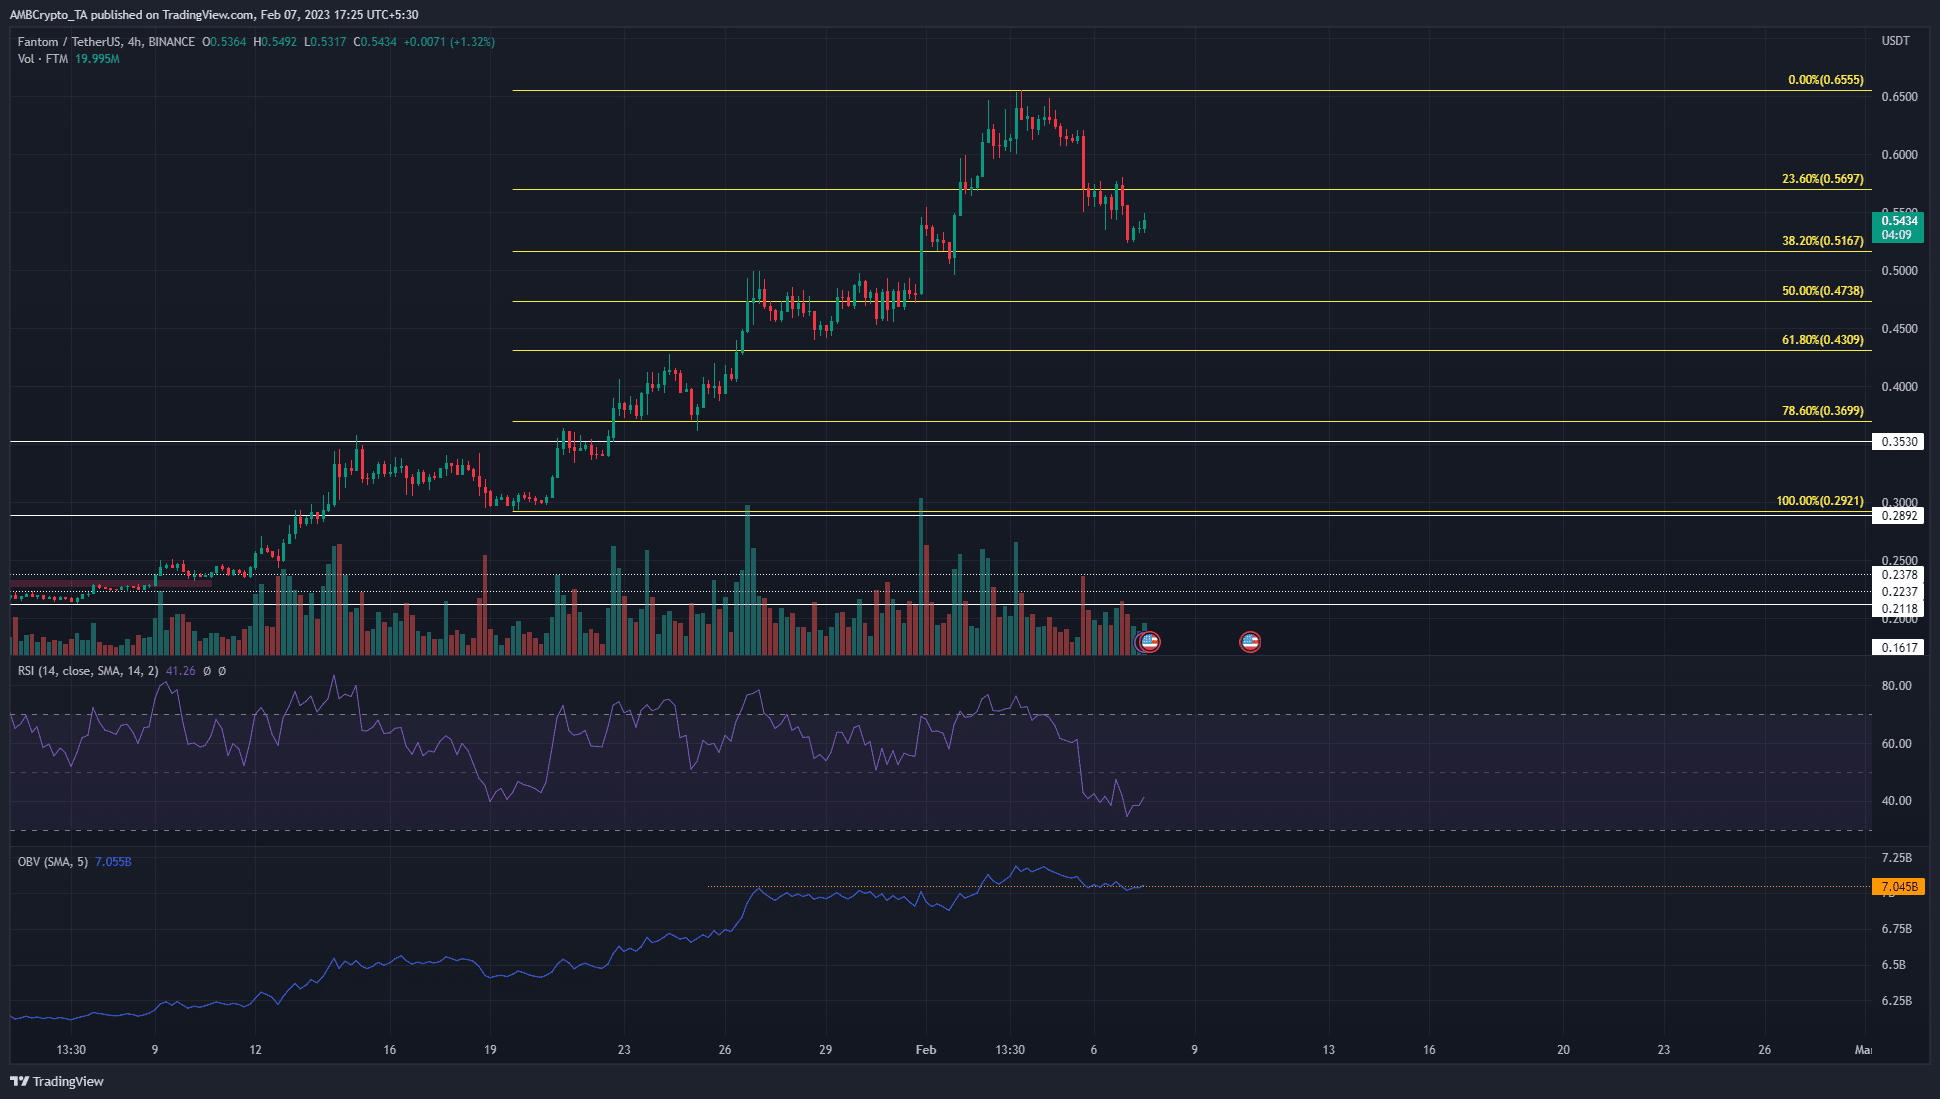
Source: FTM/USDT on TradingView
Based on the move upward from $0.292 to $0.655 in January and early February 2023, a set of Fibonacci retracement levels (yellow) was drawn. It showed the 61.8% and 78.6% levels to lie at $0.43 and $0.37, respectively.
The four-hour market structure was bearish after the price fell beneath the $0.569 level of support and subsequently retested the same as resistance. To reflect this, the RSI dropped beneath neutral 50 to show bearish momentum was dominant. However, the OBV held on to the level of support marked on the charts.
If the OBV does not see a sharp drop in the coming days despite a pullback in FTM prices, it could be a sign that sellers did not have the upper hand. Instead, it could inform buyers that a buying opportunity was brewing. In the event of a plunging OBV, some caution could be warranted.
In either scenario, a retest of the 61.8% or 78.6% retracement levels before a bullish market structure break on the four-hour chart would be ideal. This is what buyers can wait for a flip in the H4 structure to bullish. Following such a break, a move back up to $0.66 and $0.8 can be expected. However, it is very likely that on the way up, $0.6 would offer stern resistance.
Is your portfolio green? Check the Fantom Profit Calculator
A drop in Open Interest signals bearish momentum is prevalent
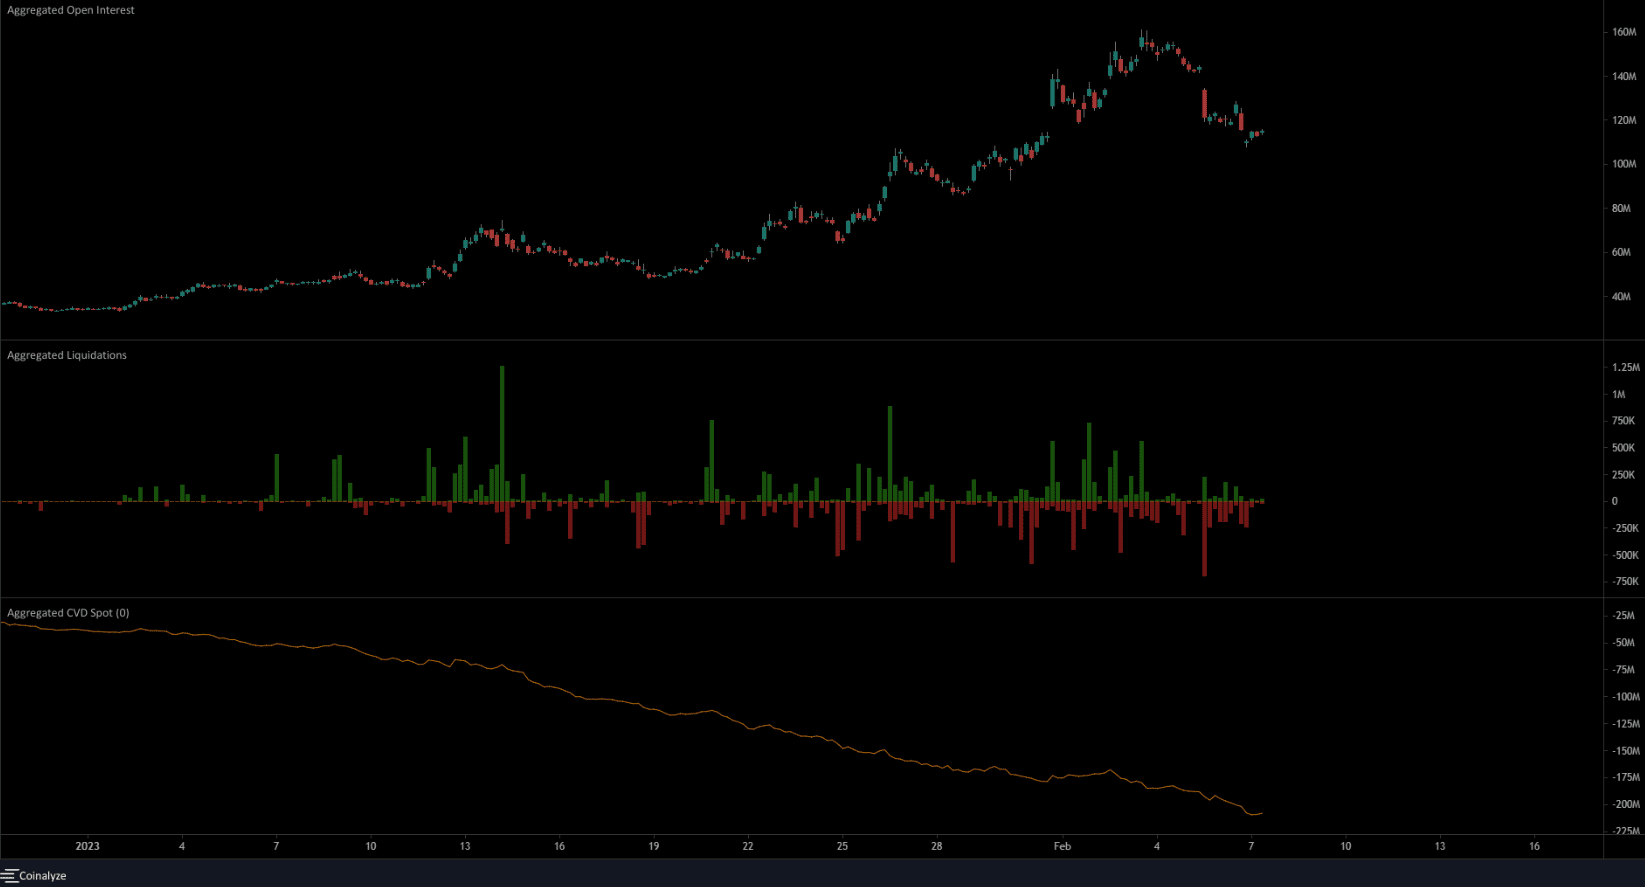
Source: Coinalyze
The spot CVD has been dropping even though the price rallied hard. This opposed the OBV, which steadily rose alongside the price. The liquidation charts showed both long and short positions have gotten wrecked in the past two weeks, especially in late January.
5 and 6 February saw $1 million and $900k worth of long positions liquidated, respectively. Meanwhile, Coinglass showed that the FTM funding rate remained positive, which denoted some bullish sentiment. The $0.43 level and $0.5 are two levels that longer-term investors can keep an eye on.