Analysis
Ethereum [ETH] bulls, watch for a reaction at these levels to buy
Disclaimer: The information presented does not constitute financial, investment, trading, or other types of advice and is solely the writer’s opinion.
- The 4-hour market structure is bearish.
- Buyers can await a deeper pullback, while sellers watch the $1680 mark.
Ethereum has shown substantial volatility over the past week as the price fluctuated from $1555 to $1714. January had been bullish, but that momentum appeared to be tapering off in the past week.
Read Ethereum’s Price Prediction 2023-24
A breakout past $1680 will likely see ETH bounce upward to $1760. In the coming weeks, that move could extend as far as $2000 too.
The shorter-term outlook is not as strongly bullish. Traders looking to buy the asset can wait for a further dip, or wait for an SFP at $1680 to enter short positions.
From a risk-to-reward perspective, a breakout past $1680 and a retest would require careful planning and risk management from a bull’s perspective.
Imbalance, order block, and a support level offer some confluence
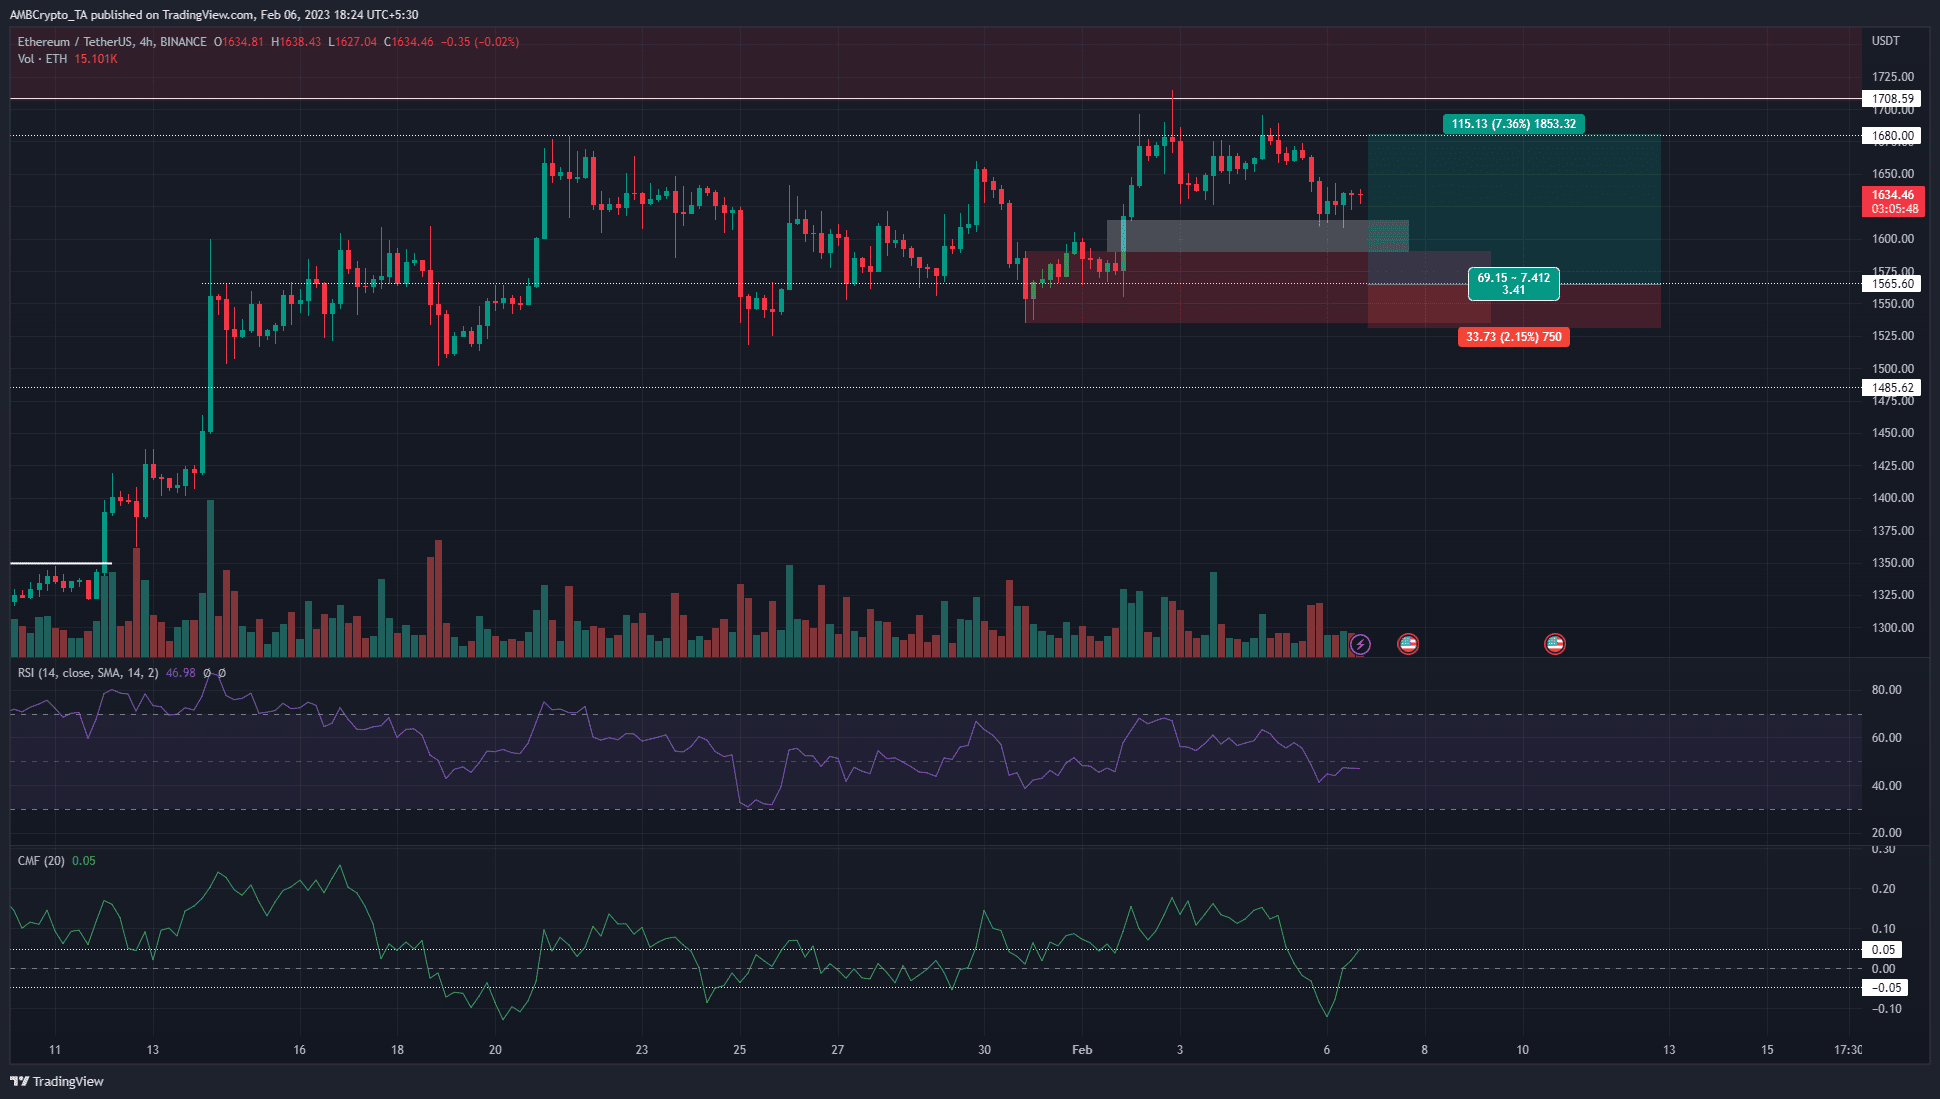
Source: ETH/USDT on TradingView
The H4 structure flipped bearish when the higher low set on February 3 at $1625 was broken on February 5. This break downward saw the H4 FVG (white) retested. A shallow dip into the FVG might not be enough to effect a strong move upward.
The RSI was at 46 and showed weak bearish momentum. The CMF stood at +0.05 and was on the verge of showing strong capital flow into the market, which was a bullish finding.
Below the inefficiency lay a 4-hour bullish order block (red), which had confluence with a horizontal support level at $1565. While blind bids might not be the solution, bulls can wait for a bullish reaction from the $1560 area.
A bullish structure break on the 1-hour chart around this area could give buyers enough confidence to enter a long position targeting $1680. The stop-loss can be set below $1535.
Is your portfolio green? Check the Ethereum Profit Calculator
From a risk-to-reward perspective, a breakout past $1680 and a retest would require careful planning and risk management from a bull’s perspective.
OI and spot CVD decline alongside the price, when will a recovery commence?
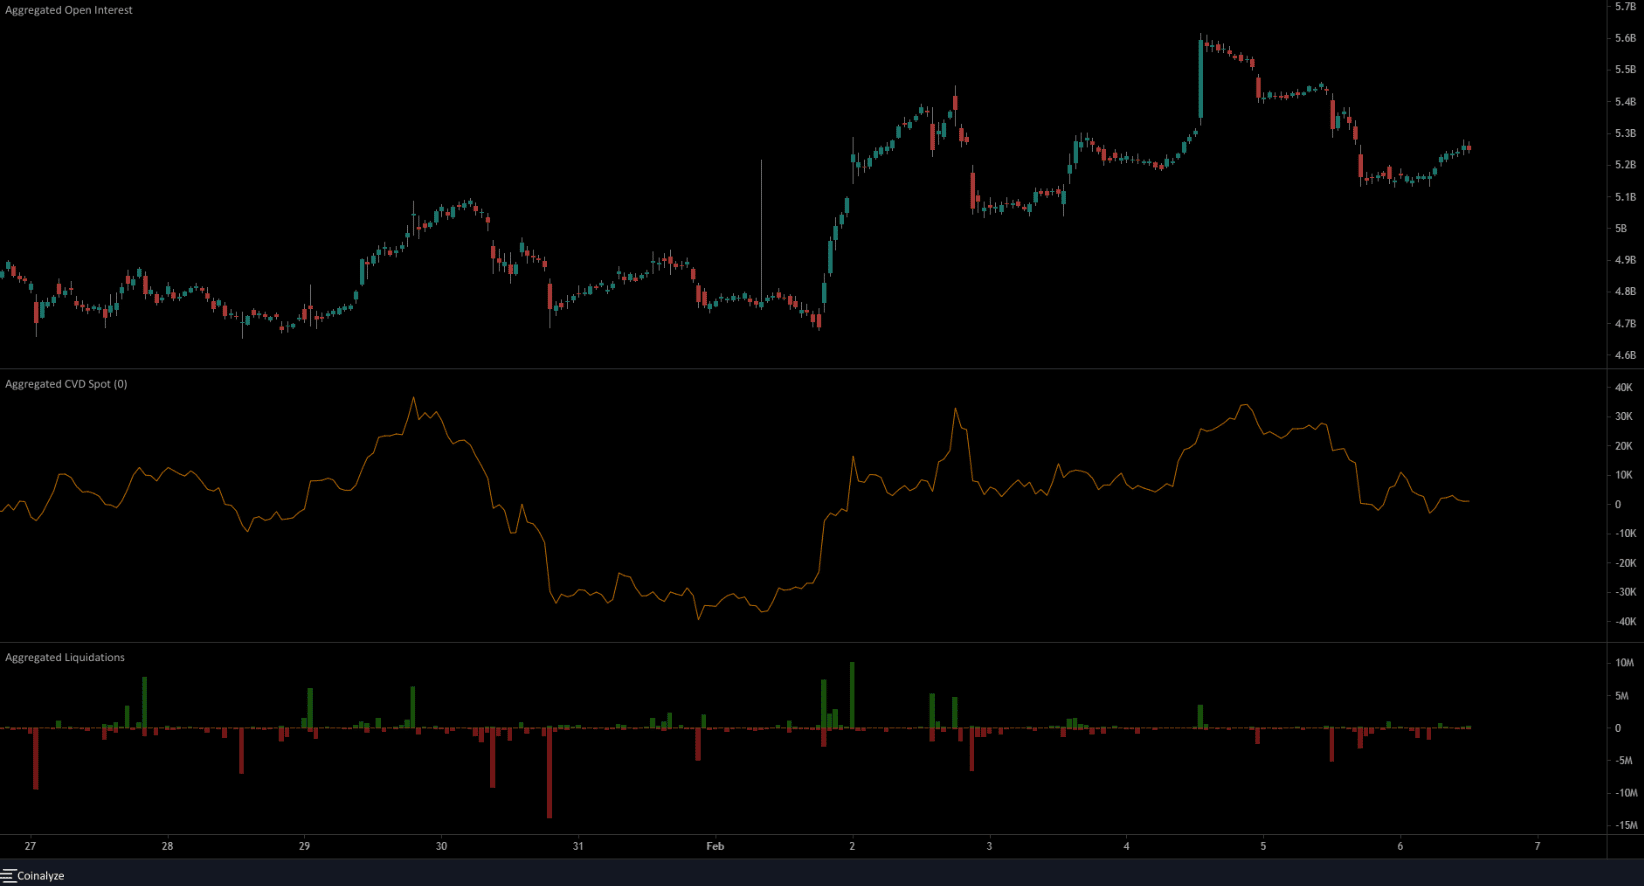
Source: Coinalyze
The Open Interest increased during times when the price saw near-term surges. Similarly, the OI receded when the price slipped lower.
This meant the majority of the market preferred not to fade ETH pumps on lower timeframes and highlighted a bullish bias. However, a strong surge in OI alongside prices would be necessary to initiate the next leg higher.
Liquidation data showed $5.3 and $2.99 million dollars worth of long positions liquidated on February 5 within two hours of trading.
More long liquidations can be expected if the price hits $1560, and a spike in this metric followed by a sharp move back above $1590 can tip buyers off that the local bottom had arrived.
Meanwhile, the spot CVD has dropped over the past two days. This was in agreement with the slump ETH saw in the same period.