Analysis
MATIC approaches the lows of a near-term range, what next?
Disclaimer: The information presented does not constitute financial, investment, trading, or other types of advice and is solely the writer’s opinion.
- The lower timeframe market structure was bearish.
- The presence of the range lows and bullish breaker can see recovery toward the range highs.
Bitcoin is likely to see strong demand in the $22.3k-$22.6k area. Monday’s trading could see BTC visit these lows and bounce higher. On the other hand, a drop beneath $22.2k is likely to see BTC recede to $21.6k and as low as $20.8k.
How much is 1, 10, 100 MATIC worth
In a similar vein, MATIC also approached a steadfast area of support. A bounce in MATIC prices can be expected, owing to the presence of a divergence as well as a bullish breaker.
MATIC could have formed a range, and the lows can soon be retested
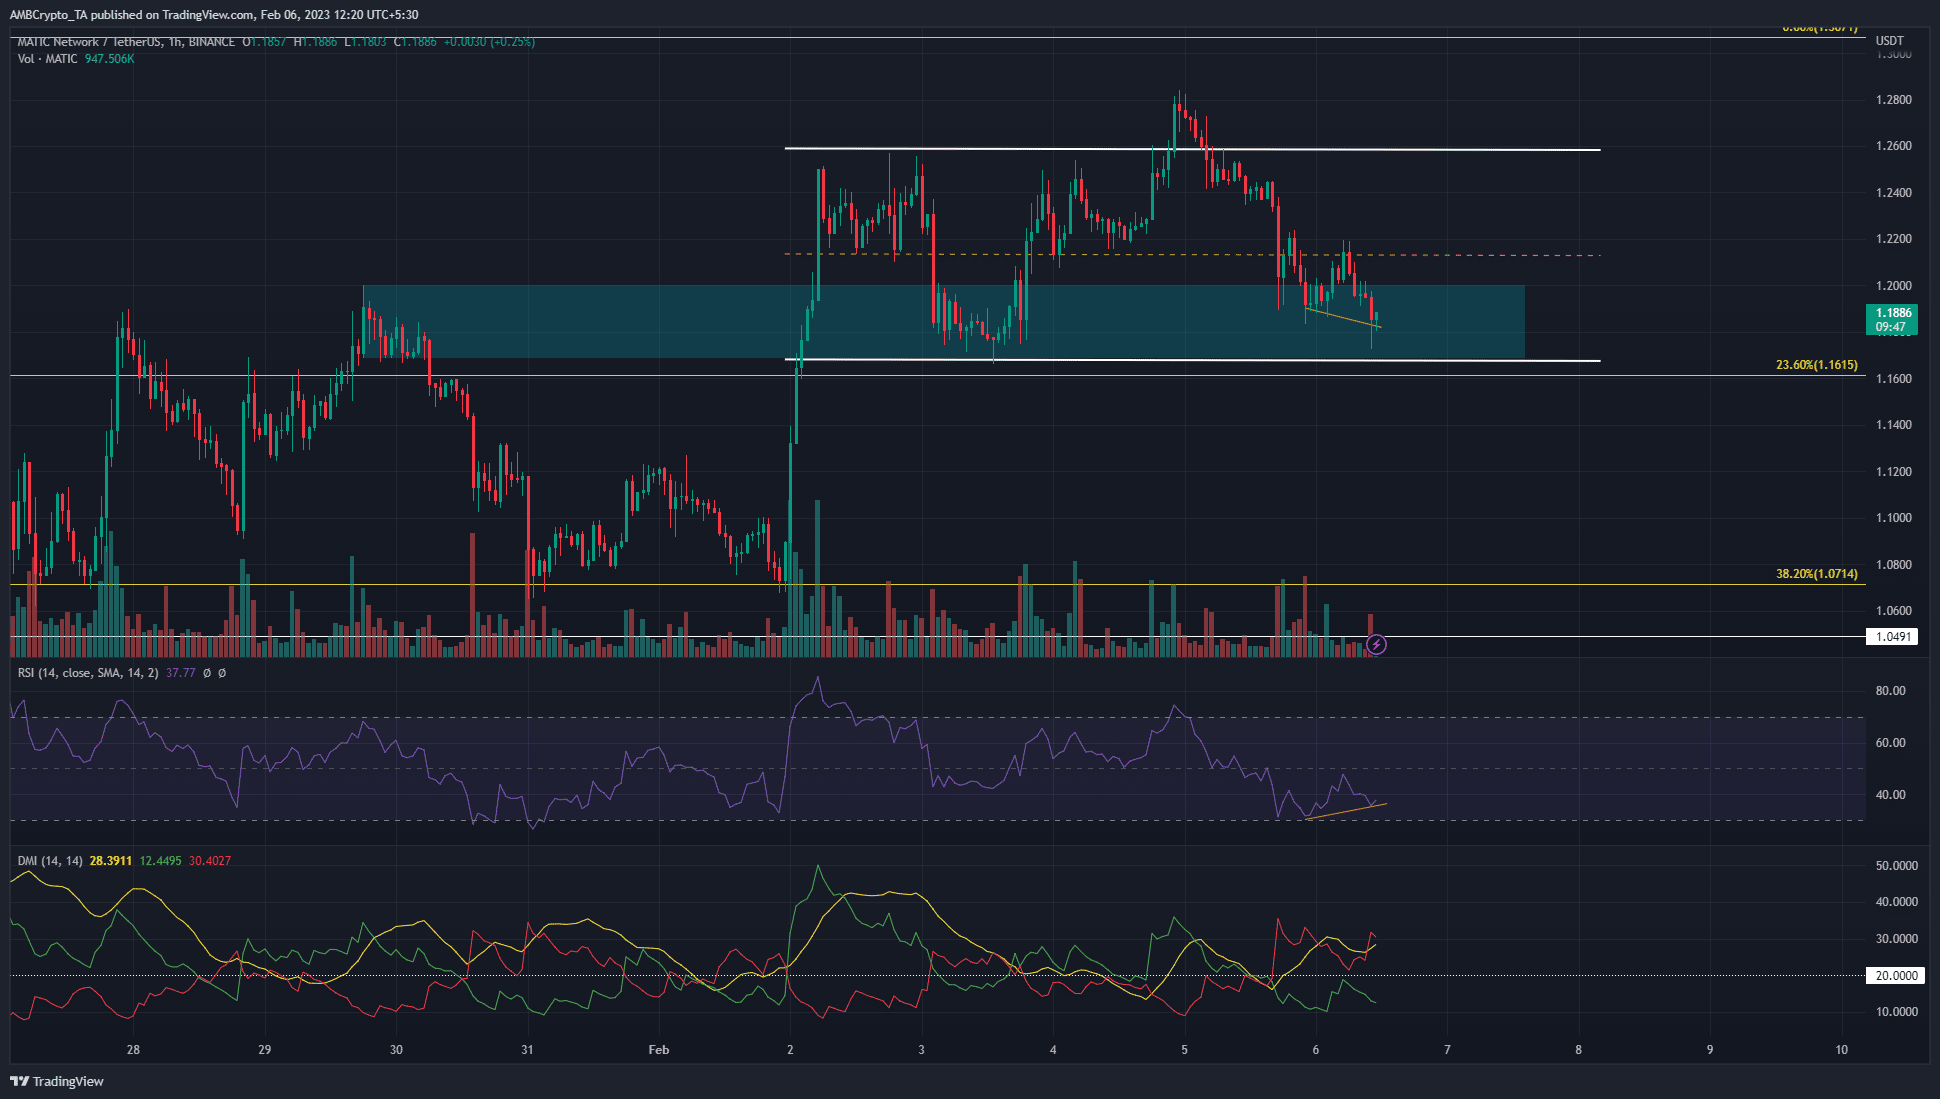
Source: MATIC/USDT on TradingView
On the 1-hour chart, a near-term range for MATIC was highlighted in white. This range extended from $1.168 to $1.259, with the mid-range at $1.21.
The mid-range value has acted as support and resistance over the past few days, which reinforced the credibility of the range formation.
The lows near $1.16 have confluence with a 4-hour bullish breaker from late January. Previously a bearish order block, the $1.16-$1.2 area was breached on 2 February. At the time of writing, it was retested as a zone of demand.
Realistic or not, here’s MATIC’s market cap in BTC’s terms
Moreover, on the H1 chart, the price made lower lows while the RSI made higher lows. This was a bullish divergence and MATIC could soon bounce toward the range highs. However, a sweep of the $0.167 area also remained a possibility.
A session close beneath the range low would flip the structure to bearish. As things stood, the RSI at 37.7 showed strong bearish momentum. The DMI also showed a strong near-term downtrend in progress, evidenced by both the -DI and the ADX above 20.
Spot CVD decreases to signify sellers’ strength
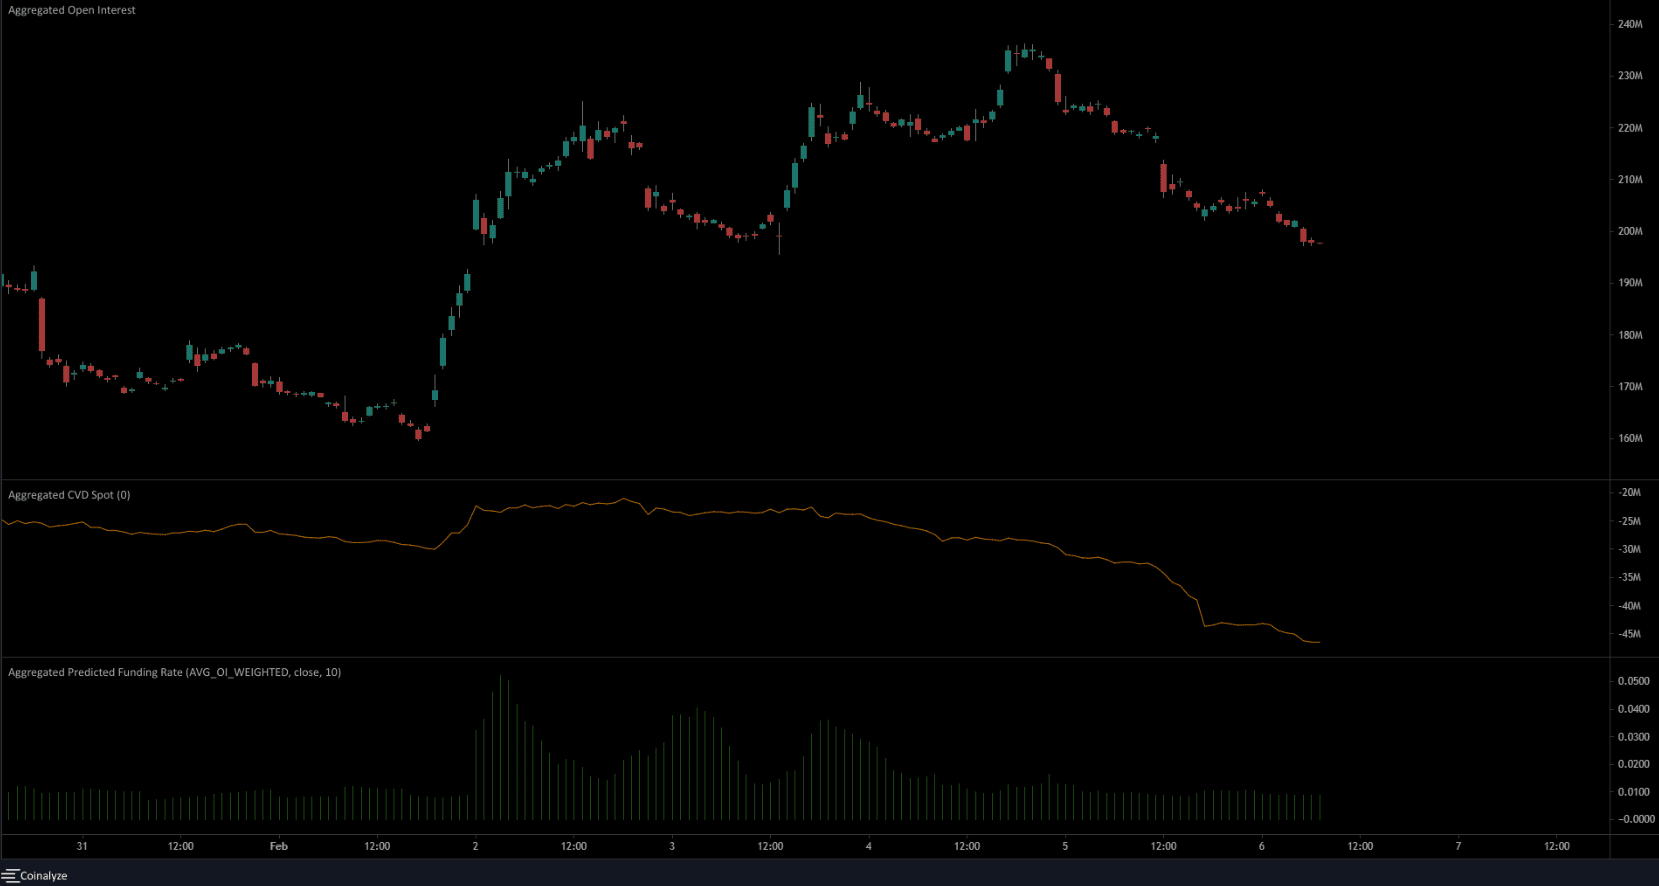
Source: Coinalyze
Even though the predicted funding rate remained positive to highlight bullish sentiment, the spot CVD has been in decline since 3 February. This meant selling pressure was witnessed in the past few days, especially on 5 February when MATIC tried to break out past the range highs.
The quick retracement back to the range lows meant that bears had control of the lower timeframes. The falling OI alongside the slump in prices reinforced this idea. Risk-averse traders can wait for a bounce from $1.16, while more aggressive traders can look to set bids around $1.17 to catch a bounce.