Altcoin
Fantom: A bull run or a bull trap? These metrics suggest FTM is…
- Fantom [FTM] has surged 200% since its price rally began in January.
- Several metrics are suggesting a bull run except for the MVRV ratio.
Fantom [FTM] is undoubtedly one of the coins in the market that saw a significant surge in January. When seen on a daily timeframe, it rallied by 200% from January 1 until the time of this writing.
The asset was trading at about $0.5 at press time, a price range last seen in May 2022. However, the price was still a long way down from its peak, which was almost $3.
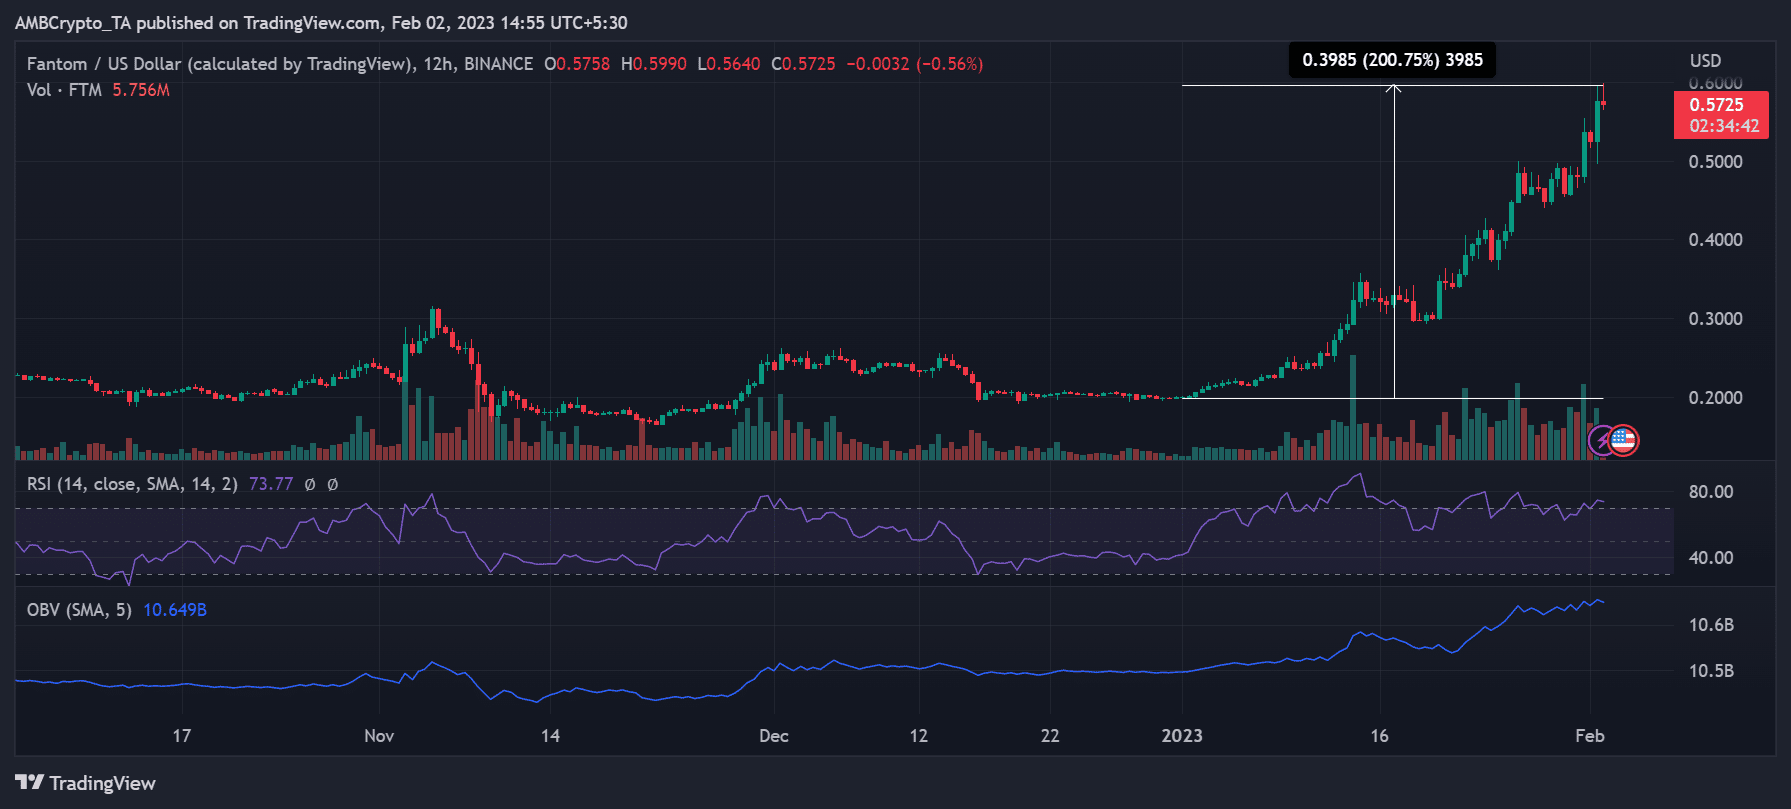
Source: Trading View
Read Fantom’s (FTM) Price Prediction 2023-24
FTM was in a bull trend at the time and a powerful one at that, according to the Relative Strength Index (RSI). The RSI line had crossed the overbought boundary and was over 70. Is this a bull run or a bull trap?
Positive metrics suggest a bull run
The observed price chart showed that the price movement so far has been impressive. However, the strength and health of the price change can only be determined by taking into account the volume metric.
A glance at the Santiment volume metric revealed a recent uptick in Fantom (FTM) volume. It is common for trading volume to slow or even stop growing while prices rise rapidly. However, with Fantom, that’s not the case at all.
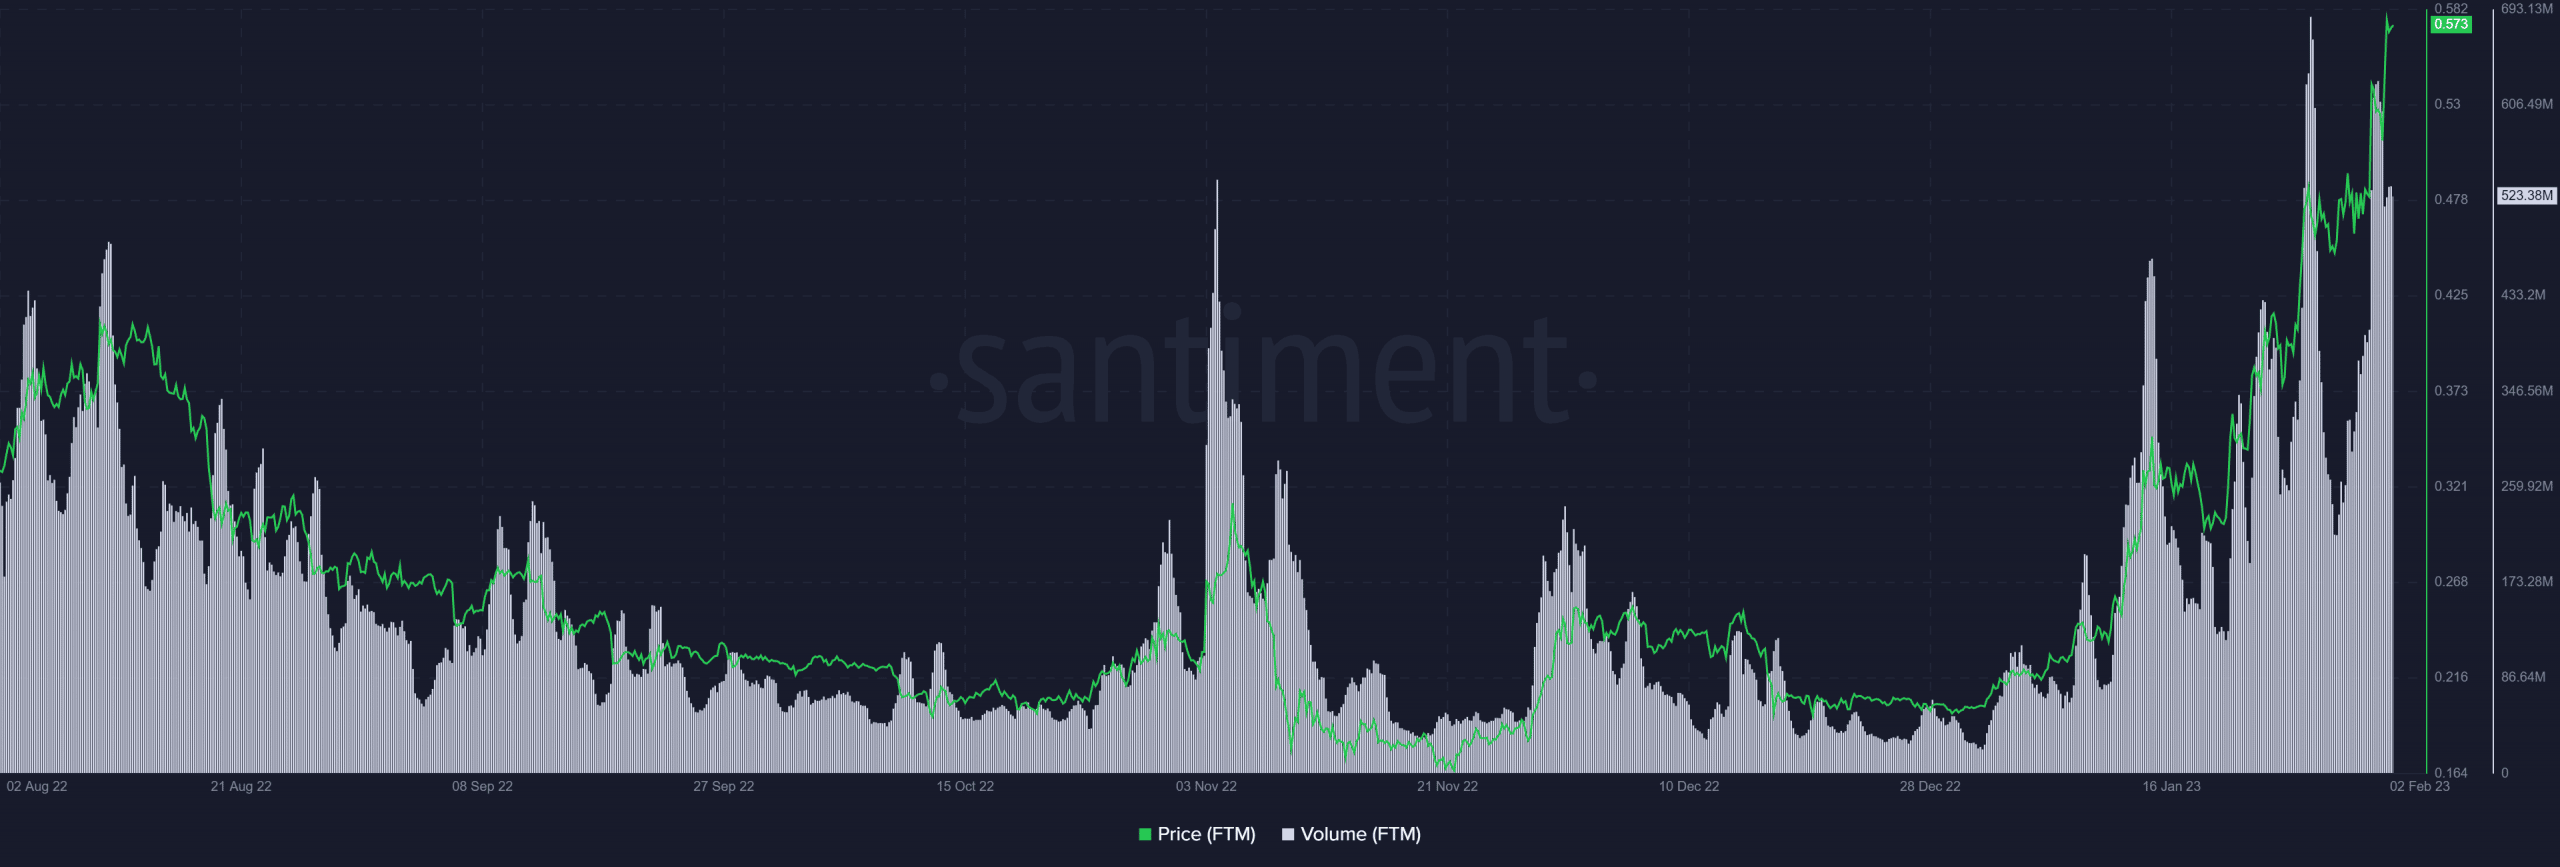
Source: Santiment
An examination of the whale transaction measure further revealed that whale activities had increased significantly during the past few weeks.
It’s also clear that the bulk of the accumulations produced through whale transactions occurred on January 19 and 20. This rather significant increase in the relatively slight FTM price drop suggested that the uptick in January was only getting started.
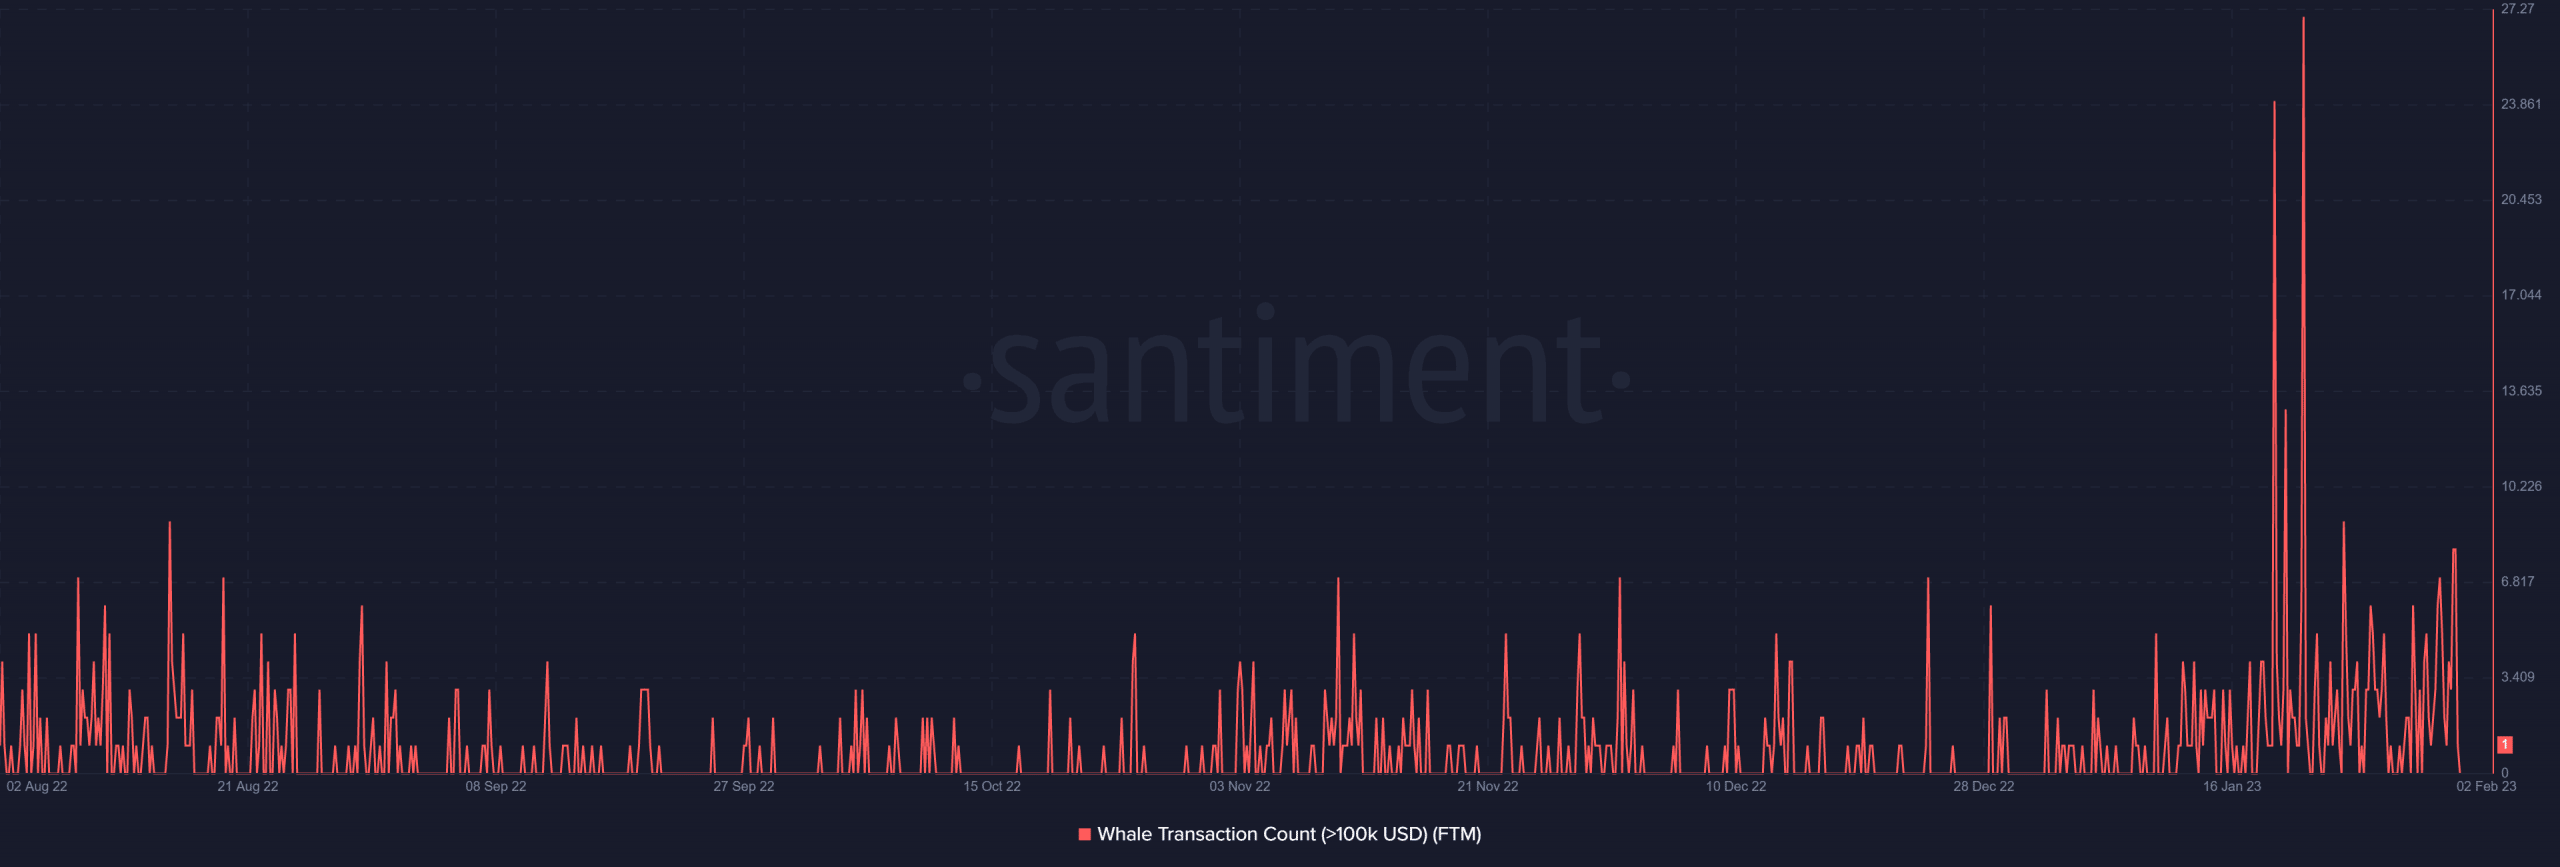
Source: Santiment
The Mean Dollar Invested Age, which gauges the average age of investments for Fantom, dropped significantly in the second part of February.
The drop in this metric was suggestive that the rally is still very much on. A healthy amount of activity meets this price increase from previously inactive currencies, which is a positive indicator.
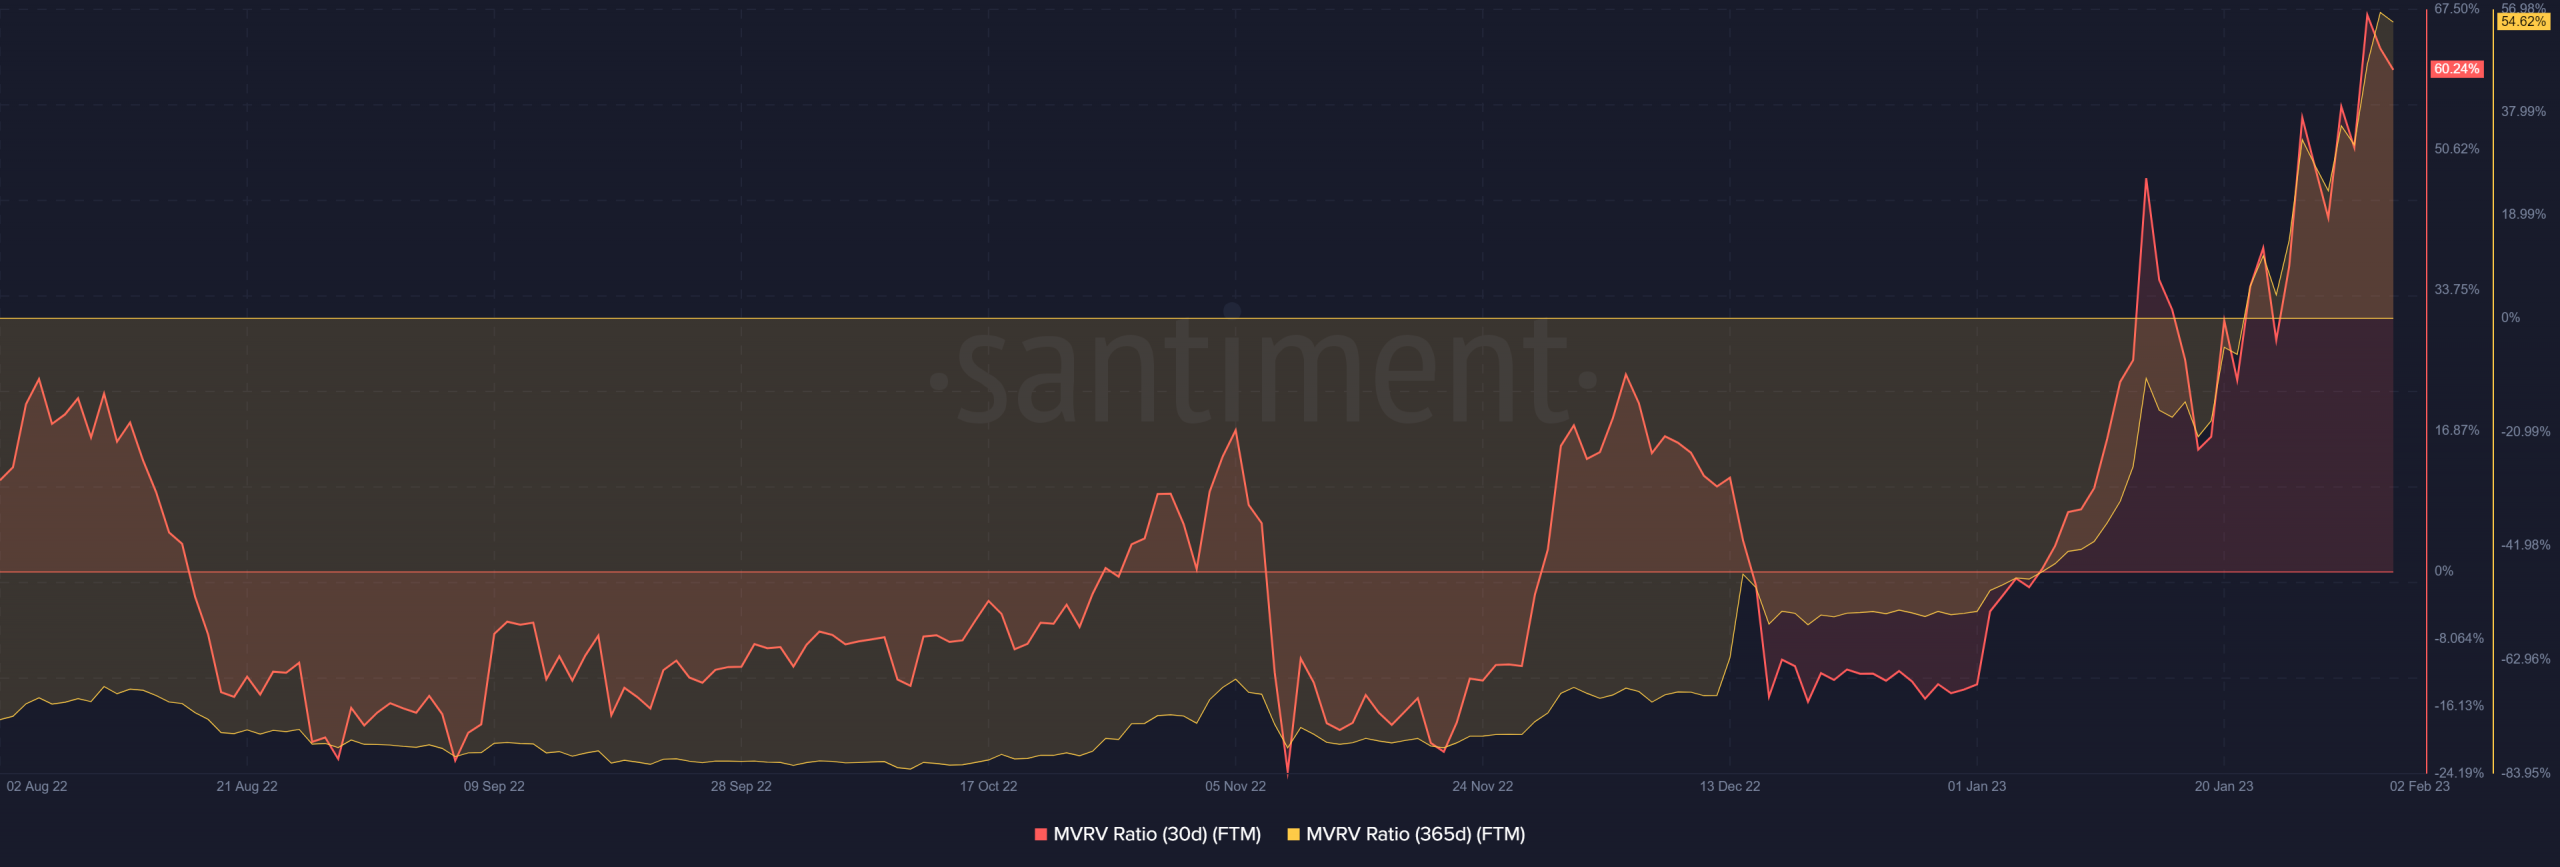
Profitable and caution signal from the NVRV
The Market Value to Realized Value ratio (MVRV) revealed a level that might be both thrilling and a warning.
Fantom (FTM) demonstrated a high level of profitability for its owners, with a 30-day MVRV of 61.49%. The 365-day MVRV, which was seen at about 55.83%, likewise demonstrated a significant level of profitability.
Although the MVRV level is thrilling for investors, it is overvalued at its current level in both periods, which suggests that there may be a market correction.
Source: Santiment
Is your portfolio green? Check out the Fantom Profit Calculator
Overall, these metrics suggest a bull run and a continuation of the asset’s current price surge. The MVRV, which indicates a potential price reversal, was the lone caution indicator.