Analysis
Binance Coin breaks above $320 with conviction; where to next?
Disclaimer: The information presented does not constitute financial, investment, trading, or other types of advice and is solely the writer’s opinion.
- Binance Coin surged above resistance; retracement could be a buying opportunity.
- The market structure remained bullish.
Binance Coin [BNB] beat the 12-hour bearish order block near $316 after two weeks of struggle. In late November 2022 and since mid-January 2023, the $315 zone presented stiff resistance to BNB bulls.
How much is 1,10,100 BNB worth today?
$332 and $350 are the imminent major levels of resistance for Binance Coin. Bitcoin [BTC] itself has a bullish outlook, although it too faced some resistance around $24.5k. If BTC continues to tick upward, the rest of the altcoin market is likely to follow.
The H12 order block at $320 was beaten convincingly
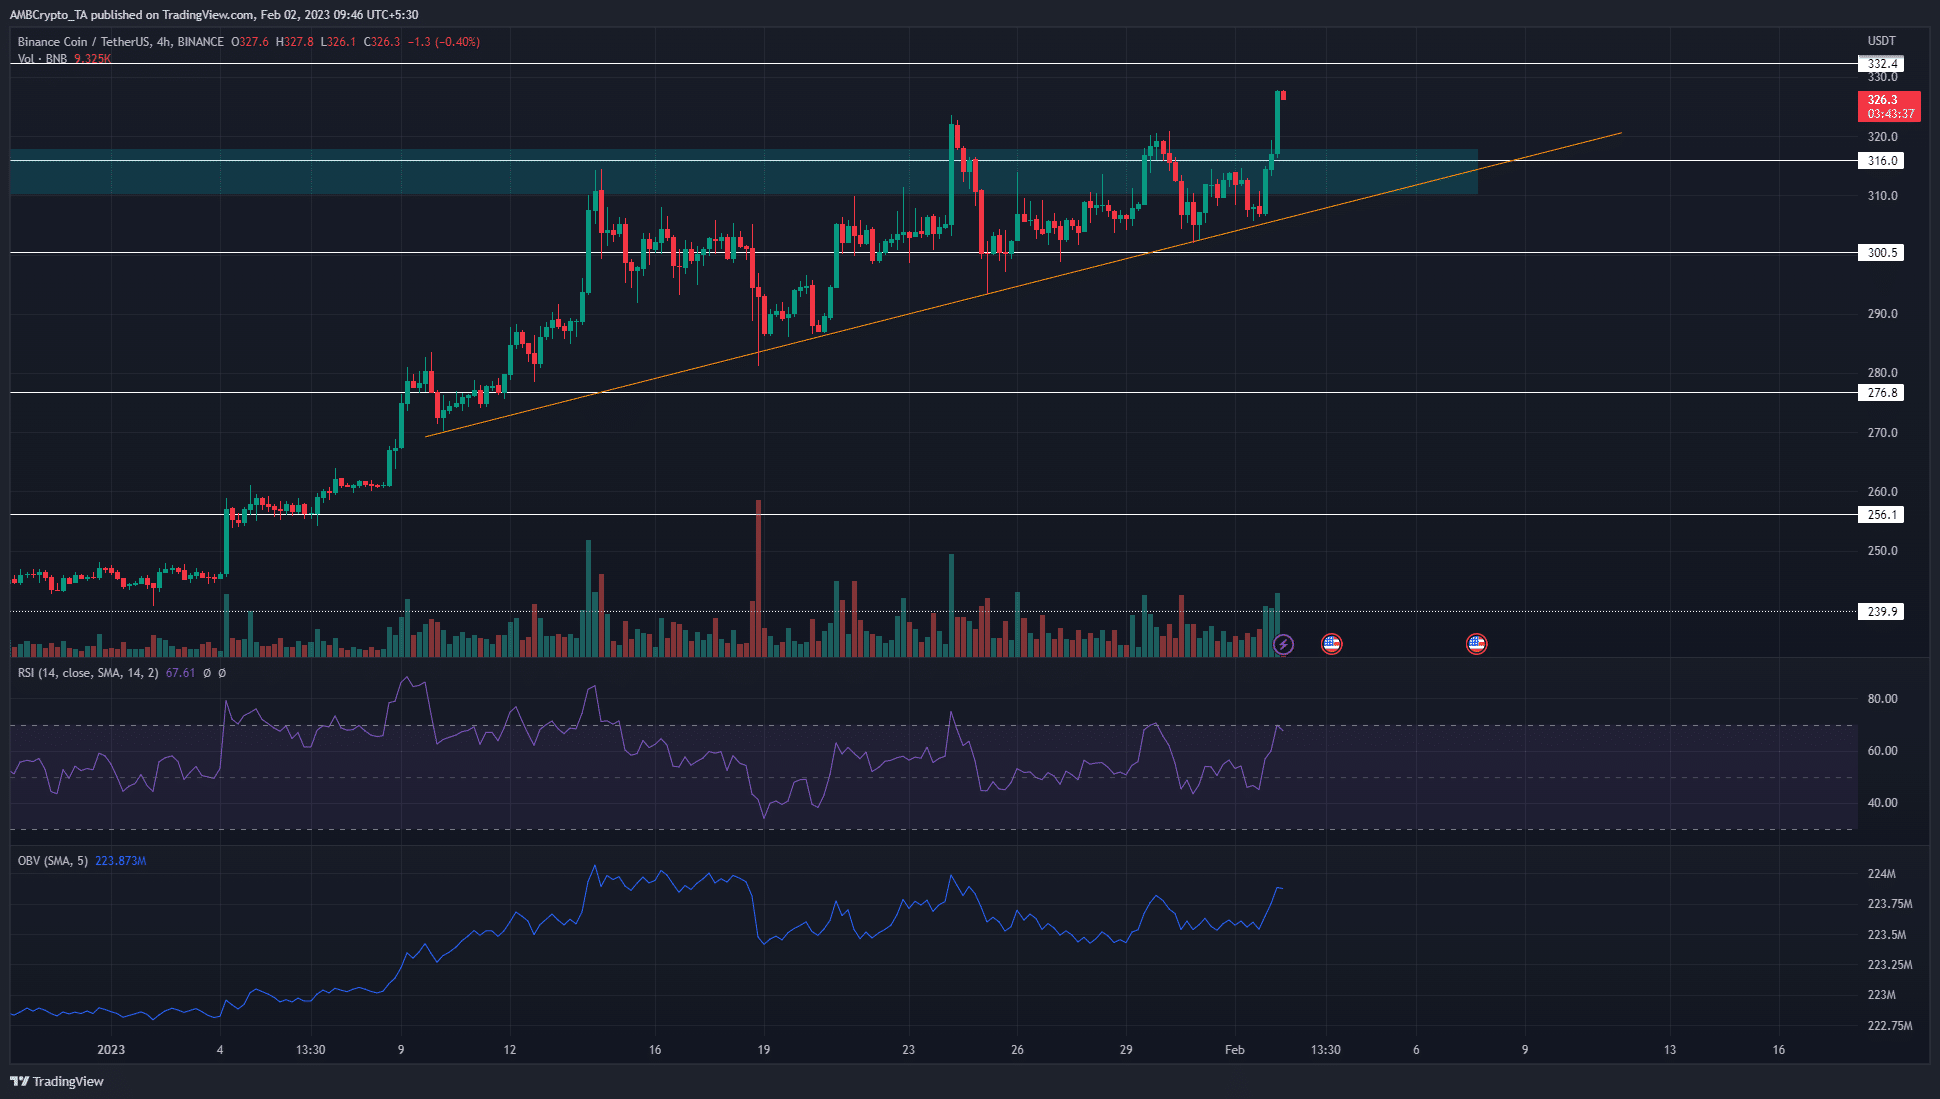
Source: BNB/USDT on TradingView
The first two days of February saw large green candles on Binance Coin. Over the past few days, since 25 January, the $300 zone was tested multiple times. Each candlewick in that area saw a bounce, which indicated that buyers held firm.
The orange trendline support of the past two weeks was not broken either. $315 has been significant in the past. In late November, a move into this resistance zone saw BNB crash to the $223 low just two weeks thereafter.
However, the four-hour session close above $320 was bullish. A retrace into the $307-$310 would be ideal for buyers, but Binance Coin could be set for a more aggressive move upward. In that case, bulls should be prepared to bid on a retest of the $319-$323 zone. It is also possible that BNB catapults higher in the coming hours.
Rather than FOMO-ing, buyers can wait for price action to develop and wait for a flip of $332 to enter longs. To the north, the $350-$360 region represented an H12 bearish order block where bulls can take profit at.
Spot CVD and Open Interest see enormous gains
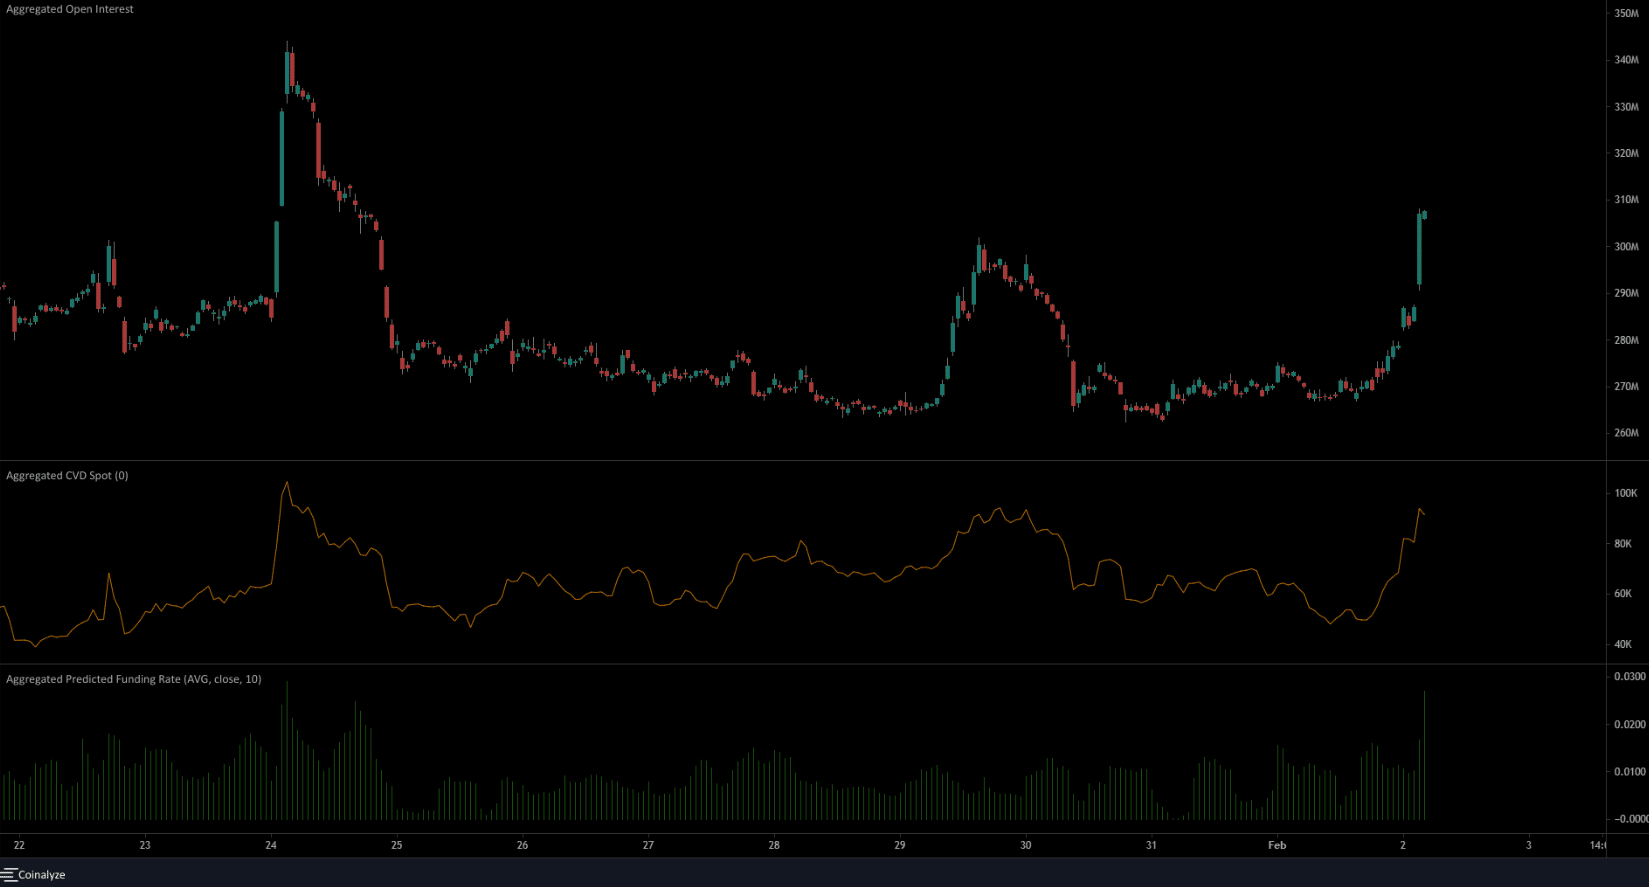
Source: Coinalyze
The one-hour chart of BNB on Coinalyze showed that the past couple of days saw the spot CVD take a massive U-turn. This showed strong demand from buyers and indicated that the rally was likely to continue upward.
Realistic or not, here’s BNB’s market cap in BTC’s terms
The predicted funding rate was positive as well, and has remained so for the past two weeks. This suggested that market participants have been bullish overall. The market structure flipped bullish after BNB broke past $256 early in January. A move back below the $300-$304 mark will flip this bias to bearish.
The surge in OI alongside the prices pointed toward bullish dominance and suggested a bearish flip was unlikely to happen soon.