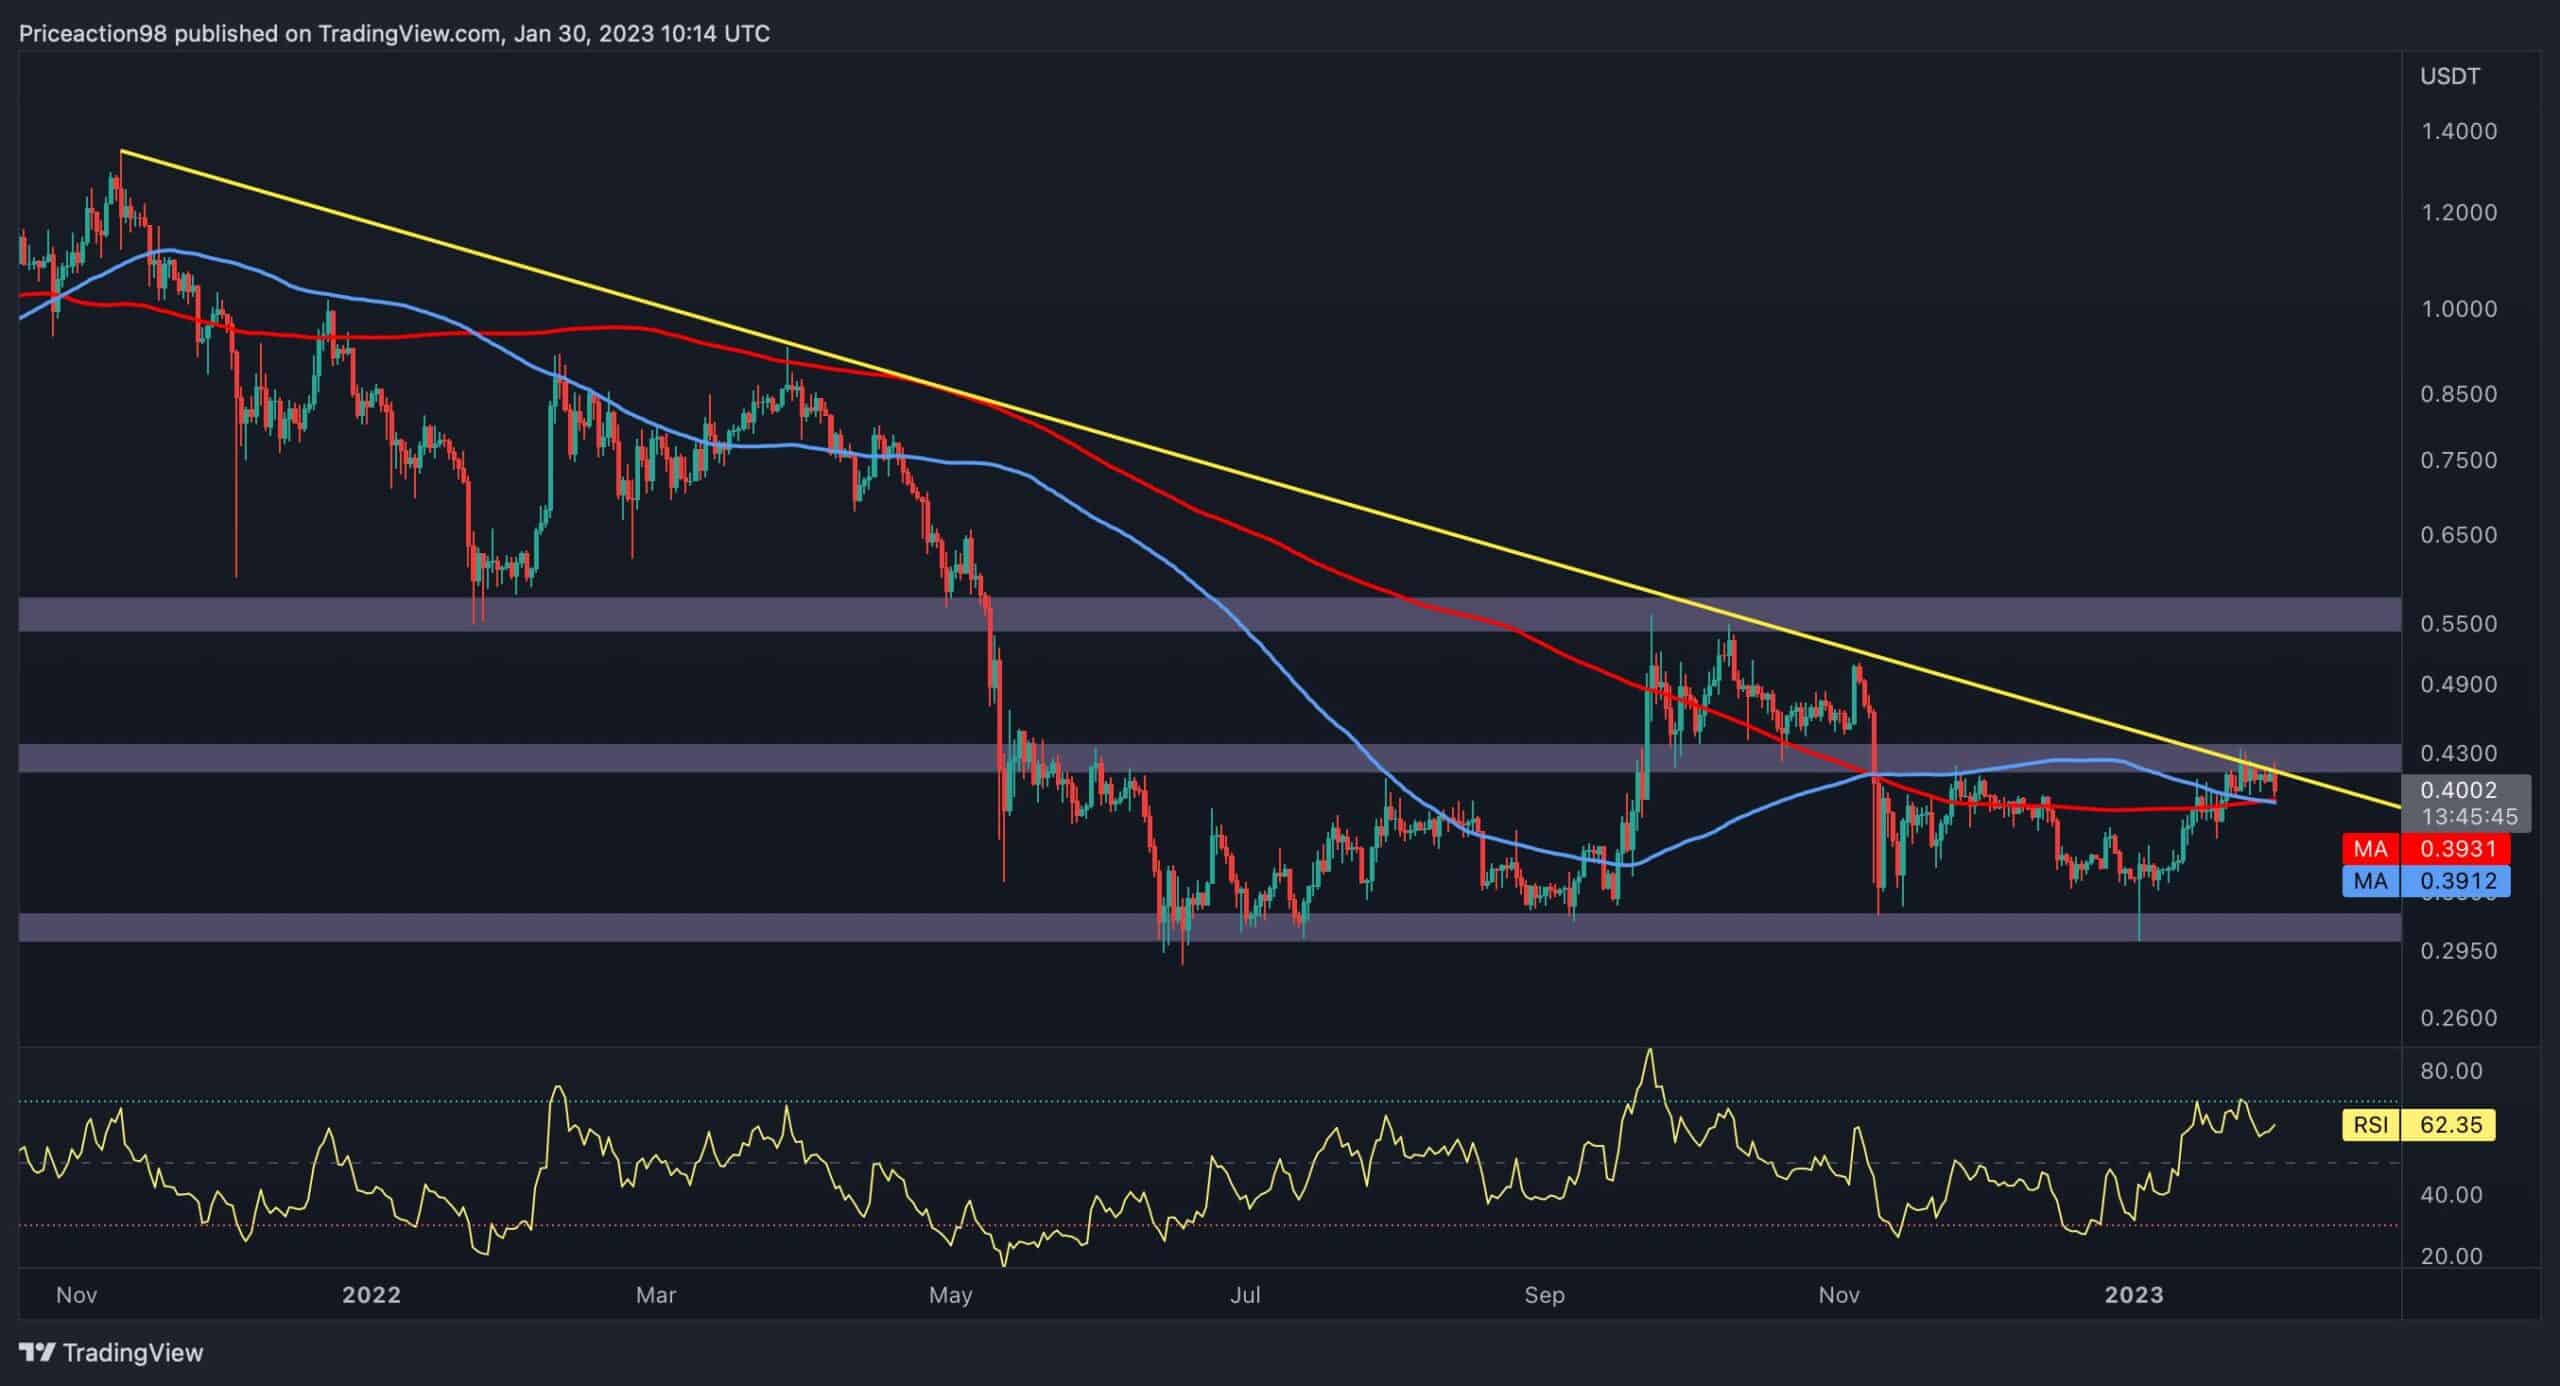
It seems that the XRP has been trapped in a range between $0.32 and $0.44 for several weeks. Most recently, the uptrend, which began at $0.32, stalled after hitting a resistance level.
By Shayan
Last week, XRP’s price printed a significant bullish sign by claiming the 100-day and 200-day moving averages at roughly $0.39. However, the rally was stopped after hitting the multi-month descending trendline as well as the $0.44 crucial resistance level.
Meanwhile, the 100-day moving average has recently dropped below the 200-day moving average, a well-known bearish sign for the price in the mid-term. Presently, the cryptocurrency is consolidating in a tight range between the 100-day and 200-day moving averages at $0.39 and the descending trendline roughly at $0.41. The price will probably exit this tight price zone in the upcoming days, and the breakout’s direction will determine Ripple’s next move.
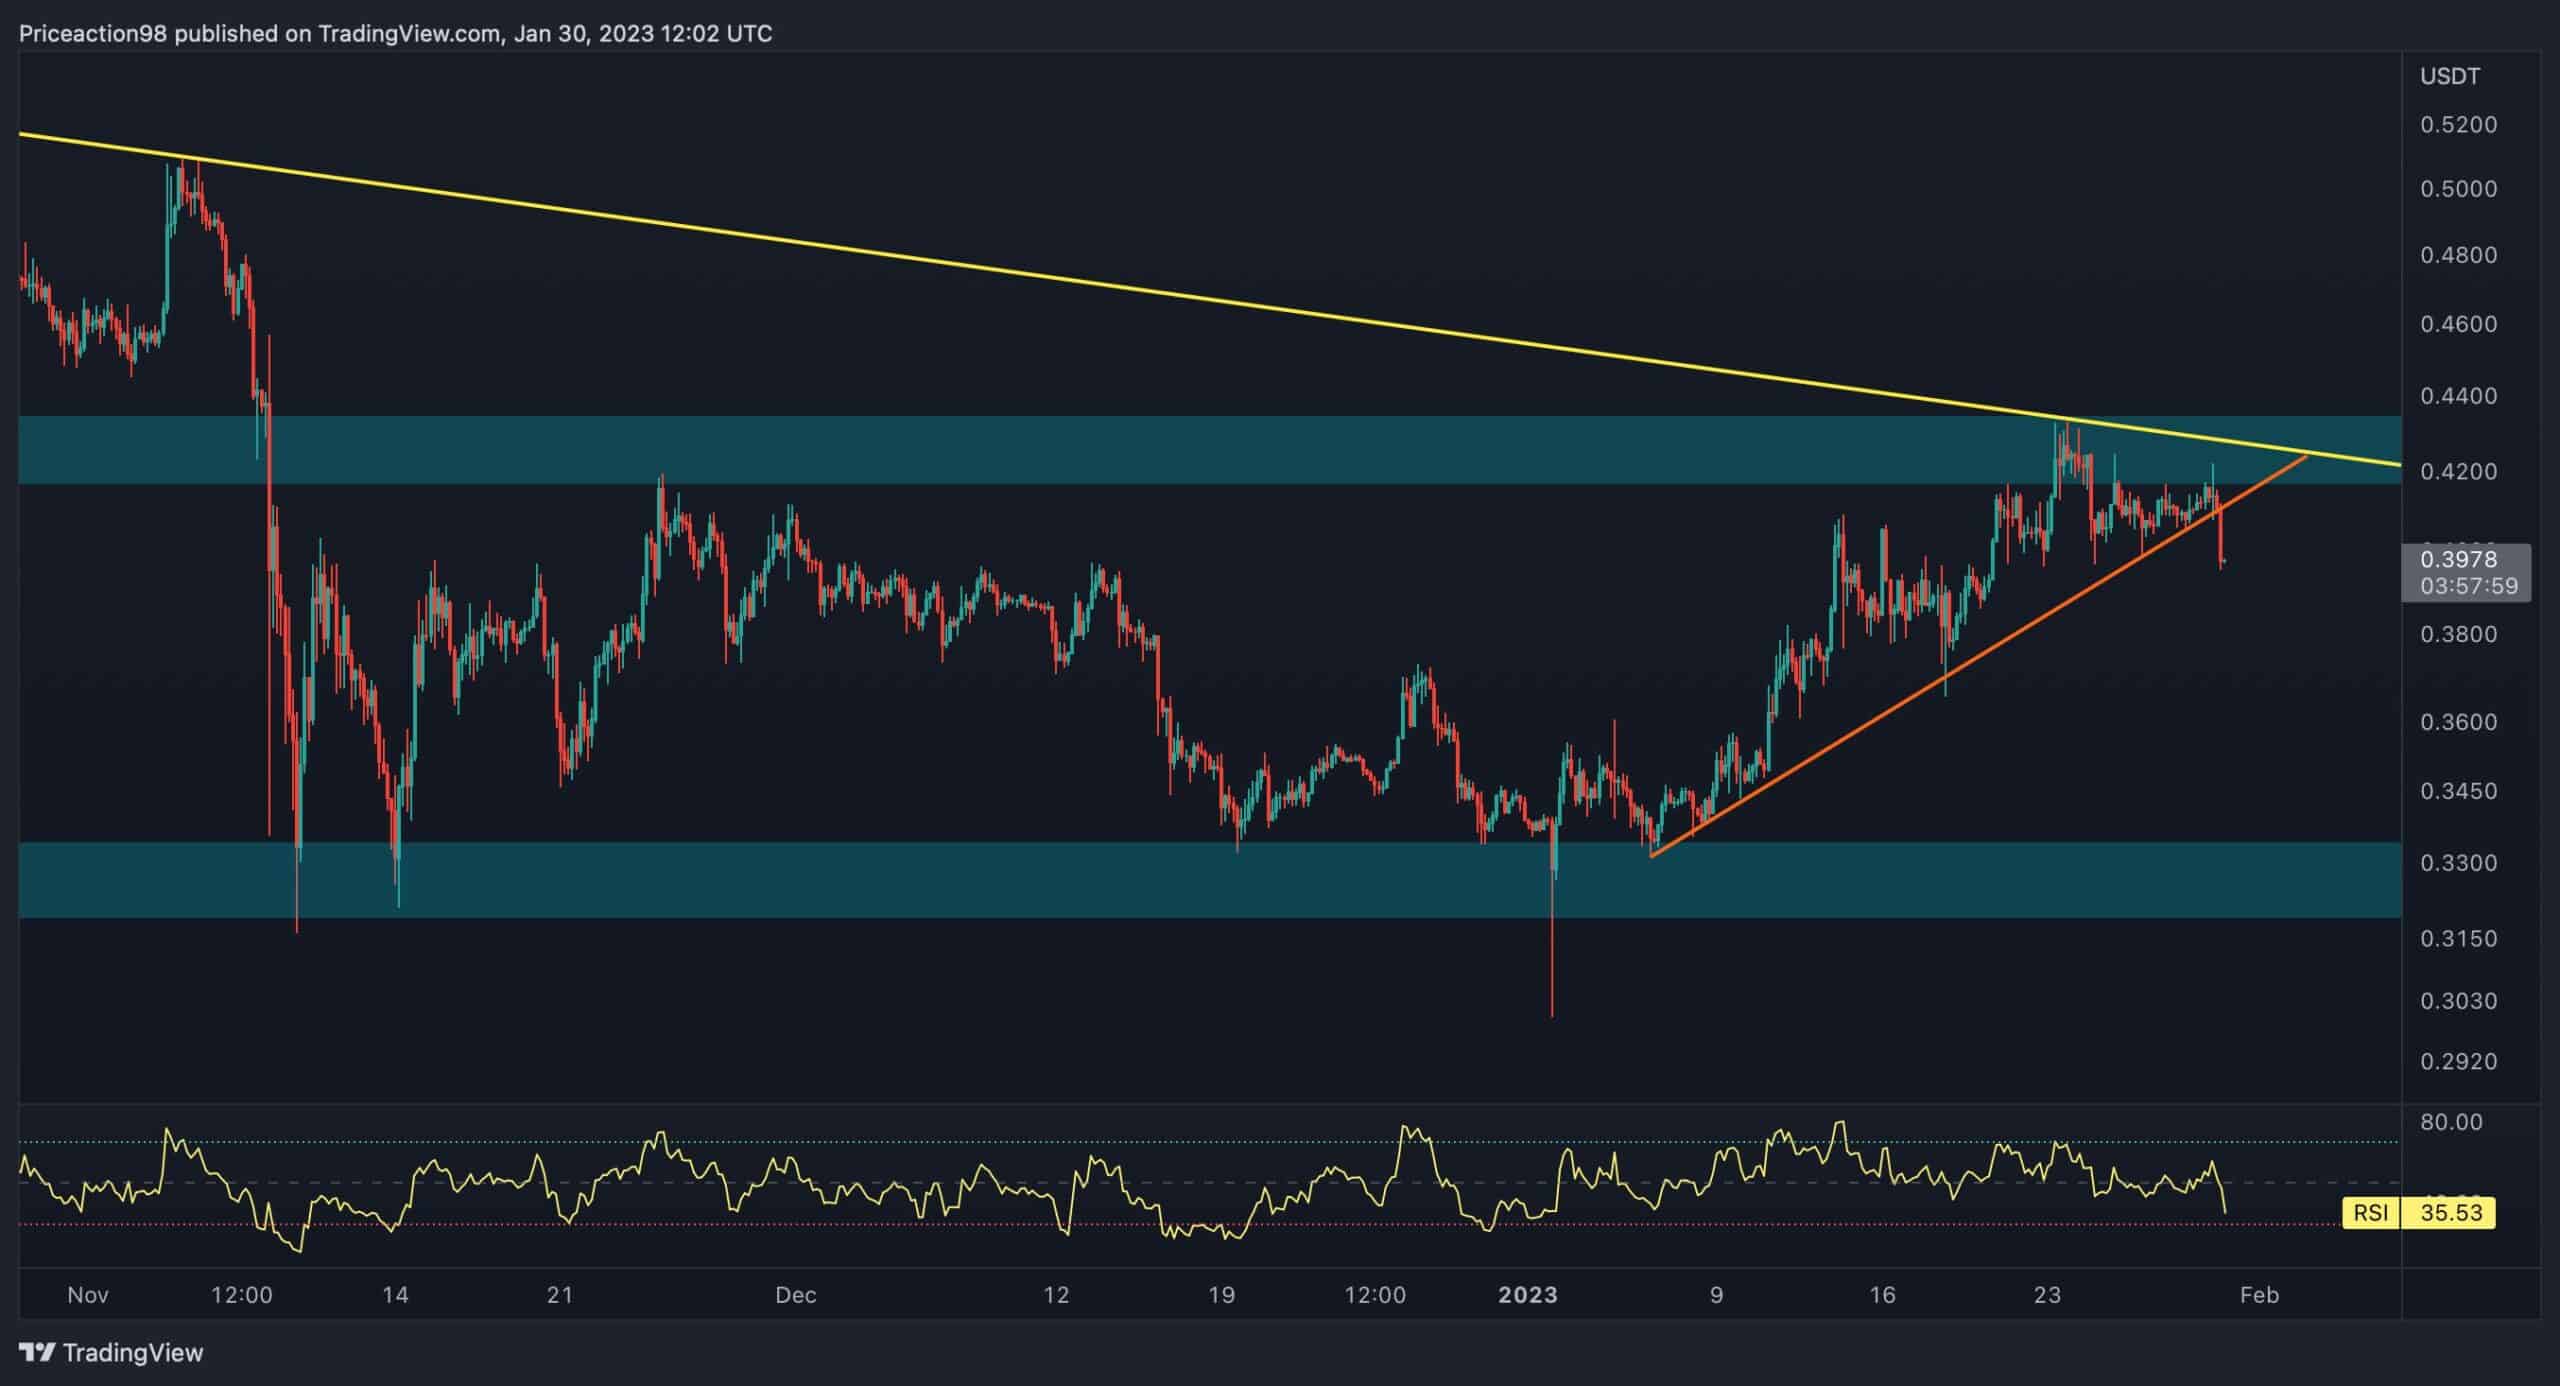
In the 4-hour timeframe, the weakening bullish momentum is evident as the rally’s pace has slowed down, resulting in a rather choppy price action. After reaching the resistance zone of $0.44, the cryptocurrency was rejected and entered a consolidation stage.
Simultaneously, XRP also fell below the short-term ascending trendline, which has been serving great support to the price during the recent rally, indicating that a short-term correction may be possible. Hence, considering all of the above, the price might face a consolidation correction phase in the mid-term run. This will end only if Ripple exits the mentioned price range with sufficient momentum.