


I have compiled the CoCo, NWS COOP & viewer snowfall totals Wednesday-Thursday.
I did tend to shy away from a lot of NWS COOP totals because measurements are only taken at 7 a.m. daily. The Purdue Ag Farm in northwestern Tippecanoe County only reported 3" for official total between measurement at 7 a.m. on Wednesday & 7 a.m. on Thursday. However, they did send 4.2" report to NWS on early Wednesday afternoon as the snow was still falling. However, due to all the melting, the 3" total is not accurate. That is a huge problem with historical NWS COOP data. Snow melts & you never get a true representation of the snowfall. I have had to do much research on snowfall totals from these stations in trying to map out historic storms as some totals make no sense in COOP record. This is why much of our historic snowfall data for Tippecanoe County back to 1879 comes from Purdue University & the Purdue Airport.
Same thing applies to Chalmers. Our spotter at Chalmers was measuring on board every 6 hours, which gave Kandy her 6.3" total for that period. However, COOP observer only had around 4" due to only two measurements in only 24 hours, as a good chunk of it melted. Same happened in southwest Pulaski County.
To solve this problem, automatic snowfall sensors need to be implemented at various COOP & airport sites. However, I have been told by NWS that these are too costly. Grissom ARB is the only station in our area that has these stations.
I would greatly support an ASOS/AWOS-style upgrade of snow sensors put over the area. The automatic temperature observations developed in the 1990s & was a massive undertaking, but I would encourage our government leaders & NOAA to invest in an automatic snowfall measurement program. It would be in the tens of millions of dollars, but well worth it. Our historic snowfall record is suffering due to lack of human observations.
You can see the max total at Grissom ARB taken by automatic sensor (my only hang-up is that the sensor only measures in 1" increments..........4.9", 5.4 or 5.3"" would measure 5")......
It also seemed to miss 3-hour increments in these observations by malfunction or something:

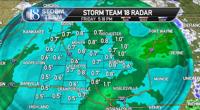
Doppler radar data for the storm shows 0.50-1.10" of liquid that fell.
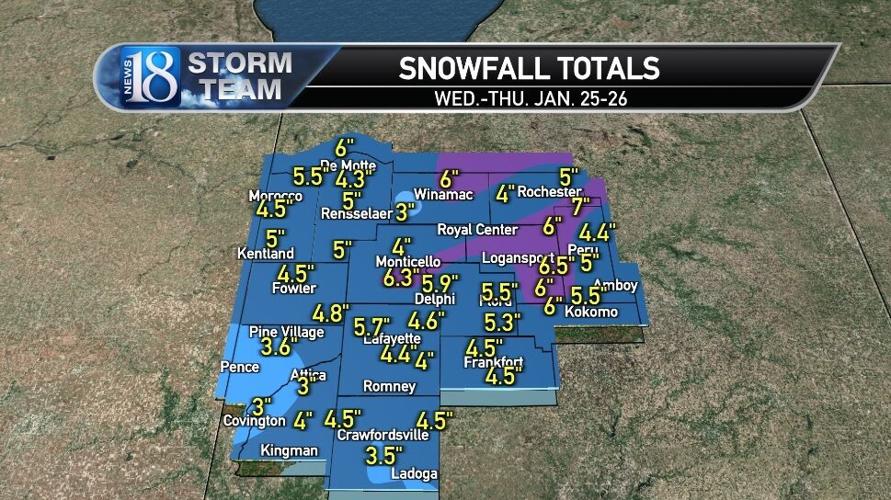
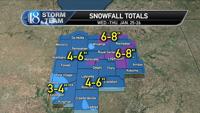
Snowfall totals varied from 3-7". The closest 8" total was near Warsaw, while up to 9.3" fell in Fort Wayne.
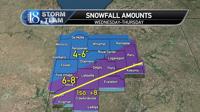
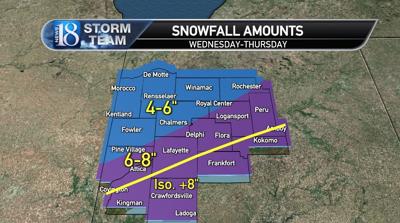
Forecast Tuesday night at 11 p.m.:

Actual amounts......
I did well with forecast totals in the north & east, but terrible in the southern areas. I go through every day, every event to grade myself & file what went right & what went wrong. The southern snowfall projections were a bust, but the total liquid was not. It was all about the temperature & trying to manufacture enough cold air at the surface evaporatively & dynamically. 1-3 degrees made all the difference! We still did get some of the fluffy snow after this wet, gloppy snow as expected, however.


Liquid:

Liquid added up well to the snowfall amounts, but it was too warm with temperatures rising to 33-36 during the storm. In fact, during the ENTIRE event, the coldest we were at our WLFI ob site was 32.3. Most areas were 31-33 for the COLDEST temperatures for the event.
However, it was cold enough aloft with a thick Snow Growth Zone with loaded moisture for large flakes. The snow really only accumulated well when it was about 32 in the morning & when the rates were 1" per hour.
The depth also greatly decreased in the afternoon with the warmth & the change-over to drizzle in parts of the area. Our depth peaked at 5.3" at our WLFI ob site, then dropped to 3.9" by Wednesday evening, then we added 0.4", that being measured Thursday late morning.
First round had 3-7" of wet cement.....second round had 0.3-1.5" of fluff.
Overall, it was a difficult snow to measure with reliance on Doppler QPF to determine liquid amounts & those spotters who measured every 6 hours making up the most-accurate representation of the event.