
A data-driven analysis of Indiana’s top 20 elementary schools
By KELLIE KELLY
Guest Columnist
 In 1983, US News & World Report published its first school ranking, “America’s Best Colleges.” US News & World Report’s ranking systems are considered by many to be the most popular and the most influential serving as a “valuable reference” when it comes to making important educational choices.
US News & World Report publishes rankings for Best Colleges, Best High Schools, Best Elementary Schools, Best Middle Schools as well as other educational rankings. The data for schools, kindergarten through 12th grade, can be found at usnews.com/education/k12. Using filters, the data can be sorted by many factors, including school name, grade level, location, and public school type. This provides a valuable data resource for parents as well as school administrators and school board members.
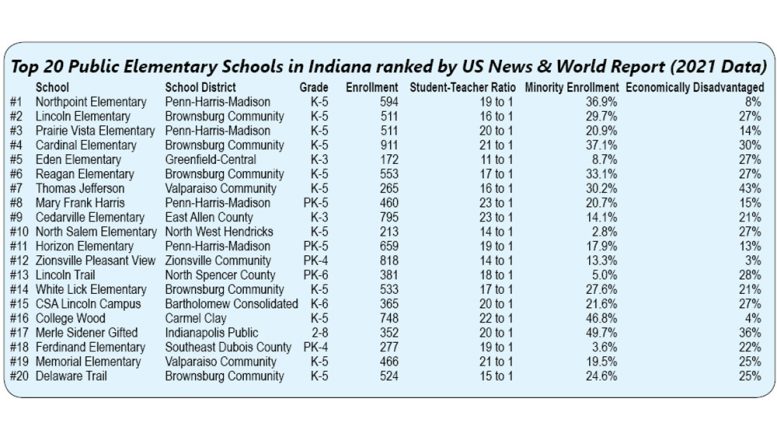
US News & World Report ranked 1,016 elementary schools across Indiana for their report titled, “The 2022 Best K-8 Schools.” The rankings are 50 percent based on mathematics and reading proficiency scores as reported on state assessments. The other 50 percent is based on mathematics and reading performance scores which take into account socioeconomic factors and historically underserved minorities. Typically, factors such as overcrowding, high student-teacher ratios, high minority enrollment percentages, and high economically disadvantaged percentages are found to be some of the causes for school populations to have lower standardized testing scores.
Let’s take a look and see what the numbers say.
Looking at the top 20 public elementary schools in Indiana, one takeaway which stands out is the fact that Brownsburg Community Schools has five elementary schools and Penn-Harris-Madison has four elementary schools on the list. The more affluent school districts, including Zionsville and Carmel Clay, each only have one elementary school to make the top 20. School size doesn’t seem to matter; elementary schools with both larger and smaller enrollments made the top 20. Student-teacher ratios averaged 18 to 1. Looking at minority enrollment, the range for the Top 20 is from 2.8 percent to 49.7 percent. The range for economically disadvantaged is from 3 percent to 43 percent.
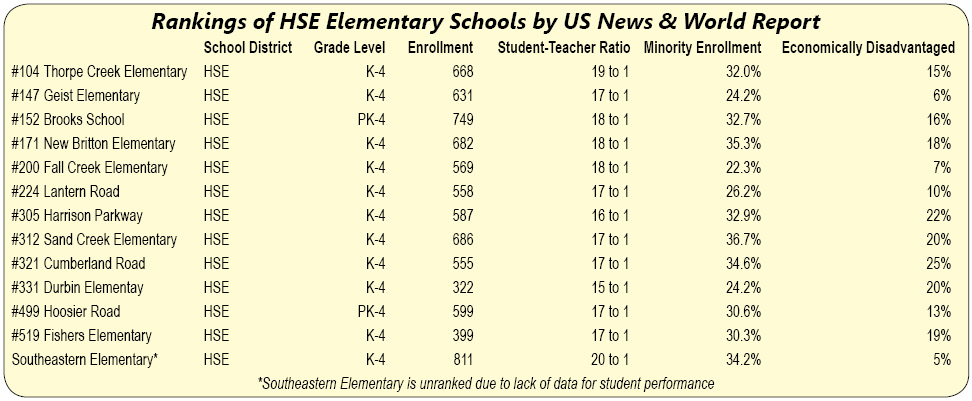
How do Hamilton Southeastern (HSE) elementary schools rank and compare with the top 20 in Indiana? Let’s take a look to compare ranking numbers, enrollment numbers, student-teacher ratios, and socioeconomic factors such as minority enrollment and economically disadvantaged percentages.
Looking at the data for HSE elementary schools, the top-ranking elementary school came in at number 104. HSE did not have a single elementary school rank in the top 100 out of 1,016 ranked elementary schools in the state of Indiana.
These rankings are calculated based on equally weighted factors of proficiency scores and performance scores. Data is based on the 2018-2019, 2019-2020, and 2020-2021 school years with school information being provided by the government. HSE Schools’ proficiency percentages are very low in comparison to nearby top performing school districts.
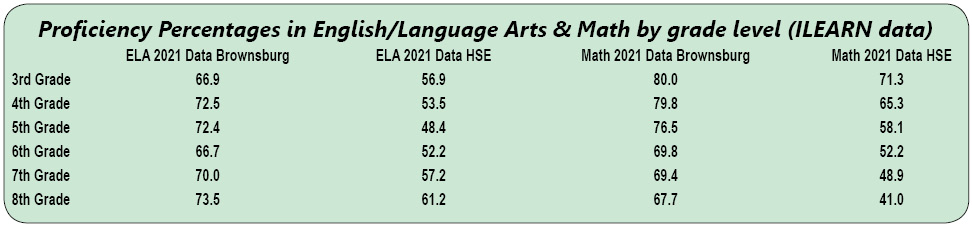
This was more than likely a sizable factor contributing to the low rankings by US News & World Report. For example, see the yellow chart below for a comparison between Brownsburg Community Schools’ Proficiency Percentages for 2021 versus Hamilton Southeastern Schools’ Proficiency Percentages for 2021 as provided by the ILEARN assessment for children in grades three to eight. (Data provided by the Indiana Department of Education)
Proficiency percentages provide a rate of student achievement – the percentage of students learning and progressing at or above grade level. Children who fall behind grade level for consecutive years may find it increasingly difficult to catch up with their peers. Keeping students at or above grade level is necessary to ensure college and career readiness.
I encourage you to check out the data available at US News & World Report and data from the Indiana Department of Education. Then, if you are concerned with Hamilton Southeastern Schools’ rankings and don’t think they are making the grade, you can help turn things around.
School board members set policy. Policy establishes priorities. Voting for school board candidates who will make policy so academic success and learning outcomes become Priority Number 1 for HSE Schools is the first step in helping the children in our community get back to grade level in both Math and English/Language Arts.
Thank you for writing this. Well done!
The premise here suggests that school board policy directly impacts student performance, if true, then the obvious question given the above would be ;
What is Brownsburg doing differently than HSE with regard to policy ?
Brownsburg school board policy ; https://go.boarddocs.com/in/browns/Board.nsf/Public#
HSE school board policy ; https://go.boarddocs.com/in/hses/Board.nsf/Public#
If the premise has merit – evidence of such should be discernable by comparison of the respective school corporations stated policy.
.
Hi Frank! Looks like there are two Franks concerned about HSE! Go figure, huh? Anyway, I think the author just wants to encourage parents to go do their own research instead of just listening to what the HSE administration always says. “Heading in the right direction”, blah blah blah. I like that she shows us the data. HSE, show us the data to back up your claims! How have all your equity initiatives improved student learning outcomes?