
The vaccine deployment in December 2020 signaled a turning point in the COVID-19 pandemic. By the end of May 2021, 40% of the U.S. population was fully vaccinated. But as vaccination rates lagged over the summer, new surges of COVID-19 came, including Delta in the summer of 2021, and now the Omicron variant, which comprises the majority of cases in the U.S.
The United States as of Aug. 5 reached over 1 million COVID-19-related deaths and 91.9 million COVID-19 cases, according to Johns Hopkins University. Currently, 67.2% of the population is fully vaccinated, and 48.2% of vaccinated people have received booster doses.
Stacker compiled a list of the counties with highest COVID-19 vaccination rates in Texas using data from the U.S. Department of Health & Human Services and Covid Act Now. Counties are ranked by the highest vaccination rate as of Aug. 4, 2022. Due to inconsistencies in reporting, some counties do not have vaccination data available. Keep reading to see whether your county ranks among the highest COVID-19 vaccination rates in your state.
Larry D. Moore // Wikimedia Commons
#50. Montgomery County
– Population that is fully vaccinated: 55.1% (334,437 fully vaccinated)
— 12.0% lower vaccination rate than Texas
– Cumulative deaths per 100k: 216 (1,314 total deaths)
— 28.7% less deaths per 100k residents than Texas
– Cumulative cases per 100k: 25,928 (157,485 total cases)
— 0.4% more cases per 100k residents than Texas
Reading Associate 17 // Wikimedia Commons
#49. Caldwell County
– Population that is fully vaccinated: 55.3% (24,138 fully vaccinated)
— 11.7% lower vaccination rate than Texas
– Cumulative deaths per 100k: 412 (180 total deaths)
— 36.0% more deaths per 100k residents than Texas
– Cumulative cases per 100k: 36,776 (16,058 total cases)
— 42.4% more cases per 100k residents than Texas
Larry D. Moore // Wikimedia Commons
#48. Guadalupe County
– Population that is fully vaccinated: 55.3% (92,269 fully vaccinated)
— 11.7% lower vaccination rate than Texas
– Cumulative deaths per 100k: 243 (406 total deaths)
— 19.8% less deaths per 100k residents than Texas
– Cumulative cases per 100k: 25,005 (41,720 total cases)
— 3.1% less cases per 100k residents than Texas
Larry D. Moore // Wikimedia Commons
#47. Medina County
– Population that is fully vaccinated: 55.4% (28,588 fully vaccinated)
— 11.5% lower vaccination rate than Texas
– Cumulative deaths per 100k: 390 (201 total deaths)
— 28.7% more deaths per 100k residents than Texas
– Cumulative cases per 100k: 21,293 (10,984 total cases)
— 17.5% less cases per 100k residents than Texas
Canva
#46. Karnes County
– Population that is fully vaccinated: 55.5% (8,656 fully vaccinated)
— 11.3% lower vaccination rate than Texas
– Cumulative deaths per 100k: 455 (71 total deaths)
— 50.2% more deaths per 100k residents than Texas
– Cumulative cases per 100k: 39,555 (6,171 total cases)
— 53.2% more cases per 100k residents than Texas
Patriarca12 // Wikimedia Commons
#45. Brewster County
– Population that is fully vaccinated: 55.7% (5,124 fully vaccinated)
— 11.0% lower vaccination rate than Texas
– Cumulative deaths per 100k: 337 (31 total deaths)
— 11.2% more deaths per 100k residents than Texas
– Cumulative cases per 100k: 12,768 (1,175 total cases)
— 50.5% less cases per 100k residents than Texas
Larry D. Moore // Wikimedia Commons
#44. San Patricio County
– Population that is fully vaccinated: 55.8% (37,214 fully vaccinated)
— 10.9% lower vaccination rate than Texas
– Cumulative deaths per 100k: 511 (341 total deaths)
— 68.6% more deaths per 100k residents than Texas
– Cumulative cases per 100k: 18,929 (12,631 total cases)
— 26.7% less cases per 100k residents than Texas
Liveon001 ©Travis K. Witt // Wikimedia Commons
#43. Blanco County
– Population that is fully vaccinated: 56.2% (6,701 fully vaccinated)
— 10.2% lower vaccination rate than Texas
– Cumulative deaths per 100k: 285 (34 total deaths)
— 5.9% less deaths per 100k residents than Texas
– Cumulative cases per 100k: 23,988 (2,862 total cases)
— 7.1% less cases per 100k residents than Texas
Larry D. Moore // Wikimedia Commons
#42. Jim Hogg County
– Population that is fully vaccinated: 56.3% (2,929 fully vaccinated)
— 10.1% lower vaccination rate than Texas
– Cumulative deaths per 100k: 423 (22 total deaths)
— 39.6% more deaths per 100k residents than Texas
– Cumulative cases per 100k: 61,096 (3,177 total cases)
— 136.6% more cases per 100k residents than Texas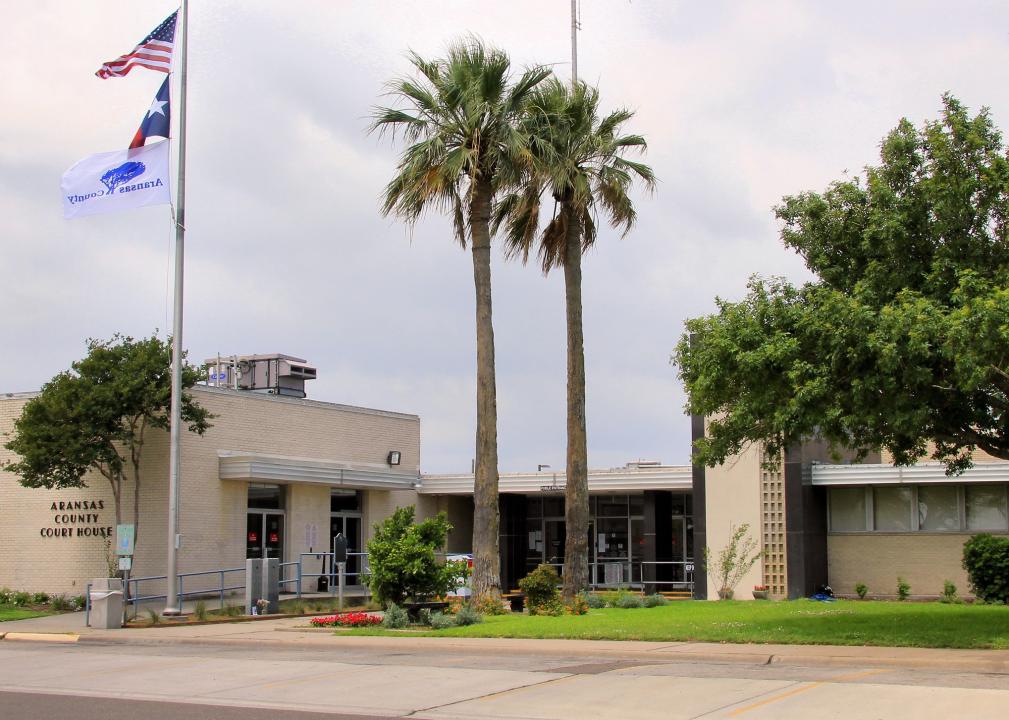
Larry D. Moore // Wikimedia Commons
#41. Aransas County
– Population that is fully vaccinated: 56.6% (13,306 fully vaccinated)
— 9.6% lower vaccination rate than Texas
– Cumulative deaths per 100k: 379 (89 total deaths)
— 25.1% more deaths per 100k residents than Texas
– Cumulative cases per 100k: 20,651 (4,855 total cases)
— 20.0% less cases per 100k residents than Texas
Mark Fisher // Wikimedia Commons
#40. Tarrant County
– Population that is fully vaccinated: 56.7% (1,192,571 fully vaccinated)
— 9.4% lower vaccination rate than Texas
– Cumulative deaths per 100k: 285 (5,998 total deaths)
— 5.9% less deaths per 100k residents than Texas
– Cumulative cases per 100k: 29,232 (614,597 total cases)
— 13.2% more cases per 100k residents than Texas
Larry D. Moore // Wikimedia Commons
#39. Bastrop County
– Population that is fully vaccinated: 57.2% (50,725 fully vaccinated)
— 8.6% lower vaccination rate than Texas
– Cumulative deaths per 100k: 272 (241 total deaths)
— 10.2% less deaths per 100k residents than Texas
– Cumulative cases per 100k: 27,480 (24,381 total cases)
— 6.4% more cases per 100k residents than Texas
Canva
#38. Nueces County
– Population that is fully vaccinated: 57.5% (208,251 fully vaccinated)
— 8.1% lower vaccination rate than Texas
– Cumulative deaths per 100k: 422 (1,528 total deaths)
— 39.3% more deaths per 100k residents than Texas
– Cumulative cases per 100k: 30,540 (110,644 total cases)
— 18.3% more cases per 100k residents than Texas
Canva
#37. Pecos County
– Population that is fully vaccinated: 57.9% (9,162 fully vaccinated)
— 7.5% lower vaccination rate than Texas
– Cumulative deaths per 100k: 449 (71 total deaths)
— 48.2% more deaths per 100k residents than Texas
– Cumulative cases per 100k: 19,573 (3,097 total cases)
— 24.2% less cases per 100k residents than Texas
Renelibrary // Wikimedia Commons
#36. Archer County
– Population that is fully vaccinated: 58.0% (4,965 fully vaccinated)
— 7.3% lower vaccination rate than Texas
– Cumulative deaths per 100k: 327 (28 total deaths)
— 7.9% more deaths per 100k residents than Texas
– Cumulative cases per 100k: 28,095 (2,403 total cases)
— 8.8% more cases per 100k residents than Texas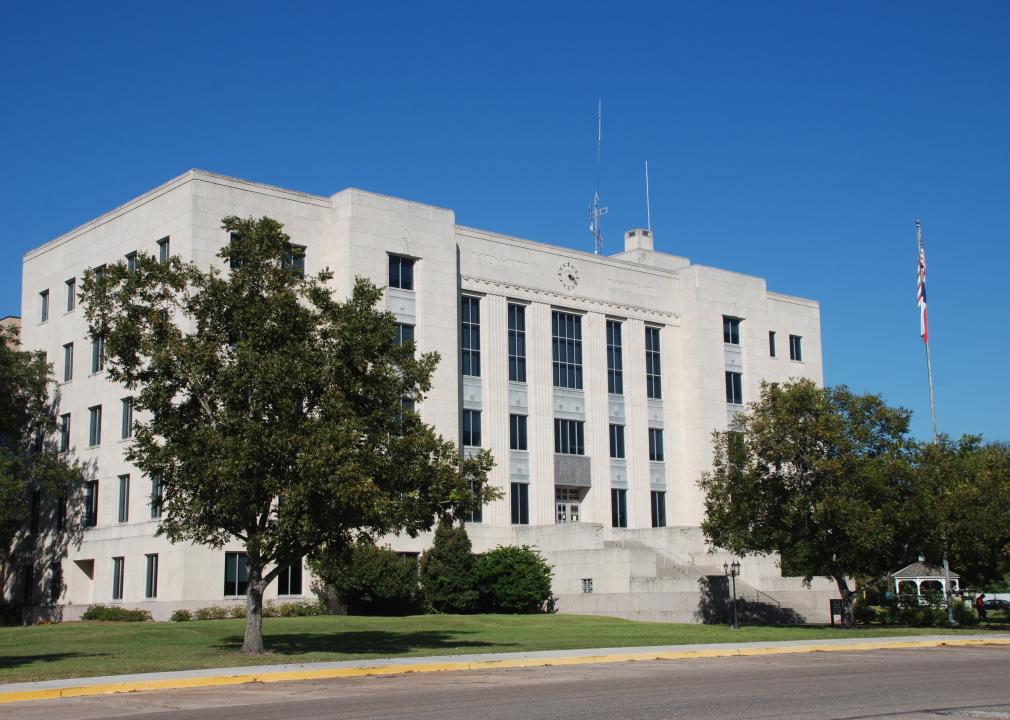
Adavyd // Wikimedia Commons
#35. Brazoria County
– Population that is fully vaccinated: 58.2% (217,876 fully vaccinated)
— 7.0% lower vaccination rate than Texas
– Cumulative deaths per 100k: 266 (995 total deaths)
— 12.2% less deaths per 100k residents than Texas
– Cumulative cases per 100k: 28,472 (106,562 total cases)
— 10.3% more cases per 100k residents than Texas
Larry D. Moore // Wikimedia Commons
#34. Rockwall County
– Population that is fully vaccinated: 58.5% (61,389 fully vaccinated)
— 6.5% lower vaccination rate than Texas
– Cumulative deaths per 100k: 255 (268 total deaths)
— 15.8% less deaths per 100k residents than Texas
– Cumulative cases per 100k: 27,475 (28,825 total cases)
— 6.4% more cases per 100k residents than Texas
Aualliso // Wikimedia Commons
#33. Bell County
– Population that is fully vaccinated: 60.1% (218,130 fully vaccinated)
— 4.0% lower vaccination rate than Texas
– Cumulative deaths per 100k: 253 (918 total deaths)
— 16.5% less deaths per 100k residents than Texas
– Cumulative cases per 100k: 20,698 (75,119 total cases)
— 19.8% less cases per 100k residents than Texas
Billy Hathorn // Wikimedia Commons
#32. Zapata County
– Population that is fully vaccinated: 60.2% (8,539 fully vaccinated)
— 3.8% lower vaccination rate than Texas
– Cumulative deaths per 100k: 388 (55 total deaths)
— 28.1% more deaths per 100k residents than Texas
– Cumulative cases per 100k: 28,154 (3,992 total cases)
— 9.0% more cases per 100k residents than Texas
Nsaum75 // Wikimedia Commons
#31. Galveston County
– Population that is fully vaccinated: 60.2% (206,096 fully vaccinated)
— 3.8% lower vaccination rate than Texas
– Cumulative deaths per 100k: 253 (867 total deaths)
— 16.5% less deaths per 100k residents than Texas
– Cumulative cases per 100k: 32,076 (109,743 total cases)
— 24.2% more cases per 100k residents than Texas
Alan Botting // Wikimedia Commons
#30. Dallas County
– Population that is fully vaccinated: 60.7% (1,600,442 fully vaccinated)
— 3.0% lower vaccination rate than Texas
– Cumulative deaths per 100k: 259 (6,829 total deaths)
— 14.5% less deaths per 100k residents than Texas
– Cumulative cases per 100k: 23,753 (626,026 total cases)
— 8.0% less cases per 100k residents than Texas
25or6to4 // Wikimedia Commons
#29. Kleberg County
– Population that is fully vaccinated: 60.9% (18,669 fully vaccinated)
— 2.7% lower vaccination rate than Texas
– Cumulative deaths per 100k: 489 (150 total deaths)
— 61.4% more deaths per 100k residents than Texas
– Cumulative cases per 100k: 27,040 (8,296 total cases)
— 4.7% more cases per 100k residents than Texas
Renelibrary // Wikimedia Commons
#28. Kendall County
– Population that is fully vaccinated: 61.5% (29,154 fully vaccinated)
— 1.8% lower vaccination rate than Texas
– Cumulative deaths per 100k: 264 (125 total deaths)
— 12.9% less deaths per 100k residents than Texas
– Cumulative cases per 100k: 18,990 (9,007 total cases)
— 26.4% less cases per 100k residents than Texas
Mick Watson from Atascocita, Texas // Wikimedia Commons
#27. Denton County
– Population that is fully vaccinated: 61.7% (547,038 fully vaccinated)
— 1.4% lower vaccination rate than Texas
– Cumulative deaths per 100k: 155 (1,379 total deaths)
— 48.8% less deaths per 100k residents than Texas
– Cumulative cases per 100k: 22,434 (199,036 total cases)
— 13.1% less cases per 100k residents than Texas
Canva
#26. Comal County
– Population that is fully vaccinated: 62.2% (97,183 fully vaccinated)
— 0.6% lower vaccination rate than Texas
– Cumulative deaths per 100k: 360 (563 total deaths)
— 18.8% more deaths per 100k residents than Texas
– Cumulative cases per 100k: 24,719 (38,613 total cases)
— 4.3% less cases per 100k residents than Texas
Larry D. Moore // Wikimedia Commons
#25. Duval County
– Population that is fully vaccinated: 62.3% (6,950 fully vaccinated)
— 0.5% lower vaccination rate than Texas
– Cumulative deaths per 100k: 627 (70 total deaths)
— 106.9% more deaths per 100k residents than Texas
– Cumulative cases per 100k: 34,409 (3,839 total cases)
— 33.3% more cases per 100k residents than Texas
Larry D. Moore // Wikimedia Commons
#24. Hays County
– Population that is fully vaccinated: 62.3% (143,470 fully vaccinated)
— 0.5% lower vaccination rate than Texas
– Cumulative deaths per 100k: 229 (527 total deaths)
— 24.4% less deaths per 100k residents than Texas
– Cumulative cases per 100k: 30,494 (70,195 total cases)
— 18.1% more cases per 100k residents than Texas
Renelibrary // Wikimedia Commons
#23. La Salle County
– Population that is fully vaccinated: 62.4% (4,696 fully vaccinated)
— 0.3% lower vaccination rate than Texas
– Cumulative deaths per 100k: 652 (49 total deaths)
— 115.2% more deaths per 100k residents than Texas
– Cumulative cases per 100k: 33,005 (2,482 total cases)
— 27.8% more cases per 100k residents than Texas
Hequals2henry // Wikimedia Commons
#22. Harris County
– Population that is fully vaccinated: 64.0% (3,016,806 fully vaccinated)
— 2.2% higher vaccination rate than Texas
– Cumulative deaths per 100k: 236 (11,132 total deaths)
— 22.1% less deaths per 100k residents than Texas
– Cumulative cases per 100k: 24,643 (1,161,493 total cases)
— 4.6% less cases per 100k residents than Texas
Larry D. Moore // Wikimedia Commons
#21. Hudspeth County
– Population that is fully vaccinated: 66.2% (3,233 fully vaccinated)
— 5.8% higher vaccination rate than Texas
– Cumulative deaths per 100k: 368 (18 total deaths)
— 21.5% more deaths per 100k residents than Texas
– Cumulative cases per 100k: 22,616 (1,105 total cases)
— 12.4% less cases per 100k residents than Texas
Matthew T Rader // Wikimedia Commons
#20. Willacy County
– Population that is fully vaccinated: 66.3% (14,168 fully vaccinated)
— 5.9% higher vaccination rate than Texas
– Cumulative deaths per 100k: 627 (134 total deaths)
— 106.9% more deaths per 100k residents than Texas
– Cumulative cases per 100k: 37,059 (7,915 total cases)
— 43.5% more cases per 100k residents than Texas
Larry D. Moore // Wikimedia Commons
#19. Collin County
– Population that is fully vaccinated: 67.7% (700,019 fully vaccinated)
— 8.1% higher vaccination rate than Texas
– Cumulative deaths per 100k: 147 (1,526 total deaths)
— 51.5% less deaths per 100k residents than Texas
– Cumulative cases per 100k: 23,325 (241,355 total cases)
— 9.7% less cases per 100k residents than Texas
Billy Hathorn // Wikimedia Commons
#18. Frio County
– Population that is fully vaccinated: 68.4% (13,893 fully vaccinated)
— 9.3% higher vaccination rate than Texas
– Cumulative deaths per 100k: 463 (94 total deaths)
— 52.8% more deaths per 100k residents than Texas
– Cumulative cases per 100k: 31,065 (6,308 total cases)
— 20.3% more cases per 100k residents than Texas
Larry D. Moore // Wikimedia Commons
#17. Williamson County
– Population that is fully vaccinated: 68.5% (404,460 fully vaccinated)
— 9.4% higher vaccination rate than Texas
– Cumulative deaths per 100k: 159 (937 total deaths)
— 47.5% less deaths per 100k residents than Texas
– Cumulative cases per 100k: 25,926 (153,109 total cases)
— 0.4% more cases per 100k residents than Texas
John Stanton // Wikimedia Commons
#16. Val Verde County
– Population that is fully vaccinated: 68.6% (33,625 fully vaccinated)
— 9.6% higher vaccination rate than Texas
– Cumulative deaths per 100k: 620 (304 total deaths)
— 104.6% more deaths per 100k residents than Texas
– Cumulative cases per 100k: 31,119 (15,256 total cases)
— 20.5% more cases per 100k residents than Texas
天王星 // Wikimedia Commons
#15. Travis County
– Population that is fully vaccinated: 69.5% (885,792 fully vaccinated)
— 11.0% higher vaccination rate than Texas
– Cumulative deaths per 100k: 138 (1,760 total deaths)
— 54.5% less deaths per 100k residents than Texas
– Cumulative cases per 100k: 20,524 (261,466 total cases)
— 20.5% less cases per 100k residents than Texas
Billy Hathorn // Wikimedia Commons
#14. Dimmit County
– Population that is fully vaccinated: 69.7% (7,059 fully vaccinated)
— 11.3% higher vaccination rate than Texas
– Cumulative deaths per 100k: 504 (51 total deaths)
— 66.3% more deaths per 100k residents than Texas
– Cumulative cases per 100k: 59,305 (6,004 total cases)
— 129.7% more cases per 100k residents than Texas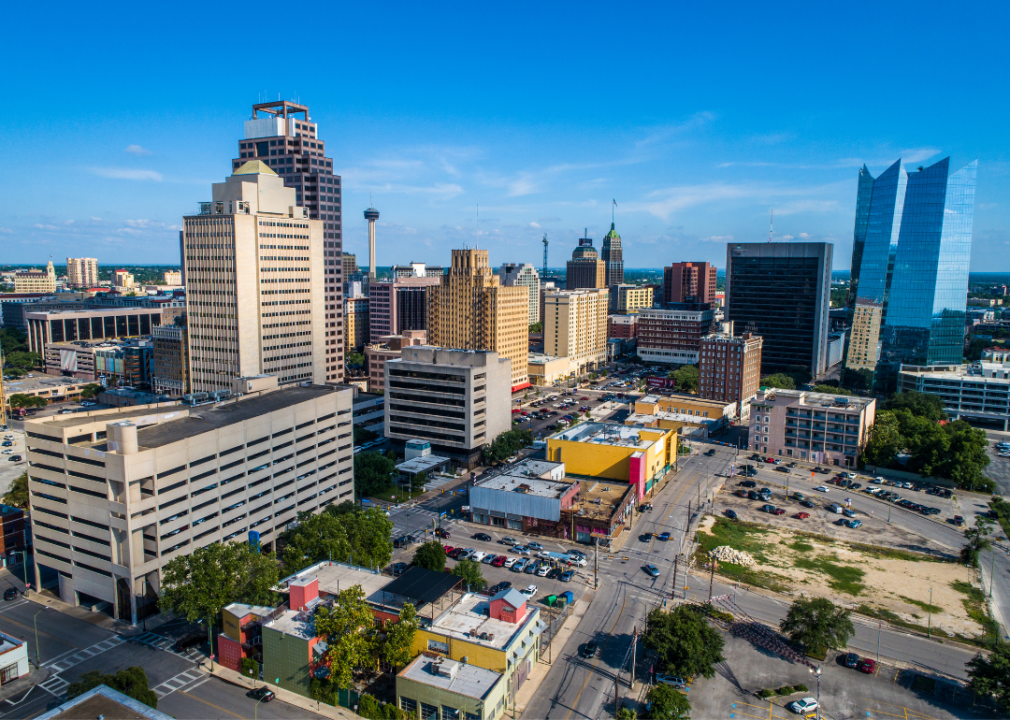
Canva
#13. Bexar County
– Population that is fully vaccinated: 70.3% (1,408,211 fully vaccinated)
— 12.3% higher vaccination rate than Texas
– Cumulative deaths per 100k: 311 (6,234 total deaths)
— 2.6% more deaths per 100k residents than Texas
– Cumulative cases per 100k: 31,234 (625,795 total cases)
— 21.0% more cases per 100k residents than Texas
Larry D. Moore // Wikimedia Commons
#12. Fort Bend County
– Population that is fully vaccinated: 71.8% (582,925 fully vaccinated)
— 14.7% higher vaccination rate than Texas
– Cumulative deaths per 100k: 150 (1,214 total deaths)
— 50.5% less deaths per 100k residents than Texas
– Cumulative cases per 100k: 27,226 (220,993 total cases)
— 5.5% more cases per 100k residents than Texas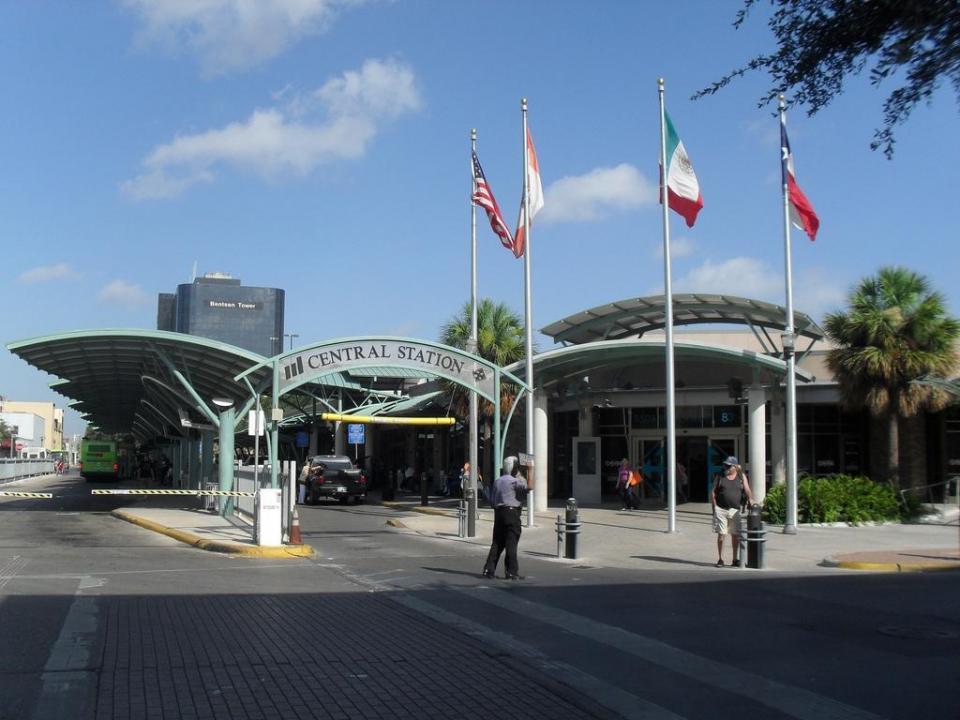
Distrito Medico Monterrey // Flickr
#11. Hidalgo County
– Population that is fully vaccinated: 76.4% (663,548 fully vaccinated)
— 22.0% higher vaccination rate than Texas
– Cumulative deaths per 100k: 454 (3,942 total deaths)
— 49.8% more deaths per 100k residents than Texas
– Cumulative cases per 100k: 26,880 (233,506 total cases)
— 4.1% more cases per 100k residents than Texas
Canva
#10. Cameron County
– Population that is fully vaccinated: 78.8% (333,252 fully vaccinated)
— 25.9% higher vaccination rate than Texas
– Cumulative deaths per 100k: 486 (2,057 total deaths)
— 60.4% more deaths per 100k residents than Texas
– Cumulative cases per 100k: 28,118 (118,985 total cases)
— 8.9% more cases per 100k residents than Texas
Talshiarr // Wikimedia Commons
#9. Reeves County
– Population that is fully vaccinated: 79.6% (12,719 fully vaccinated)
— 27.2% higher vaccination rate than Texas
– Cumulative deaths per 100k: 463 (74 total deaths)
— 52.8% more deaths per 100k residents than Texas
– Cumulative cases per 100k: 31,191 (4,983 total cases)
— 20.8% more cases per 100k residents than Texas
BenjaminMonroy // Wikimedia Commons
#8. El Paso County
– Population that is fully vaccinated: 82.3% (690,697 fully vaccinated)
— 31.5% higher vaccination rate than Texas
– Cumulative deaths per 100k: 449 (3,771 total deaths)
— 48.2% more deaths per 100k residents than Texas
– Cumulative cases per 100k: 27,388 (229,851 total cases)
— 6.1% more cases per 100k residents than Texas
Aualliso // Wikimedia Commons
#7. Edwards County
– Population that is fully vaccinated: 85.2% (1,646 fully vaccinated)
— 36.1% higher vaccination rate than Texas
– Cumulative deaths per 100k: 569 (11 total deaths)
— 87.8% more deaths per 100k residents than Texas
– Cumulative cases per 100k: 26,553 (513 total cases)
— 2.8% more cases per 100k residents than Texas
Canva
#6. Brooks County
– Population that is fully vaccinated: 91.7% (6,504 fully vaccinated)
— 46.5% higher vaccination rate than Texas
– Cumulative deaths per 100k: 733 (52 total deaths)
— 141.9% more deaths per 100k residents than Texas
– Cumulative cases per 100k: 25,532 (1,811 total cases)
— 1.1% less cases per 100k residents than Texas
Talshiarr // Wikimedia Commons
#5. Presidio County
– Population that is fully vaccinated: 93.8% (6,289 fully vaccinated)
— 49.8% higher vaccination rate than Texas
– Cumulative deaths per 100k: 582 (39 total deaths)
— 92.1% more deaths per 100k residents than Texas
– Cumulative cases per 100k: 15,886 (1,065 total cases)
— 38.5% less cases per 100k residents than Texas
Aualliso // Wikimedia Commons
#4. Irion County
– Population that is fully vaccinated: 95.0% (2,144 fully vaccinated)
— 51.8% higher vaccination rate than Texas
– Cumulative deaths per 100k: 195 (3 total deaths)
— 35.6% less deaths per 100k residents than Texas
– Cumulative cases per 100k: 33,984 (522 total cases)
— 31.6% more cases per 100k residents than Texas
JERRYE & ROY KLOTZ M.D. // Wikimedia Commons
#3. Maverick County
– Population that is fully vaccinated: 95.0% (57,848 fully vaccinated)
— 51.8% higher vaccination rate than Texas
– Cumulative deaths per 100k: 802 (471 total deaths)
— 164.7% more deaths per 100k residents than Texas
– Cumulative cases per 100k: 38,446 (22,576 total cases)
— 48.9% more cases per 100k residents than Texas
Carol M. Highsmith // Wikimedia Commons
#2. Starr County
– Population that is fully vaccinated: 95.0% (65,443 fully vaccinated)
— 51.8% higher vaccination rate than Texas
– Cumulative deaths per 100k: 566 (366 total deaths)
— 86.8% more deaths per 100k residents than Texas
– Cumulative cases per 100k: 33,720 (21,794 total cases)
— 30.6% more cases per 100k residents than Texas
Billy Hathorn // Wikimedia Commons
#1. Webb County
– Population that is fully vaccinated: 95.0% (293,886 fully vaccinated)
— 51.8% higher vaccination rate than Texas
– Cumulative deaths per 100k: 378 (1,045 total deaths)
— 24.8% more deaths per 100k residents than Texas
– Cumulative cases per 100k: 37,022 (102,423 total cases)
— 43.4% more cases per 100k residents than Texas


