
STACKER – The COVID-19 pandemic, rising inflation and a higher cost of living in major cities have combined with opportunities for remote work over the past two years. This combination has fueled a major migration across the country. In the first year of the pandemic, migration out of densely populated, expensive cities like New York and San Francisco was especially notable. Many moved to Sunbelt cities where the weather is warmer and the cost of living significantly lower.
But not everyone who moved in recent years went very far. Analysis of movement out of crowded cities shows that many of those leaving city centers moved into nearby suburbs in the same state, rather than making cross-country moves.
Other trends suggest that many people are sticking close to home, remaining in or moving back to the state, or even the town they were born in. Even before the pandemic, the number of younger adults living with their parents was on the rise, mostly due to financial difficulties. This economic hardship was made worse by the pandemic and resulted in many moving back in with their parents. By the end of 2020, more than half of Americans under the age of 29 were living at home, exceeding the share of young adults living with their parents during the Great Depression.
Apart from the pandemic, many people choose not to leave the state they were raised in, for reasons ranging from wanting to be close to family to not having the resources to leave, to sticking with a lower cost of living.
In order to determine where people stay put, Stacker compiled a list of counties with the most born-and-bred residents in North Carolina using data from the U.S. Census Bureau. Counties are ranked by the highest percentage of residents that were born in the state according to 2020 5-year estimates.

Nolichuckyjake // Shutterstock
#50. Catawba County
– Population: 158,507
– Born in North Carolina: 104,128 (65.7% of population)
– Born in a different state: 42,389 (26.7% of population)
— Midwest (5.2%), Northeast (6.5%), South (11.8%), West (3.2%)
– Born in another country: 10,460 (6.60% of population)
— Africa (0.09%) , Asia (1.74%), Europe (0.70%), Latin America (3.97%), North America (0.08%), Oceania (0.02%)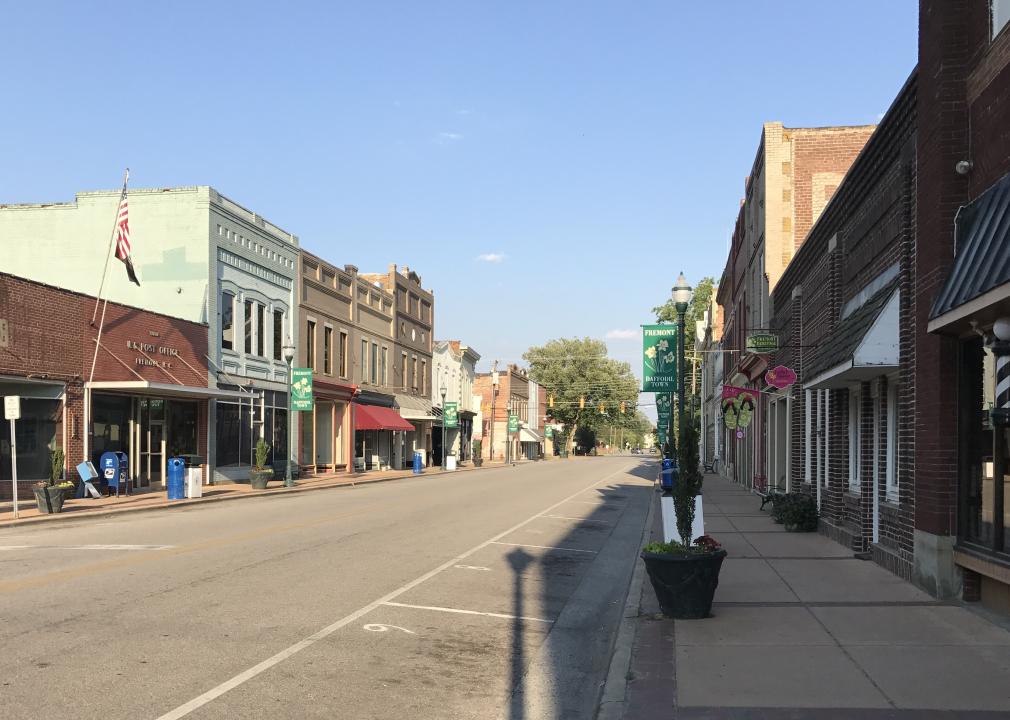
Indy beetle // Wikimedia Commons
#49. Wayne County
– Population: 123,785
– Born in North Carolina: 83,307 (67.3% of population)
– Born in a different state: 29,496 (23.8% of population)
— Midwest (3.4%), Northeast (6.4%), South (11.6%), West (2.4%)
– Born in another country: 8,673 (7.01% of population)
— Africa (0.09%) , Asia (1.21%), Europe (0.57%), Latin America (5.10%), North America (0.03%), Oceania (0.00%)
Doug Kerr from Albany, NY, United States // Wikimedia Commons
#48. Warren County
– Population: 19,746
– Born in North Carolina: 13,379 (67.8% of population)
– Born in a different state: 5,835 (29.6% of population)
— Midwest (3.1%), Northeast (9.4%), South (15.8%), West (1.3%)
– Born in another country: 482 (2.44% of population)
— Africa (0.00%) , Asia (0.29%), Europe (0.13%), Latin America (1.88%), North America (0.14%), Oceania (0.00%)
Upstateherd // Wikimedia Commons
#47. Gaston County
– Population: 222,119
– Born in North Carolina: 151,341 (68.1% of population)
– Born in a different state: 57,491 (25.9% of population)
— Midwest (4.2%), Northeast (6.6%), South (13.2%), West (1.8%)
– Born in another country: 11,762 (5.30% of population)
— Africa (0.17%) , Asia (1.13%), Europe (0.48%), Latin America (3.34%), North America (0.14%), Oceania (0.04%)
Canva
#46. Avery County
– Population: 17,510
– Born in North Carolina: 11,932 (68.1% of population)
– Born in a different state: 4,955 (28.3% of population)
— Midwest (4.3%), Northeast (5.7%), South (15.5%), West (2.8%)
– Born in another country: 538 (3.07% of population)
— Africa (0.11%) , Asia (0.20%), Europe (0.64%), Latin America (1.73%), North America (0.30%), Oceania (0.09%)
You may also like: Counties with the highest COVID-19 vaccination rate in North Carolina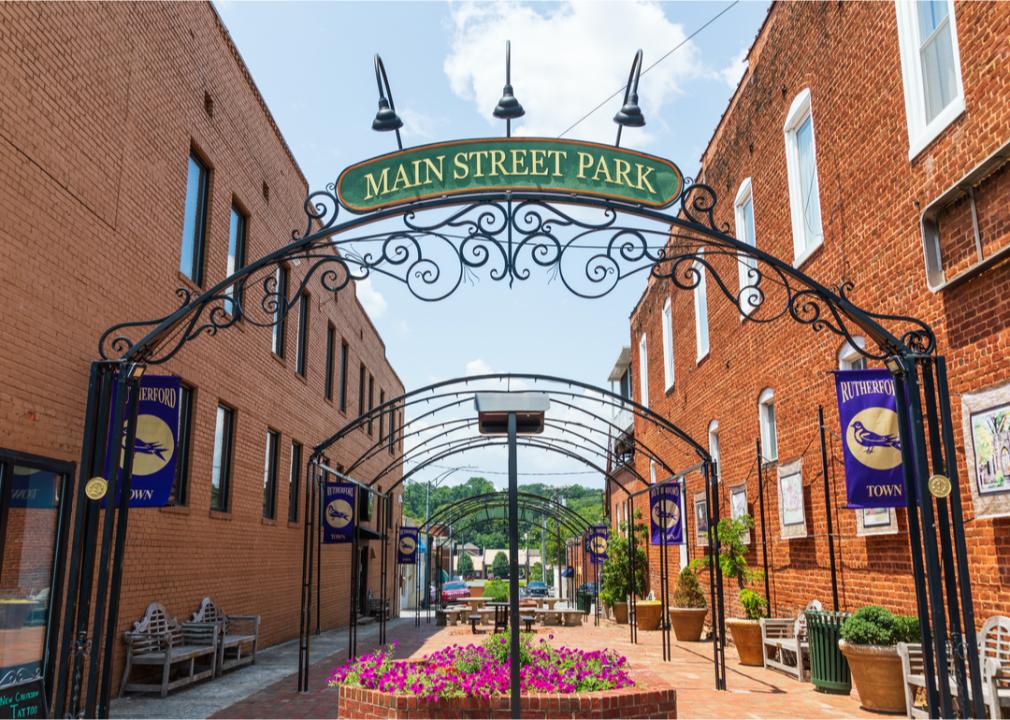
Nolichuckyjake // Shutterstock
#45. Rutherford County
– Population: 66,741
– Born in North Carolina: 45,520 (68.2% of population)
– Born in a different state: 18,922 (28.4% of population)
— Midwest (4.8%), Northeast (5.9%), South (15.7%), West (2.0%)
– Born in another country: 1,927 (2.89% of population)
— Africa (0.17%) , Asia (0.41%), Europe (0.37%), Latin America (1.78%), North America (0.16%), Oceania (0.00%)
Gary Rolband // Shutterstock
#44. Ashe County
– Population: 27,009
– Born in North Carolina: 18,488 (68.5% of population)
– Born in a different state: 7,516 (27.8% of population)
— Midwest (4.8%), Northeast (6.9%), South (14.7%), West (1.4%)
– Born in another country: 896 (3.32% of population)
— Africa (0.00%) , Asia (0.56%), Europe (0.40%), Latin America (2.29%), North America (0.07%), Oceania (0.00%)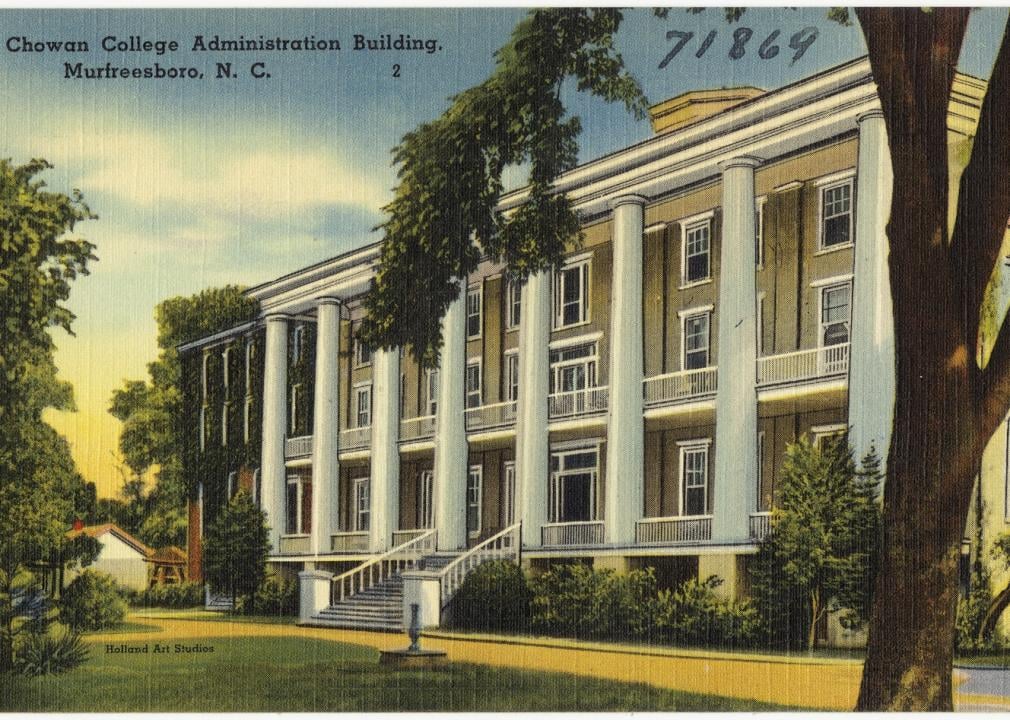
Boston Public Library // Wikimedia Commons
#43. Hertford County
– Population: 23,752
– Born in North Carolina: 16,282 (68.6% of population)
– Born in a different state: 6,459 (27.2% of population)
— Midwest (1.4%), Northeast (5.2%), South (19.6%), West (1.1%)
– Born in another country: 905 (3.81% of population)
— Africa (0.03%) , Asia (1.09%), Europe (0.34%), Latin America (2.32%), North America (0.01%), Oceania (0.03%)
AlexiusHoratius // Wikimedia Commons
#42. Rowan County
– Population: 140,978
– Born in North Carolina: 97,237 (69.0% of population)
– Born in a different state: 36,155 (25.6% of population)
— Midwest (4.2%), Northeast (7.9%), South (11.3%), West (2.2%)
– Born in another country: 6,533 (4.63% of population)
— Africa (0.13%) , Asia (0.59%), Europe (0.24%), Latin America (3.53%), North America (0.12%), Oceania (0.02%)
Brian Stansberry // Wikimedia Commons
#41. Swain County
– Population: 14,241
– Born in North Carolina: 9,825 (69.0% of population)
– Born in a different state: 3,992 (28.0% of population)
— Midwest (7.0%), Northeast (5.2%), South (14.0%), West (1.8%)
– Born in another country: 410 (2.88% of population)
— Africa (0.00%) , Asia (0.42%), Europe (0.37%), Latin America (2.05%), North America (0.04%), Oceania (0.00%)
You may also like: Best community colleges in North Carolina
Nikola Spasic Photography // Shutterstock
#40. Pitt County
– Population: 179,961
– Born in North Carolina: 124,940 (69.4% of population)
– Born in a different state: 44,516 (24.7% of population)
— Midwest (4.3%), Northeast (7.8%), South (10.3%), West (2.4%)
– Born in another country: 8,592 (4.77% of population)
— Africa (0.13%) , Asia (1.39%), Europe (0.43%), Latin America (2.66%), North America (0.16%), Oceania (0.01%)
G Keith Hall // Wikimedia Commons
#39. Surry County
– Population: 71,904
– Born in North Carolina: 49,927 (69.4% of population)
– Born in a different state: 16,959 (23.6% of population)
— Midwest (3.2%), Northeast (5.2%), South (13.3%), West (1.8%)
– Born in another country: 4,236 (5.89% of population)
— Africa (0.01%) , Asia (0.81%), Europe (0.24%), Latin America (4.51%), North America (0.30%), Oceania (0.02%)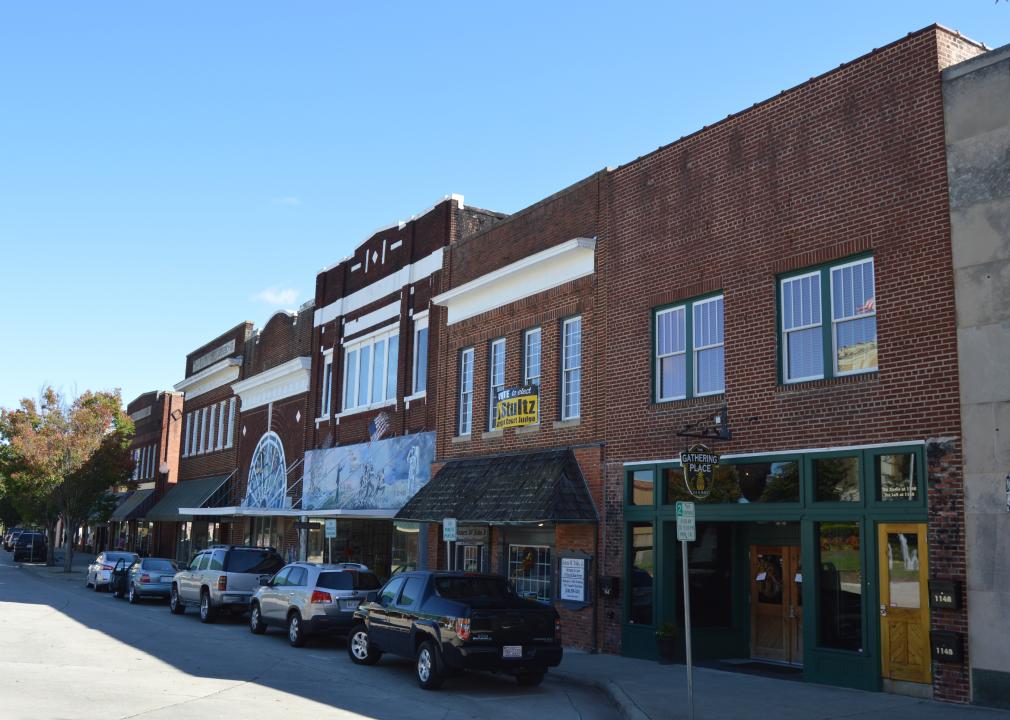
Nyttend // Wikimedia Commons
#38. Person County
– Population: 39,561
– Born in North Carolina: 28,064 (70.9% of population)
– Born in a different state: 10,023 (25.3% of population)
— Midwest (2.8%), Northeast (6.1%), South (13.9%), West (2.6%)
– Born in another country: 1,250 (3.16% of population)
— Africa (0.34%) , Asia (0.22%), Europe (0.54%), Latin America (1.95%), North America (0.00%), Oceania (0.11%)
Donald Lee Pardue // Wikimedia Commons
#37. Randolph County
– Population: 143,460
– Born in North Carolina: 102,193 (71.2% of population)
– Born in a different state: 31,935 (22.3% of population)
— Midwest (4.1%), Northeast (5.9%), South (10.2%), West (2.1%)
– Born in another country: 8,349 (5.82% of population)
— Africa (0.04%) , Asia (0.64%), Europe (0.29%), Latin America (4.84%), North America (0.01%), Oceania (0.00%)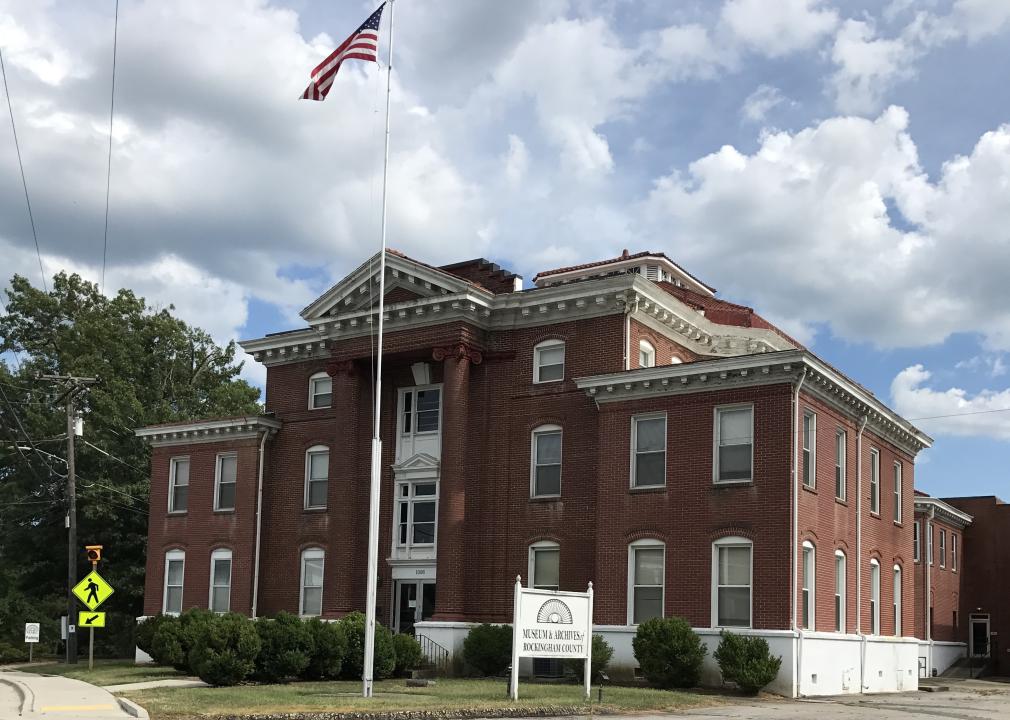
Indy beetle // Wikimedia Commons
#36. Rockingham County
– Population: 91,051
– Born in North Carolina: 65,035 (71.4% of population)
– Born in a different state: 22,154 (24.3% of population)
— Midwest (2.8%), Northeast (5.4%), South (15.0%), West (1.3%)
– Born in another country: 3,338 (3.67% of population)
— Africa (0.03%) , Asia (0.59%), Europe (0.26%), Latin America (2.79%), North America (0.00%), Oceania (0.00%)
You may also like: Best places to retire in North Carolina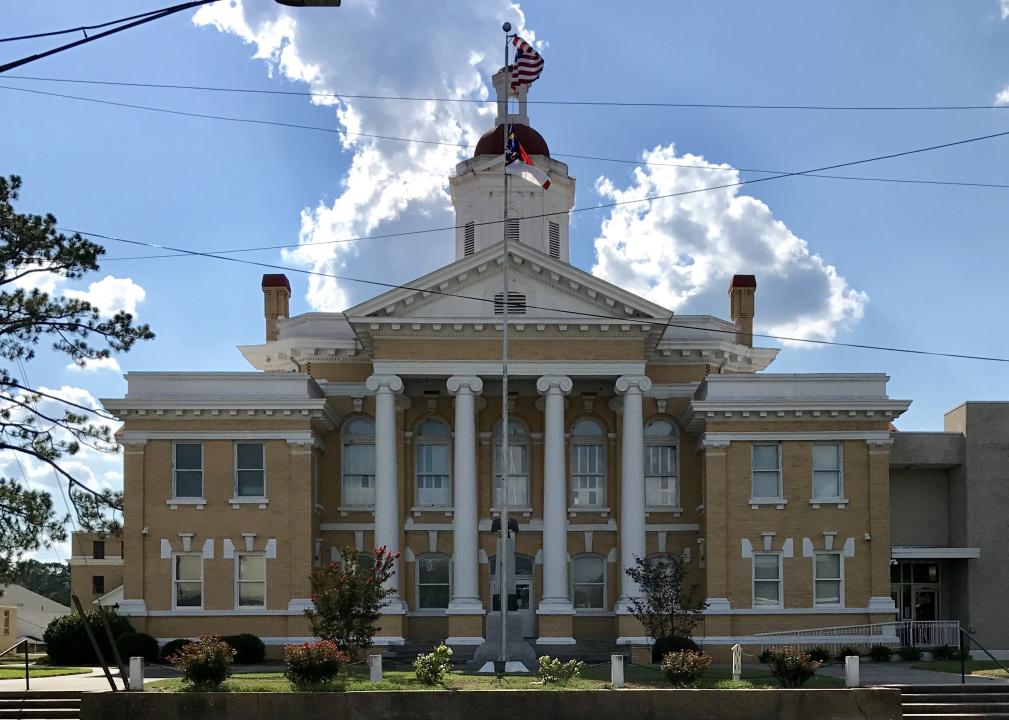
Indy beetle // Wikimedia Commons
#35. Duplin County
– Population: 58,965
– Born in North Carolina: 42,182 (71.5% of population)
– Born in a different state: 9,255 (15.7% of population)
— Midwest (2.3%), Northeast (4.9%), South (6.5%), West (2.0%)
– Born in another country: 7,267 (12.32% of population)
— Africa (0.01%) , Asia (0.36%), Europe (0.21%), Latin America (11.70%), North America (0.04%), Oceania (0.00%)
Dennis Brown // Wikimedia Commons
#34. Davidson County
– Population: 166,837
– Born in North Carolina: 120,067 (72.0% of population)
– Born in a different state: 37,308 (22.4% of population)
— Midwest (3.3%), Northeast (5.8%), South (11.3%), West (1.9%)
– Born in another country: 8,449 (5.06% of population)
— Africa (0.06%) , Asia (0.98%), Europe (0.40%), Latin America (3.50%), North America (0.13%), Oceania (0.00%)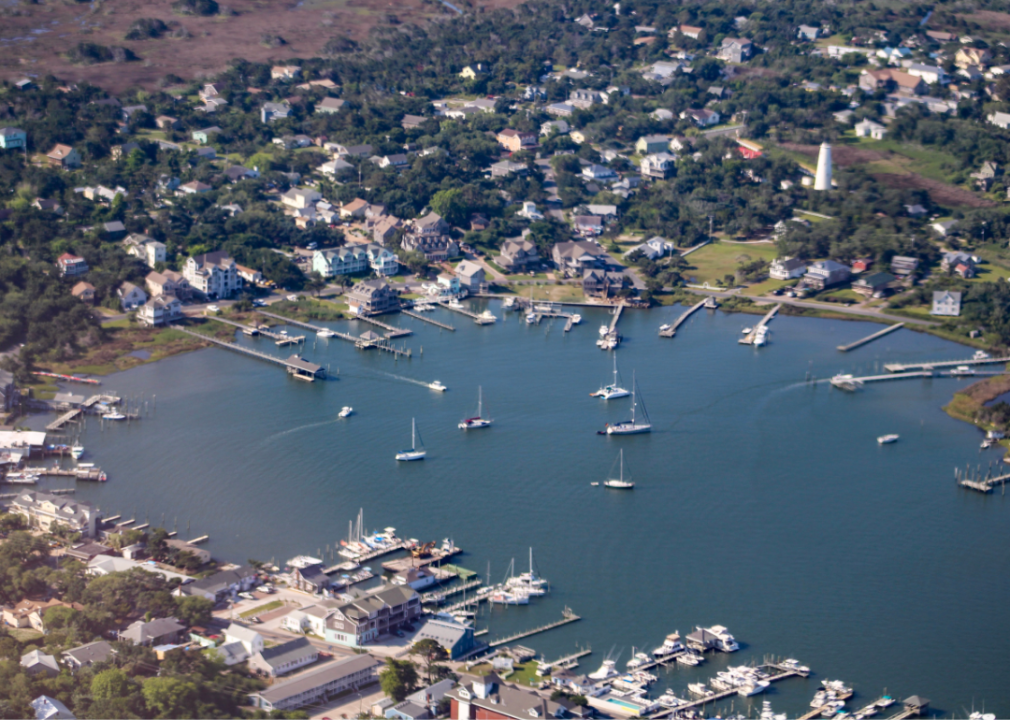
Canva
#33. Hyde County
– Population: 5,089
– Born in North Carolina: 3,668 (72.1% of population)
– Born in a different state: 1,115 (21.9% of population)
— Midwest (3.5%), Northeast (9.0%), South (8.4%), West (1.0%)
– Born in another country: 287 (5.64% of population)
— Africa (0.00%) , Asia (0.00%), Europe (0.00%), Latin America (5.64%), North America (0.00%), Oceania (0.00%)
David Byron Keener // Shutterstock
#32. Beaufort County
– Population: 47,160
– Born in North Carolina: 34,240 (72.6% of population)
– Born in a different state: 11,173 (23.7% of population)
— Midwest (3.8%), Northeast (8.5%), South (10.1%), West (1.3%)
– Born in another country: 1,573 (3.34% of population)
— Africa (0.07%) , Asia (0.12%), Europe (0.38%), Latin America (2.77%), North America (0.00%), Oceania (0.00%)
Ron Reiring // Wikimedia Commons
#31. Burke County
– Population: 90,148
– Born in North Carolina: 65,690 (72.9% of population)
– Born in a different state: 19,243 (21.3% of population)
— Midwest (4.7%), Northeast (4.4%), South (9.4%), West (2.8%)
– Born in another country: 4,573 (5.07% of population)
— Africa (0.19%) , Asia (1.78%), Europe (0.38%), Latin America (2.62%), North America (0.09%), Oceania (0.00%)
You may also like: Best counties to retire to in North Carolina
RnR // Wikimedia Commons
#30. McDowell County
– Population: 45,402
– Born in North Carolina: 33,344 (73.4% of population)
– Born in a different state: 9,604 (21.2% of population)
— Midwest (3.5%), Northeast (4.7%), South (11.3%), West (1.7%)
– Born in another country: 1,927 (4.24% of population)
— Africa (0.01%) , Asia (0.73%), Europe (0.29%), Latin America (2.96%), North America (0.26%), Oceania (0.00%)
Tradewinds // Wikimedia Commons
#29. Jones County
– Population: 9,453
– Born in North Carolina: 6,957 (73.6% of population)
– Born in a different state: 2,193 (23.2% of population)
— Midwest (3.3%), Northeast (7.2%), South (9.5%), West (3.3%)
– Born in another country: 224 (2.37% of population)
— Africa (0.00%) , Asia (0.14%), Europe (0.43%), Latin America (1.80%), North America (0.00%), Oceania (0.00%)
Nyttend // Wikimedia Commons
#28. Scotland County
– Population: 34,921
– Born in North Carolina: 25,711 (73.6% of population)
– Born in a different state: 8,171 (23.4% of population)
— Midwest (3.0%), Northeast (6.0%), South (13.5%), West (0.9%)
– Born in another country: 822 (2.35% of population)
— Africa (0.20%) , Asia (0.67%), Europe (0.30%), Latin America (1.05%), North America (0.10%), Oceania (0.04%)
BrendaByrneGreene // Wikimedia Commons
#27. Nash County
– Population: 94,287
– Born in North Carolina: 69,842 (74.1% of population)
– Born in a different state: 19,481 (20.7% of population)
— Midwest (2.0%), Northeast (6.4%), South (11.1%), West (1.2%)
– Born in another country: 4,325 (4.59% of population)
— Africa (0.18%) , Asia (1.21%), Europe (0.27%), Latin America (2.79%), North America (0.09%), Oceania (0.04%)
Ken Thomas // Wikimedia Commons
#26. Alexander County
– Population: 37,271
– Born in North Carolina: 27,614 (74.1% of population)
– Born in a different state: 8,233 (22.1% of population)
— Midwest (5.9%), Northeast (4.7%), South (10.4%), West (1.0%)
– Born in another country: 1,251 (3.36% of population)
— Africa (0.00%) , Asia (0.55%), Europe (0.31%), Latin America (2.40%), North America (0.10%), Oceania (0.00%)
You may also like: What North Carolina’s immigrant population looked like in 1900
HarmonyReignPope // Wikimedia Commons
#25. Tyrrell County
– Population: 3,978
– Born in North Carolina: 2,954 (74.3% of population)
– Born in a different state: 890 (22.4% of population)
— Midwest (2.1%), Northeast (6.4%), South (11.6%), West (2.2%)
– Born in another country: 134 (3.37% of population)
— Africa (0.00%) , Asia (0.48%), Europe (0.00%), Latin America (2.89%), North America (0.00%), Oceania (0.00%)
Indy beetle // Wikimedia Commons
#24. Northampton County
– Population: 19,672
– Born in North Carolina: 14,615 (74.3% of population)
– Born in a different state: 4,623 (23.5% of population)
— Midwest (1.5%), Northeast (5.9%), South (14.0%), West (2.1%)
– Born in another country: 300 (1.53% of population)
— Africa (0.01%) , Asia (0.22%), Europe (0.24%), Latin America (1.04%), North America (0.01%), Oceania (0.00%)
Jacalyn Engler // Wikimedia Commons
#23. Stokes County
– Population: 45,688
– Born in North Carolina: 33,960 (74.3% of population)
– Born in a different state: 10,427 (22.8% of population)
— Midwest (3.2%), Northeast (4.6%), South (13.0%), West (2.1%)
– Born in another country: 1,107 (2.42% of population)
— Africa (0.00%) , Asia (0.21%), Europe (0.29%), Latin America (1.77%), North America (0.13%), Oceania (0.03%)
OptimumPx // Wikimedia Commons
#22. Cleveland County
– Population: 97,765
– Born in North Carolina: 72,959 (74.6% of population)
– Born in a different state: 21,790 (22.3% of population)
— Midwest (3.8%), Northeast (5.1%), South (11.5%), West (1.9%)
– Born in another country: 2,343 (2.40% of population)
— Africa (0.01%) , Asia (0.82%), Europe (0.18%), Latin America (1.30%), North America (0.08%), Oceania (0.00%)
Jerrye & Roy Klotz, MD // Wikimedia Commons
#21. Richmond County
– Population: 44,759
– Born in North Carolina: 33,522 (74.9% of population)
– Born in a different state: 9,406 (21.0% of population)
— Midwest (2.5%), Northeast (5.7%), South (11.5%), West (1.3%)
– Born in another country: 1,540 (3.44% of population)
— Africa (0.00%) , Asia (0.76%), Europe (0.16%), Latin America (2.51%), North America (0.00%), Oceania (0.02%)
You may also like: Highest-rated specialty museums in North Carolina, according to Tripadvisor
Indy beetle // Wikimedia Commons
#20. Greene County
– Population: 20,987
– Born in North Carolina: 15,774 (75.2% of population)
– Born in a different state: 3,427 (16.3% of population)
— Midwest (2.1%), Northeast (4.8%), South (9.0%), West (0.5%)
– Born in another country: 1,603 (7.64% of population)
— Africa (0.09%) , Asia (0.12%), Europe (0.02%), Latin America (7.41%), North America (0.00%), Oceania (0.00%)
digidreamgrafix // Shutterstock
#19. Graham County
– Population: 8,501
– Born in North Carolina: 6,441 (75.8% of population)
– Born in a different state: 1,807 (21.3% of population)
— Midwest (5.3%), Northeast (3.0%), South (10.6%), West (2.4%)
– Born in another country: 192 (2.26% of population)
— Africa (0.00%) , Asia (0.00%), Europe (0.22%), Latin America (2.02%), North America (0.00%), Oceania (0.01%)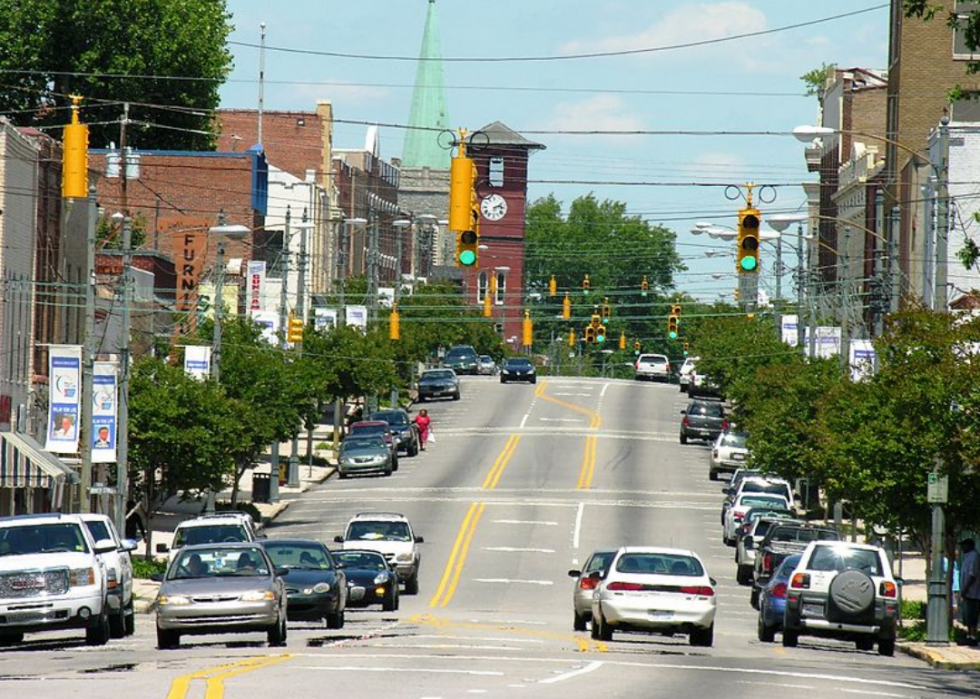
KimWrenn // Wikimedia Commons
#18. Vance County
– Population: 44,614
– Born in North Carolina: 33,815 (75.8% of population)
– Born in a different state: 8,387 (18.8% of population)
— Midwest (2.1%), Northeast (6.3%), South (8.7%), West (1.7%)
– Born in another country: 2,257 (5.06% of population)
— Africa (0.14%) , Asia (0.80%), Europe (0.30%), Latin America (3.81%), North America (0.00%), Oceania (0.00%)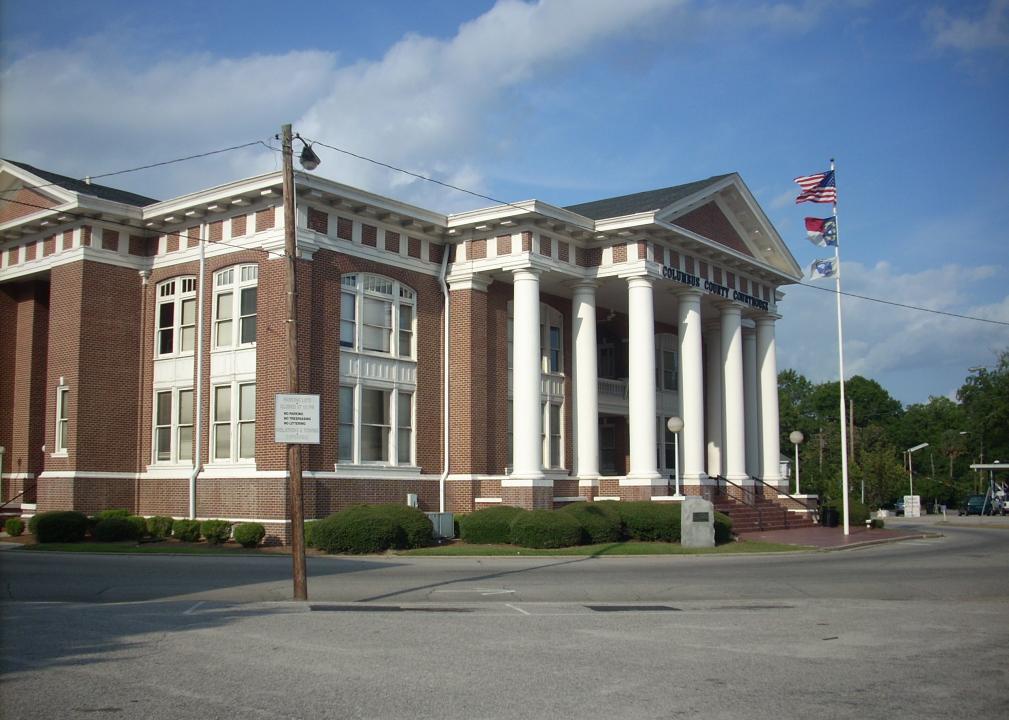
gerrydincher // Wikimedia Commons
#17. Columbus County
– Population: 55,659
– Born in North Carolina: 42,230 (75.9% of population)
– Born in a different state: 11,770 (21.1% of population)
— Midwest (1.7%), Northeast (4.1%), South (14.3%), West (1.0%)
– Born in another country: 1,500 (2.69% of population)
— Africa (0.05%) , Asia (0.27%), Europe (0.24%), Latin America (2.09%), North America (0.04%), Oceania (0.01%)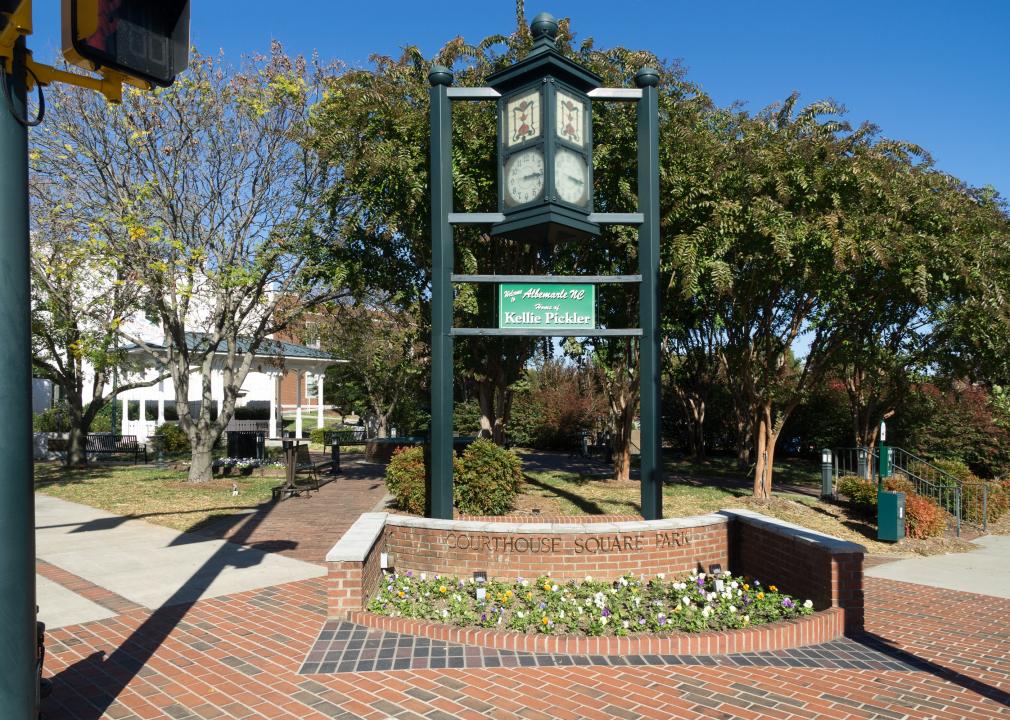
Kenneth C. Zirkel // Wikimedia Commons
#16. Stanly County
– Population: 62,050
– Born in North Carolina: 47,204 (76.1% of population)
– Born in a different state: 12,399 (20.0% of population)
— Midwest (3.8%), Northeast (5.8%), South (8.3%), West (2.1%)
– Born in another country: 2,159 (3.48% of population)
— Africa (0.20%) , Asia (0.92%), Europe (0.16%), Latin America (2.18%), North America (0.02%), Oceania (0.00%)
You may also like: 17% of people live near toxic release facilities—here’s how it breaks down in North Carolina
Nolichuckyjake // Shutterstock
#15. Caldwell County
– Population: 82,056
– Born in North Carolina: 62,432 (76.1% of population)
– Born in a different state: 16,857 (20.5% of population)
— Midwest (3.3%), Northeast (4.0%), South (10.9%), West (2.4%)
– Born in another country: 2,338 (2.85% of population)
— Africa (0.00%) , Asia (0.51%), Europe (0.44%), Latin America (1.88%), North America (0.02%), Oceania (0.00%)
Ammodramus // Wikimedia Commons
#14. Wilson County
– Population: 81,579
– Born in North Carolina: 62,210 (76.3% of population)
– Born in a different state: 14,193 (17.4% of population)
— Midwest (2.4%), Northeast (5.2%), South (8.6%), West (1.2%)
– Born in another country: 4,786 (5.87% of population)
— Africa (0.13%) , Asia (1.31%), Europe (0.17%), Latin America (4.14%), North America (0.11%), Oceania (0.01%)
Jerrye & Roy Klotz, MD // Wikimedia Commons
#13. Montgomery County
– Population: 27,223
– Born in North Carolina: 20,775 (76.3% of population)
– Born in a different state: 3,722 (13.7% of population)
— Midwest (2.4%), Northeast (4.1%), South (6.4%), West (0.7%)
– Born in another country: 2,483 (9.12% of population)
— Africa (0.15%) , Asia (0.93%), Europe (0.21%), Latin America (7.73%), North America (0.10%), Oceania (0.00%)
State Archives of North Carolina Raleigh, NC // Wikimedia Commons
#12. Sampson County
– Population: 63,284
– Born in North Carolina: 48,600 (76.8% of population)
– Born in a different state: 8,291 (13.1% of population)
— Midwest (1.5%), Northeast (4.2%), South (6.2%), West (1.2%)
– Born in another country: 6,083 (9.61% of population)
— Africa (0.14%) , Asia (0.37%), Europe (0.11%), Latin America (8.99%), North America (0.00%), Oceania (0.00%)
Indy beetle // Wikimedia Commons
#11. Lenoir County
– Population: 56,350
– Born in North Carolina: 43,413 (77.0% of population)
– Born in a different state: 10,500 (18.6% of population)
— Midwest (3.1%), Northeast (5.2%), South (9.3%), West (1.1%)
– Born in another country: 2,271 (4.03% of population)
— Africa (0.00%) , Asia (0.16%), Europe (0.55%), Latin America (3.25%), North America (0.07%), Oceania (0.00%)
You may also like: Best public high schools in North Carolina
ncwetlands.org// Wikimedia Commons
#10. Bladen County
– Population: 33,209
– Born in North Carolina: 25,861 (77.9% of population)
– Born in a different state: 5,924 (17.8% of population)
— Midwest (2.5%), Northeast (5.1%), South (7.9%), West (2.3%)
– Born in another country: 1,232 (3.71% of population)
— Africa (0.03%) , Asia (0.16%), Europe (0.00%), Latin America (3.53%), North America (0.00%), Oceania (0.00%)
Upstateherd // Wikimedia Commons
#9. Wilkes County
– Population: 68,341
– Born in North Carolina: 53,256 (77.9% of population)
– Born in a different state: 12,212 (17.9% of population)
— Midwest (2.8%), Northeast (3.5%), South (10.0%), West (1.5%)
– Born in another country: 2,543 (3.72% of population)
— Africa (0.05%) , Asia (0.48%), Europe (0.31%), Latin America (2.81%), North America (0.06%), Oceania (0.00%)
Wasrts // Wikimedia Commons
#8. Yadkin County
– Population: 37,589
– Born in North Carolina: 29,340 (78.1% of population)
– Born in a different state: 6,090 (16.2% of population)
— Midwest (2.6%), Northeast (3.4%), South (8.8%), West (1.4%)
– Born in another country: 1,943 (5.17% of population)
— Africa (0.13%) , Asia (0.03%), Europe (0.23%), Latin America (4.70%), North America (0.08%), Oceania (0.00%)
Cecouchman // Wikimedia Commons
#7. Halifax County
– Population: 50,678
– Born in North Carolina: 39,856 (78.6% of population)
– Born in a different state: 9,630 (19.0% of population)
— Midwest (1.6%), Northeast (4.8%), South (10.7%), West (2.0%)
– Born in another country: 972 (1.92% of population)
— Africa (0.00%) , Asia (0.62%), Europe (0.14%), Latin America (1.05%), North America (0.09%), Oceania (0.02%)
Alanteitleman // Wikimedia Commons
#6. Martin County
– Population: 22,644
– Born in North Carolina: 18,251 (80.6% of population)
– Born in a different state: 3,611 (15.9% of population)
— Midwest (1.5%), Northeast (4.6%), South (8.4%), West (1.5%)
– Born in another country: 623 (2.75% of population)
— Africa (0.00%) , Asia (1.33%), Europe (0.10%), Latin America (1.24%), North America (0.08%), Oceania (0.00%)
You may also like: Counties with the worst commutes in North Carolina
Katangais // Wikimedia Commons
#5. Robeson County
– Population: 131,656
– Born in North Carolina: 106,883 (81.2% of population)
– Born in a different state: 18,167 (13.8% of population)
— Midwest (1.5%), Northeast (3.3%), South (8.0%), West (1.0%)
– Born in another country: 5,542 (4.21% of population)
— Africa (0.10%) , Asia (0.46%), Europe (0.27%), Latin America (3.36%), North America (0.02%), Oceania (0.00%)
Theresaperry44 // Wikimedia Commons
#4. Bertie County
– Population: 19,081
– Born in North Carolina: 15,628 (81.9% of population)
– Born in a different state: 3,279 (17.2% of population)
— Midwest (1.0%), Northeast (6.5%), South (8.3%), West (1.4%)
– Born in another country: 152 (0.80% of population)
— Africa (0.05%) , Asia (0.48%), Europe (0.03%), Latin America (0.21%), North America (0.03%), Oceania (0.00%)
Upstateherd // Wikimedia Commons
#3. Anson County
– Population: 24,430
– Born in North Carolina: 20,201 (82.7% of population)
– Born in a different state: 3,487 (14.3% of population)
— Midwest (1.2%), Northeast (4.5%), South (7.8%), West (0.7%)
– Born in another country: 673 (2.75% of population)
— Africa (0.01%) , Asia (0.97%), Europe (0.18%), Latin America (1.59%), North America (0.00%), Oceania (0.00%)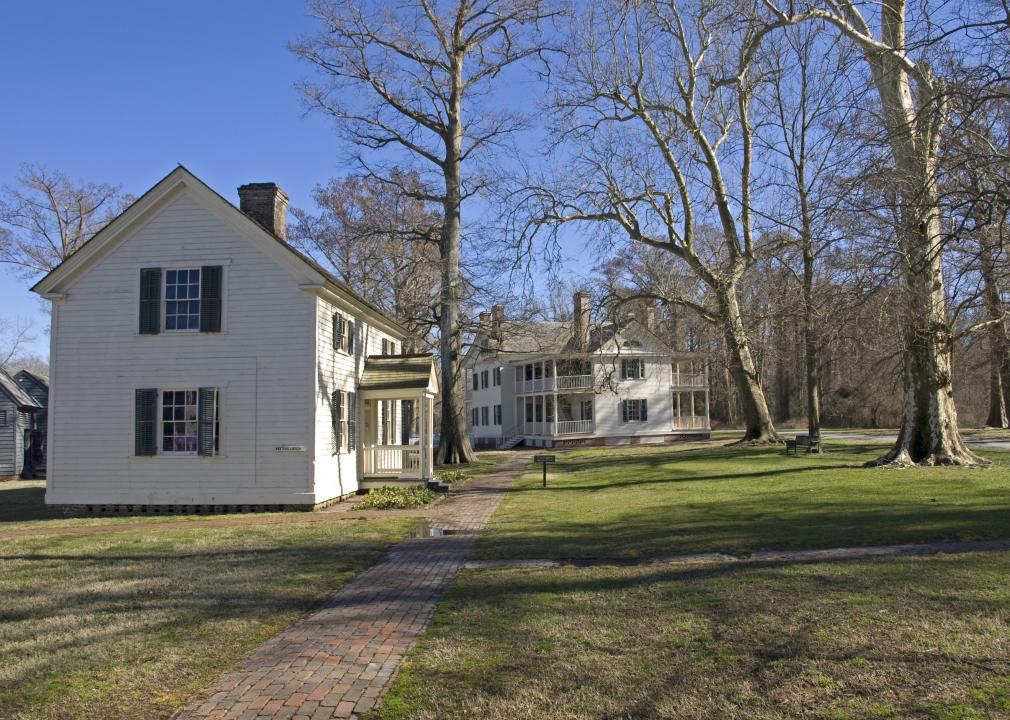
Ymblanter // Wikimedia Commons
#2. Washington County
– Population: 11,788
– Born in North Carolina: 9,830 (83.4% of population)
– Born in a different state: 1,728 (14.7% of population)
— Midwest (2.5%), Northeast (3.7%), South (7.4%), West (1.1%)
– Born in another country: 230 (1.95% of population)
— Africa (0.00%) , Asia (0.30%), Europe (0.03%), Latin America (1.63%), North America (0.00%), Oceania (0.00%)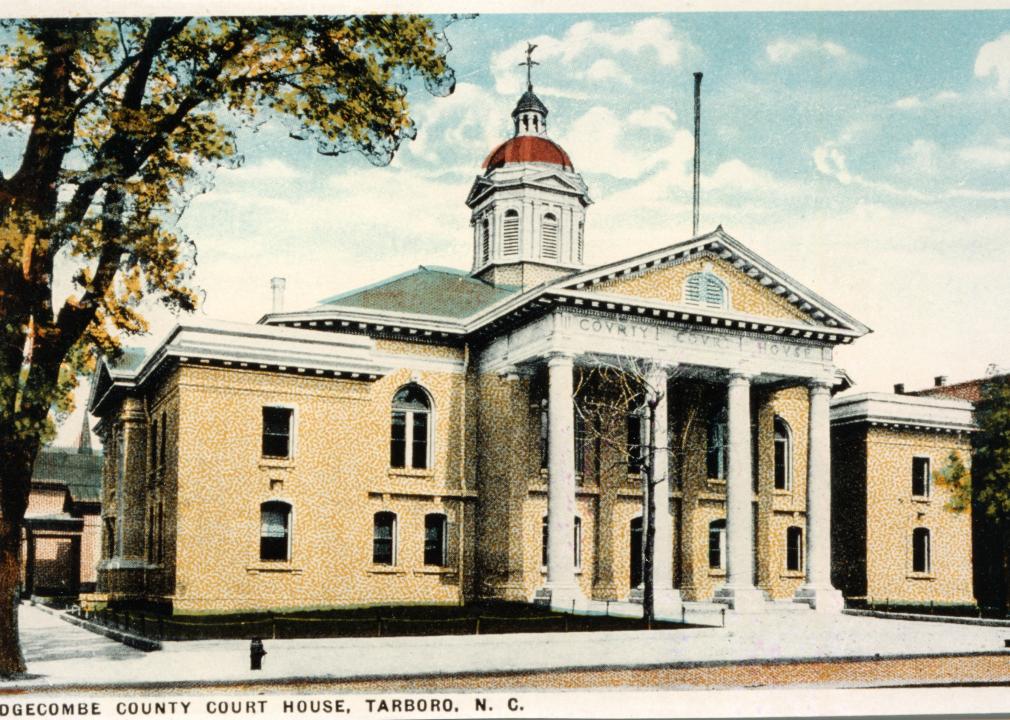
State Archives of North Carolina // Wikimedia Commons
#1. Edgecombe County
– Population: 52,069
– Born in North Carolina: 43,429 (83.4% of population)
– Born in a different state: 7,085 (13.6% of population)
— Midwest (1.5%), Northeast (5.2%), South (6.1%), West (0.8%)
– Born in another country: 1,368 (2.63% of population)
— Africa (0.09%) , Asia (0.29%), Europe (0.15%), Latin America (2.06%), North America (0.03%), Oceania (0.00%)
You may also like: Countries North Carolina exports the most goods to