 The worst inflation in 40 years has led to cascading effects, with consumer sentiment declining and gross domestic product decreasing in the first quarter of this year. While the Federal Reserve has been raising rates to tame inflation, this has resulted in higher mortgage rates. Combined, these factors appear to be cooling the U.S. housing market after white-hot demand in the past two years sent prices skyward.
So far, the number of foreclosure filings in the first six months of the year is still slightly lower than it was in the same period in 2020. But these filings are up 153% from the first half of last year, according to property data provider Attom Data Solutions.
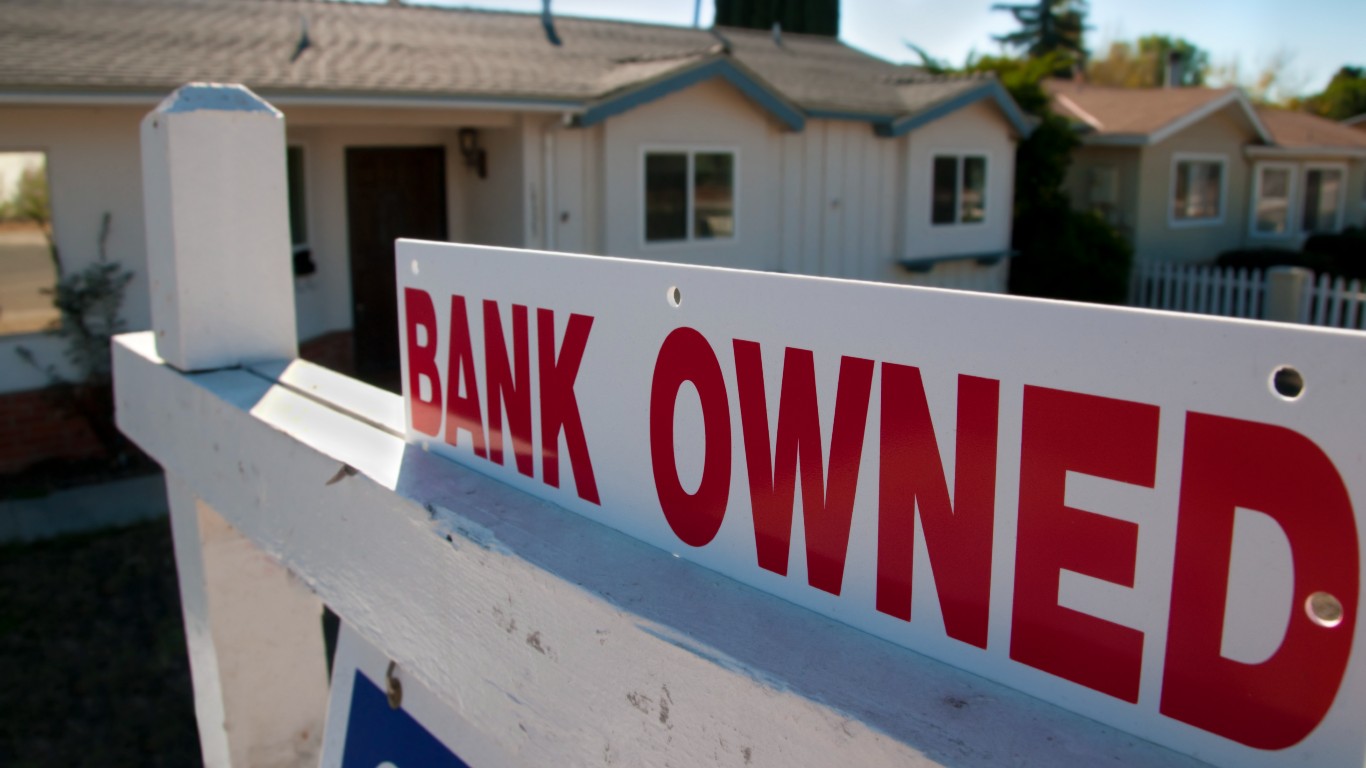
Home foreclosure filings include default notices, bank repossessions, and scheduled auctions and are used as a measure to gauge the health of housing markets at local, state, and national levels.
Gates County, North Carolina - located in the Virginia Beach-Norfolk-Newport News metropolitan area - has one of the highest foreclosure rates of any U.S. county. According to a recent report from Attom, a total of 15 housing units were in foreclosure in the first half of 2022, up 200.0% from the first half of last year.
The foreclosure rate in Gates County of one in every 318 homes ranks as the 23rd highest of the more than 1,700 counties and county equivalents reviewed.
According to five-year estimates from the U.S. Census Bureau's 2020 American Community Survey, the typical household in Gates County has an income of $45,871 a year and the typical home is worth $142,400. For context, the typical American household's annual income is $64,994, and the national median home value is $229,800.
| Rank | County | Homes in foreclosure, 1st half 2022 | Foreclosure rate (foreclosures per housing unit) | Median household income ($) | Median home value ($) |
|---|---|---|---|---|---|
| 30 | Winnebago County, Illinois | 381 | 1:328 | 55,310 | 121,400 |
| 29 | Osceola County, Florida | 478 | 1:324 | 55,538 | 221,600 |
| 28 | Mchenry County, Illinois | 369 | 1:324 | 90,014 | 234,000 |
| 27 | Lake County, California | 106 | 1:323 | 49,254 | 238,000 |
| 26 | Lake County, Indiana | 667 | 1:322 | 57,530 | 156,100 |
| 25 | Onslow County, North Carolina | 262 | 1:321 | 51,560 | 162,400 |
| 24 | Liberty County, Texas | 104 | 1:319 | 50,917 | 115,300 |
| 23 | Gates County, North Carolina | 15 | 1:318 | 45,871 | 142,400 |
| 22 | St. Clair County, Illinois | 361 | 1:317 | 57,473 | 134,800 |
| 21 | Grant County, Indiana | 94 | 1:317 | 46,900 | 96,300 |
| 20 | Cook County, Illinois | 7,265 | 1:312 | 67,886 | 255,500 |
| 19 | Campbell County, Wyoming | 64 | 1:310 | 80,887 | 224,400 |
| 18 | Atlantic County, New Jersey | 436 | 1:303 | 63,680 | 216,600 |
| 17 | Ocean County, New Jersey | 988 | 1:298 | 72,679 | 286,700 |
| 16 | Lexington County, South Carolina | 430 | 1:297 | 62,740 | 163,200 |
| 15 | Madison County, Illinois | 403 | 1:294 | 64,045 | 138,500 |
| 14 | Dorchester County, South Carolina | 220 | 1:294 | 63,501 | 213,000 |
| 13 | Sullivan County, Indiana | 30 | 1:293 | 49,449 | 89,400 |
| 12 | Kendall County, Illinois | 155 | 1:290 | 96,854 | 243,700 |
| 11 | Jones County, North Carolina | 16 | 1:290 | 38,324 | 92,200 |
| 10 | Warren County, New Jersey | 164 | 1:283 | 83,497 | 265,700 |
| 9 | Huron County, Ohio | 91 | 1:280 | 55,041 | 131,600 |
| 8 | Will County, Illinois | 917 | 1:273 | 90,800 | 239,400 |
| 7 | Sussex County, New Jersey | 230 | 1:273 | 96,222 | 271,500 |
| 6 | Gloucester County, New Jersey | 454 | 1:258 | 89,056 | 224,300 |
| 5 | Camden County, New Jersey | 840 | 1:253 | 70,957 | 200,400 |
| 4 | Burlington County, New Jersey | 778 | 1:238 | 90,329 | 259,600 |
| 3 | Salem County, New Jersey | 124 | 1:224 | 64,234 | 185,700 |
| 2 | Cuyahoga County, Ohio | 3,100 | 1:199 | 51,741 | 137,800 |
| 1 | Cumberland County, New Jersey | 290 | 1:197 | 55,709 | 166,400 |