

Sean Pavone // Shutterstock
Where people in St. Louis are moving to most
Stacker compiled a list of where people in St. Louis, MO-IL Metro Area are moving to the most using data from the U.S. Census Bureau. Metros are ranked by the estimated number of people who moved to the metro from St. Louis between 2015 and 2019. Ties were broken by gross migration.
You may also like: Most expensive homes for sale in St. Louis
David Wilson // Flickr
#50. Knoxville, TN Metro Area
– Migration to Knoxville in 2015-2019: 359
– Migration from Knoxville to St. Louis: 45 (#93 most common destination from Knoxville)
– Net migration: 314 to Knoxville
Blankfaze // Wikimedia Commons
#49. Pensacola-Ferry Pass-Brent, FL Metro Area
– Migration to Pensacola in 2015-2019: 370
– Migration from Pensacola to St. Louis: 7 (#175 most common destination from Pensacola)
– Net migration: 363 to Pensacola
lowahwyman // Wikimedia Commons
#48. Des Moines-West Des Moines, IA Metro Area
– Migration to Des Moines in 2015-2019: 376
– Migration from Des Moines to St. Louis: 490 (#10 most common destination from Des Moines)
– Net migration: 114 to St. Louis
Daniel Schwen // Wikimedia Commons
#47. Champaign-Urbana, IL Metro Area
– Migration to Champaign in 2015-2019: 379
– Migration from Champaign to St. Louis: 395 (#3 most common destination from Champaign)
– Net migration: 16 to St. Louis
Teemu008 /// Flickr
#46. Bloomington, IL Metro Area
– Migration to Bloomington in 2015-2019: 405
– Migration from Bloomington to St. Louis: 267 (#7 most common destination from Bloomington)
– Net migration: 138 to Bloomington
You may also like: Cities with the most expensive homes in St. Louis metro area
Wikimedia
#45. Oklahoma City, OK Metro Area
– Migration to Oklahoma City in 2015-2019: 421
– Migration from Oklahoma City to St. Louis: 489 (#14 most common destination from Oklahoma City)
– Net migration: 68 to St. Louis
en:User:Paul.h // Wikimedia
#44. San Francisco-Oakland-Berkeley, CA Metro Area
– Migration to San Francisco in 2015-2019: 424
– Migration from San Francisco to St. Louis: 658 (#47 most common destination from San Francisco)
– Net migration: 234 to St. Louis
Robert Lawton // Wikimedia
#43. Peoria, IL Metro Area
– Migration to Peoria in 2015-2019: 438
– Migration from Peoria to St. Louis: 792 (#3 most common destination from Peoria)
– Net migration: 354 to St. Louis
Max Pixel
#42. Milwaukee-Waukesha, WI Metro Area
– Migration to Milwaukee in 2015-2019: 444
– Migration from Milwaukee to St. Louis: 588 (#16 most common destination from Milwaukee)
– Net migration: 144 to St. Louis
Chris Watson // Wikicommons
#41. Louisville/Jefferson County, KY-IN Metro Area
– Migration to Louisville/Jefferson County in 2015-2019: 450
– Migration from Louisville/Jefferson County to St. Louis: 323 (#24 most common destination from Louisville/Jefferson County)
– Net migration: 127 to Louisville/Jefferson County
You may also like: Highest-rated fine dining restaurants in St. Louis, according to Tripadvisor
Brandonrush // Wikicommons
#40. Fayetteville-Springdale-Rogers, AR Metro Area
– Migration to Fayetteville in 2015-2019: 456
– Migration from Fayetteville to St. Louis: 265 (#12 most common destination from Fayetteville)
– Net migration: 191 to Fayetteville
Photolitherland // Wikicommons
#39. Little Rock-North Little Rock-Conway, AR Metro Area
– Migration to Little Rock in 2015-2019: 459
– Migration from Little Rock to St. Louis: 416 (#11 most common destination from Little Rock)
– Net migration: 43 to Little Rock
PhotosByMahin // Pixabay
#38. Detroit-Warren-Dearborn, MI Metro Area
– Migration to Detroit in 2015-2019: 460
– Migration from Detroit to St. Louis: 498 (#42 most common destination from Detroit)
– Net migration: 38 to St. Louis
Daniel Orth // Flickr
#37. Riverside-San Bernardino-Ontario, CA Metro Area
– Migration to Riverside in 2015-2019: 463
– Migration from Riverside to St. Louis: 198 (#91 most common destination from Riverside)
– Net migration: 265 to Riverside
Pat McGinley // Shutterstock
#36. North Port-Sarasota-Bradenton, FL Metro Area
– Migration to North Port in 2015-2019: 478
– Migration from North Port to St. Louis: 71 (#72 most common destination from North Port)
– Net migration: 407 to North Port
You may also like: Highest paying jobs in St. Louis that require a bachelor’s degree
AndrewAvitus // Wikicommons’
#35. Jacksonville, FL Metro Area
– Migration to Jacksonville in 2015-2019: 480
– Migration from Jacksonville to St. Louis: 368 (#33 most common destination from Jacksonville)
– Net migration: 112 to Jacksonville
Pixabay
#34. San Antonio-New Braunfels, TX Metro Area
– Migration to San Antonio in 2015-2019: 482
– Migration from San Antonio to St. Louis: 281 (#57 most common destination from San Antonio)
– Net migration: 201 to San Antonio
Sean Pavone // Shutterstock
#33. Boston-Cambridge-Newton, MA-NH Metro Area
– Migration to Boston in 2015-2019: 487
– Migration from Boston to St. Louis: 400 (#65 most common destination from Boston)
– Net migration: 87 to Boston
Pixabay
#32. Austin-Round Rock-Georgetown, TX Metro Area
– Migration to Austin in 2015-2019: 488
– Migration from Austin to St. Louis: 210 (#67 most common destination from Austin)
– Net migration: 278 to Austin
Stuart Seeger // Wikicommons
#31. Portland-Vancouver-Hillsboro, OR-WA Metro Area
– Migration to Portland in 2015-2019: 507
– Migration from Portland to St. Louis: 127 (#91 most common destination from Portland)
– Net migration: 380 to Portland
You may also like: Highest-rated cheap eats in St. Louis, according to Tripadvisor
Canva
#30. Cincinnati, OH-KY-IN Metro Area
– Migration to Cincinnati in 2015-2019: 516
– Migration from Cincinnati to St. Louis: 501 (#23 most common destination from Cincinnati)
– Net migration: 15 to Cincinnati
randy andy // Shutterstock
#29. Las Vegas-Henderson-Paradise, NV Metro Area
– Migration to Las Vegas in 2015-2019: 532
– Migration from Las Vegas to St. Louis: 698 (#25 most common destination from Las Vegas)
– Net migration: 166 to St. Louis
BusinessEditorUSA // Wikimedia Commons
#28. Charlotte-Concord-Gastonia, NC-SC Metro Area
– Migration to Charlotte in 2015-2019: 549
– Migration from Charlotte to St. Louis: 291 (#63 most common destination from Charlotte)
– Net migration: 258 to Charlotte
Sean Pavone // Shutterstock
#27. Indianapolis-Carmel-Anderson, IN Metro Area
– Migration to Indianapolis in 2015-2019: 594
– Migration from Indianapolis to St. Louis: 527 (#31 most common destination from Indianapolis)
– Net migration: 67 to Indianapolis
Explorecdale // Wikimedia Commons
#26. Carbondale-Marion, IL Metro Area
– Migration to Carbondale in 2015-2019: 606
– Migration from Carbondale to St. Louis: 635 (#2 most common destination from Carbondale)
– Net migration: 29 to St. Louis
You may also like: Highest paying jobs that require a 2 year degree in St. Louis
Sherry V Smith // Shutterstock
#25. Virginia Beach-Norfolk-Newport News, VA-NC Metro Area
– Migration to Virginia Beach in 2015-2019: 613
– Migration from Virginia Beach to St. Louis: 752 (#25 most common destination from Virginia Beach)
– Net migration: 139 to St. Louis
Tony Webster // Wikicommons
#24. Minneapolis-St. Paul-Bloomington, MN-WI Metro Area
– Migration to Minneapolis in 2015-2019: 643
– Migration from Minneapolis to St. Louis: 610 (#36 most common destination from Minneapolis)
– Net migration: 33 to Minneapolis
Public Domain
#23. Seattle-Tacoma-Bellevue, WA Metro Area
– Migration to Seattle in 2015-2019: 700
– Migration from Seattle to St. Louis: 583 (#52 most common destination from Seattle)
– Net migration: 117 to Seattle
f11photo // Shutterstock
#22. Nashville-Davidson–Murfreesboro–Franklin, TN Metro Area
– Migration to Nashville in 2015-2019: 727
– Migration from Nashville to St. Louis: 531 (#23 most common destination from Nashville)
– Net migration: 196 to Nashville
BDS2006 // Wikimedia
#21. Los Angeles-Long Beach-Anaheim, CA Metro Area
– Migration to Los Angeles in 2015-2019: 736
– Migration from Los Angeles to St. Louis: 1,045 (#51 most common destination from Los Angeles)
– Net migration: 309 to St. Louis
You may also like: Highest paying jobs in St. Louis that require a graduate degree
Songquan Deng // Shutterstock
#20. Orlando-Kissimmee-Sanford, FL Metro Area
– Migration to Orlando in 2015-2019: 758
– Migration from Orlando to St. Louis: 185 (#85 most common destination from Orlando)
– Net migration: 573 to Orlando
Robert Corby // Wikimedia Commons
#19. Colorado Springs, CO Metro Area
– Migration to Colorado Springs in 2015-2019: 795
– Migration from Colorado Springs to St. Louis: 96 (#96 most common destination from Colorado Springs)
– Net migration: 699 to Colorado Springs
SD Dirk // Flickr
#18. San Diego-Chula Vista-Carlsbad, CA Metro Area
– Migration to San Diego in 2015-2019: 797
– Migration from San Diego to St. Louis: 577 (#52 most common destination from San Diego)
– Net migration: 220 to San Diego
Noel Pennington//Flickr
#17. Memphis, TN-MS-AR Metro Area
– Migration to Memphis in 2015-2019: 799
– Migration from Memphis to St. Louis: 1,061 (#5 most common destination from Memphis)
– Net migration: 262 to St. Louis
aka Kath // Flickr
#16. Springfield, IL Metro Area
– Migration to Springfield in 2015-2019: 863
– Migration from Springfield to St. Louis: 1,123 (#1 most common destination from Springfield)
– Net migration: 260 to St. Louis
You may also like: Highest and lowest paying education jobs in St. Louis
King of Hearts // Wikimedia
#15. New York-Newark-Jersey City, NY-NJ-PA Metro Area
– Migration to New York in 2015-2019: 965
– Migration from New York to St. Louis: 1,577 (#65 most common destination from New York)
– Net migration: 612 to St. Louis
Kolossos // Wikimedia Commons
#14. Miami-Fort Lauderdale-Pompano Beach, FL Metro Area
– Migration to Miami in 2015-2019: 1,092
– Migration from Miami to St. Louis: 285 (#92 most common destination from Miami)
– Net migration: 807 to Miami
Alvesgaspar // Wikimedia
#13. Tampa-St. Petersburg-Clearwater, FL Metro Area
– Migration to Tampa in 2015-2019: 1,140
– Migration from Tampa to St. Louis: 707 (#32 most common destination from Tampa)
– Net migration: 433 to Tampa
f11photo // Shutterstock
#12. Denver-Aurora-Lakewood, CO Metro Area
– Migration to Denver in 2015-2019: 1,178
– Migration from Denver to St. Louis: 579 (#38 most common destination from Denver)
– Net migration: 599 to Denver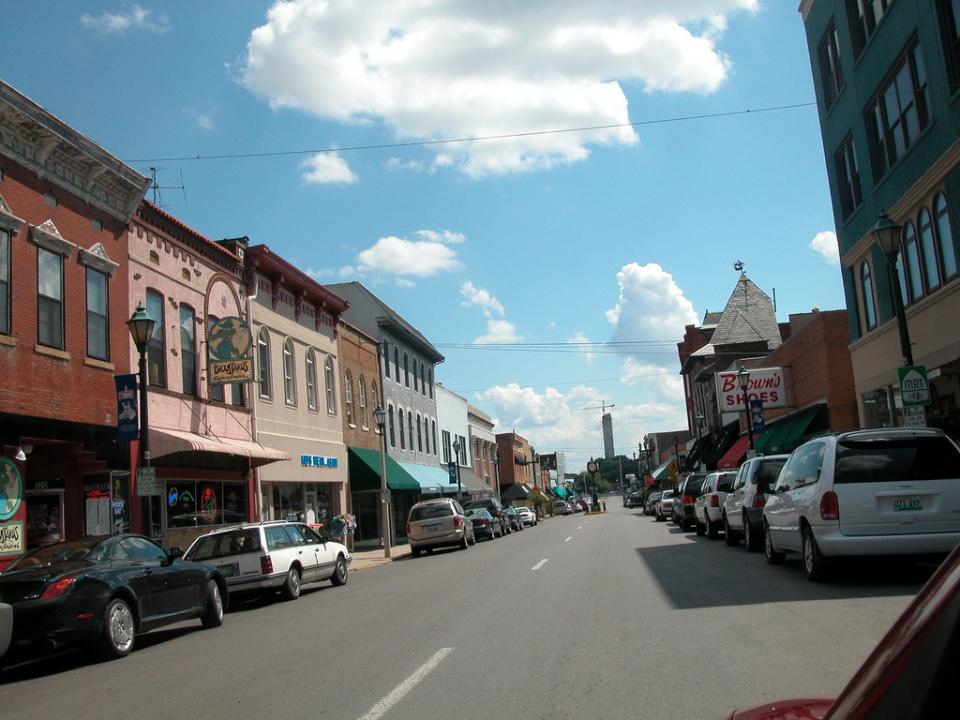
David Wilson // Flickr
#11. Cape Girardeau, MO-IL Metro Area
– Migration to Cape Girardeau in 2015-2019: 1,244
– Migration from Cape Girardeau to St. Louis: 996 (#1 most common destination from Cape Girardeau)
– Net migration: 248 to Cape Girardeau
You may also like: Highest-rated pizza restaurants in St. Louis
Katherine Dowler // Wikimedia
#10. Jefferson City, MO Metro Area
– Migration to Jefferson City in 2015-2019: 1,395
– Migration from Jefferson City to St. Louis: 808 (#2 most common destination from Jefferson City)
– Net migration: 587 to Jefferson City
Andrew Bossi // Wikimedia
#9. Washington-Arlington-Alexandria, DC-VA-MD-WV Metro Area
– Migration to Washington in 2015-2019: 1,539
– Migration from Washington to St. Louis: 1,008 (#52 most common destination from Washington)
– Net migration: 531 to Washington
skeeze // Pixabay
#8. Houston-The Woodlands-Sugar Land, TX Metro Area
– Migration to Houston in 2015-2019: 1,614
– Migration from Houston to St. Louis: 758 (#43 most common destination from Houston)
– Net migration: 856 to Houston
DPPed// Wikimedia
#7. Phoenix-Mesa-Chandler, AZ Metro Area
– Migration to Phoenix in 2015-2019: 1,625
– Migration from Phoenix to St. Louis: 550 (#47 most common destination from Phoenix)
– Net migration: 1,075 to Phoenix
Keizers // Wikimedia Commons
#6. Atlanta-Sandy Springs-Alpharetta, GA Metro Area
– Migration to Atlanta in 2015-2019: 1,987
– Migration from Atlanta to St. Louis: 1,352 (#33 most common destination from Atlanta)
– Net migration: 635 to Atlanta
You may also like: Highest-rated Italian restaurants in St. Louis, according to Tripadvisor
TommyBrison // Shutterstock
#5. Kansas City, MO-KS Metro Area
– Migration to Kansas City in 2015-2019: 2,629
– Migration from Kansas City to St. Louis: 3,540 (#2 most common destination from Kansas City)
– Net migration: 911 to St. Louis
Alan Botting // Wikimedia Commons
#4. Dallas-Fort Worth-Arlington, TX Metro Area
– Migration to Dallas in 2015-2019: 3,071
– Migration from Dallas to St. Louis: 2,092 (#21 most common destination from Dallas)
– Net migration: 979 to Dallas
Pixabay
#3. Columbia, MO Metro Area
– Migration to Columbia in 2015-2019: 3,075
– Migration from Columbia to St. Louis: 2,277 (#1 most common destination from Columbia)
– Net migration: 798 to Columbia
Jose Kevo // Wikicommons
#2. Springfield, MO Metro Area
– Migration to Springfield in 2015-2019: 3,468
– Migration from Springfield to St. Louis: 1,583 (#2 most common destination from Springfield)
– Net migration: 1,885 to Springfield
Christopher & Amy Esposito // Wikicommons
#1. Chicago-Naperville-Elgin, IL-IN-WI Metro Area
– Migration to Chicago in 2015-2019: 4,300
– Migration from Chicago to St. Louis: 5,060 (#11 most common destination from Chicago)
– Net migration: 760 to St. Louis
You may also like: People from these metros are finding new jobs in St. Louis