Tableau adds automated, plain-language explanations to dashboards


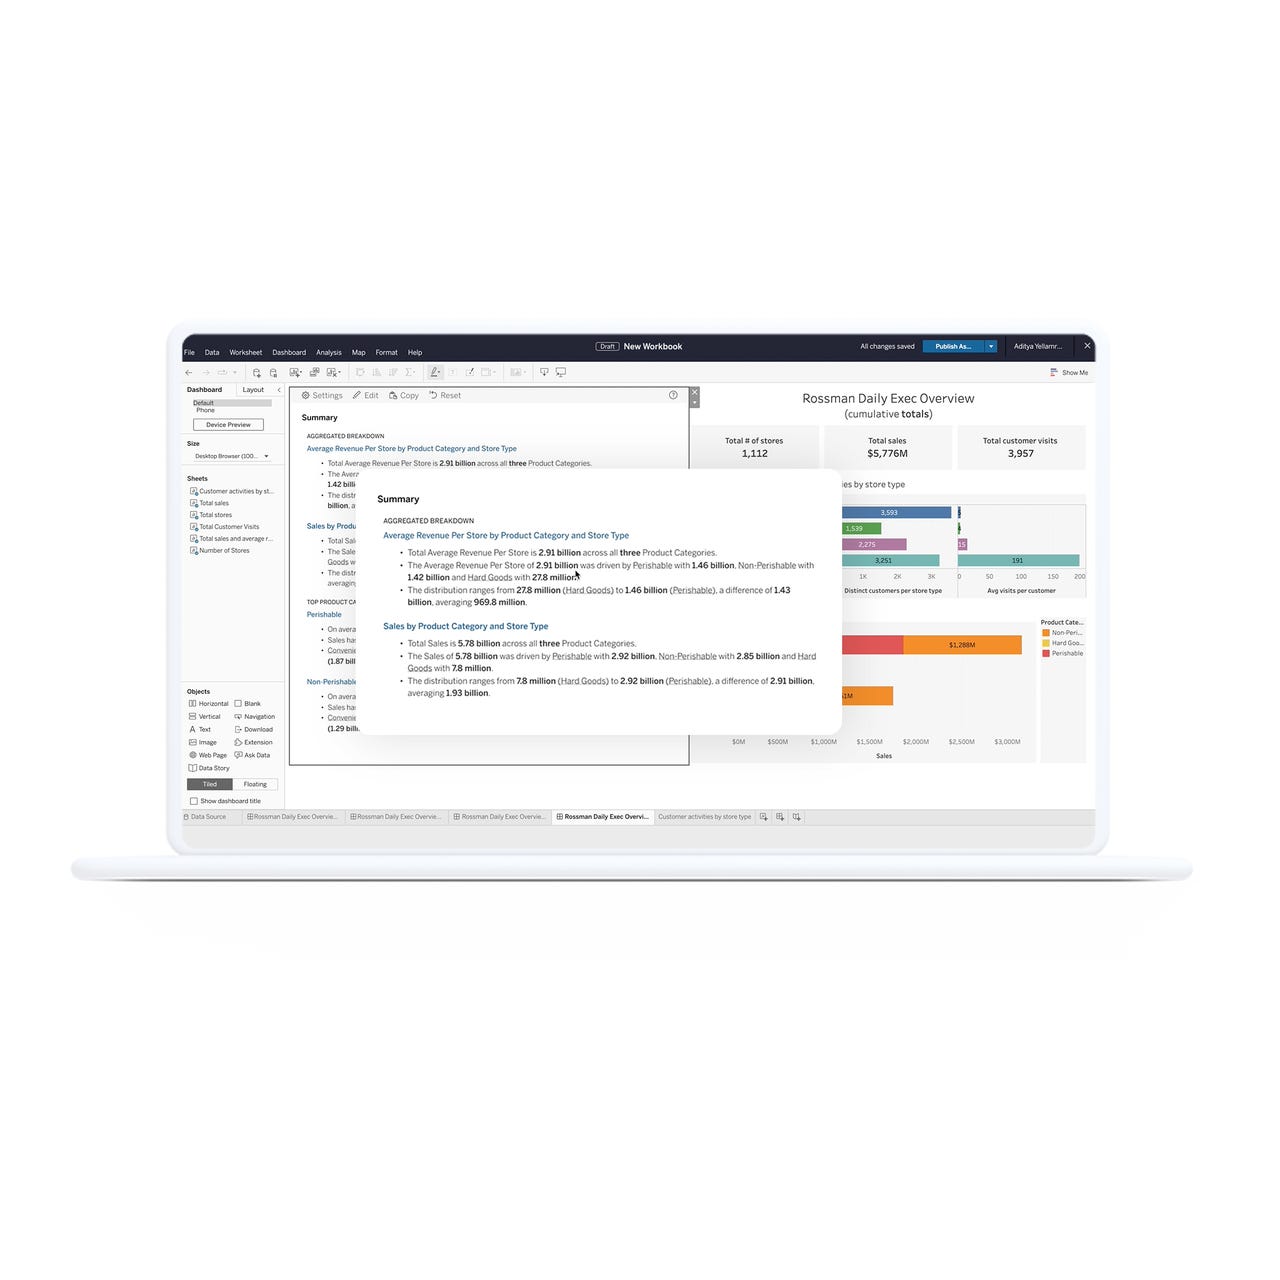
Tableau on Thursday announced a new feature that automatically adds plain-language explanations to dashboards, making it easier for people to understand the data they're looking at. The new Data Stories feature works at scale, eliminating the need for users to explain the dashboards they've created repeatedly.
Data Stories was one of several new features announced Tuesday by Tableau, the Salesforce-owned data visualization platform. The company also introduced Tableau Cloud, the latest iteration of Tableau online -- the cloud-based version of its software designed for enterprise customers.
While Tableau still offers self-managed services, its focus on Tableau Cloud shows how the enterprise has moved largely to SaaS products. The company said that three-quarters of new Tableau customers choose its cloud product over an on-premise or hybrid solution.
Along with Data Stories, Tableau also announced that it's expanding Accelerators -- the ready-to-use, customizable dashboards that can be used across multiple industries, departments and enterprise applications. There are now more than 100 Accelerators available on the Tableau Exchange -- a hub for products that extend the Tableau platform.
New admin capabilities are coming, including Customer-Managed Encryption Keys for an added layer of data protection. The new Activity Log feature will give admins detailed event data, so they can better understand how individuals are using Tableau.
Tableau is also extending the reach of Business Science, a class of AI-powered analytics, bringing it into CRM Analytics. For instance, a new Text Clustering feature will leverage machine learning (ML) models to extract keywords from large text fields.