Analysis
Litecoin’s descent to the $104-level could be followed by this…
Disclaimer: The findings of the following analysis are the sole opinions of the writer and should not be considered investment advice
The overall market sentiment has been bearish for the crypto-market in recent weeks. Whether this is a brief period of uncertainty before the resumption of a bullish trend for Bitcoin is yet to be seen. In the meantime, the altcoin market has taken a stronger beating. This is how the market operates, and it has bullish cycles followed by times of sharp drops for certain weak altcoins.
Litecoin has survived for years and has a market cap of over $1 billion. While Litecoin won’t be forgotten anytime soon, it is not immune to drops of 30% or greater – We saw one just last week. Could another follow in the weeks to come?
LTC- 12 hour chart

Source: LTC/USDT on TradingView
LTC was back in the $105-$110 area of demand that it had visited in June and July 2021. In July, the price bounced sharply from this area. However, the most recent test of this demand zone was met with a lukewarm response from bulls.
The market structure was bearish as the price formed a series of lower highs and lower lows. A set of Fibonacci retracement and extension lines (white) were plotted based on LTC’s drop from $219 to $129 in early December.
This gave the $104.7-level as the 27.2% extension level. Generally, the price sees the previous trend stall at the 27.2% and 61.8% extension levels, and these are areas where the trend can also begin to reverse.
A reversal was not yet in sight for Litecoin.
Rationale
Source: LTC/USDT on TradingView
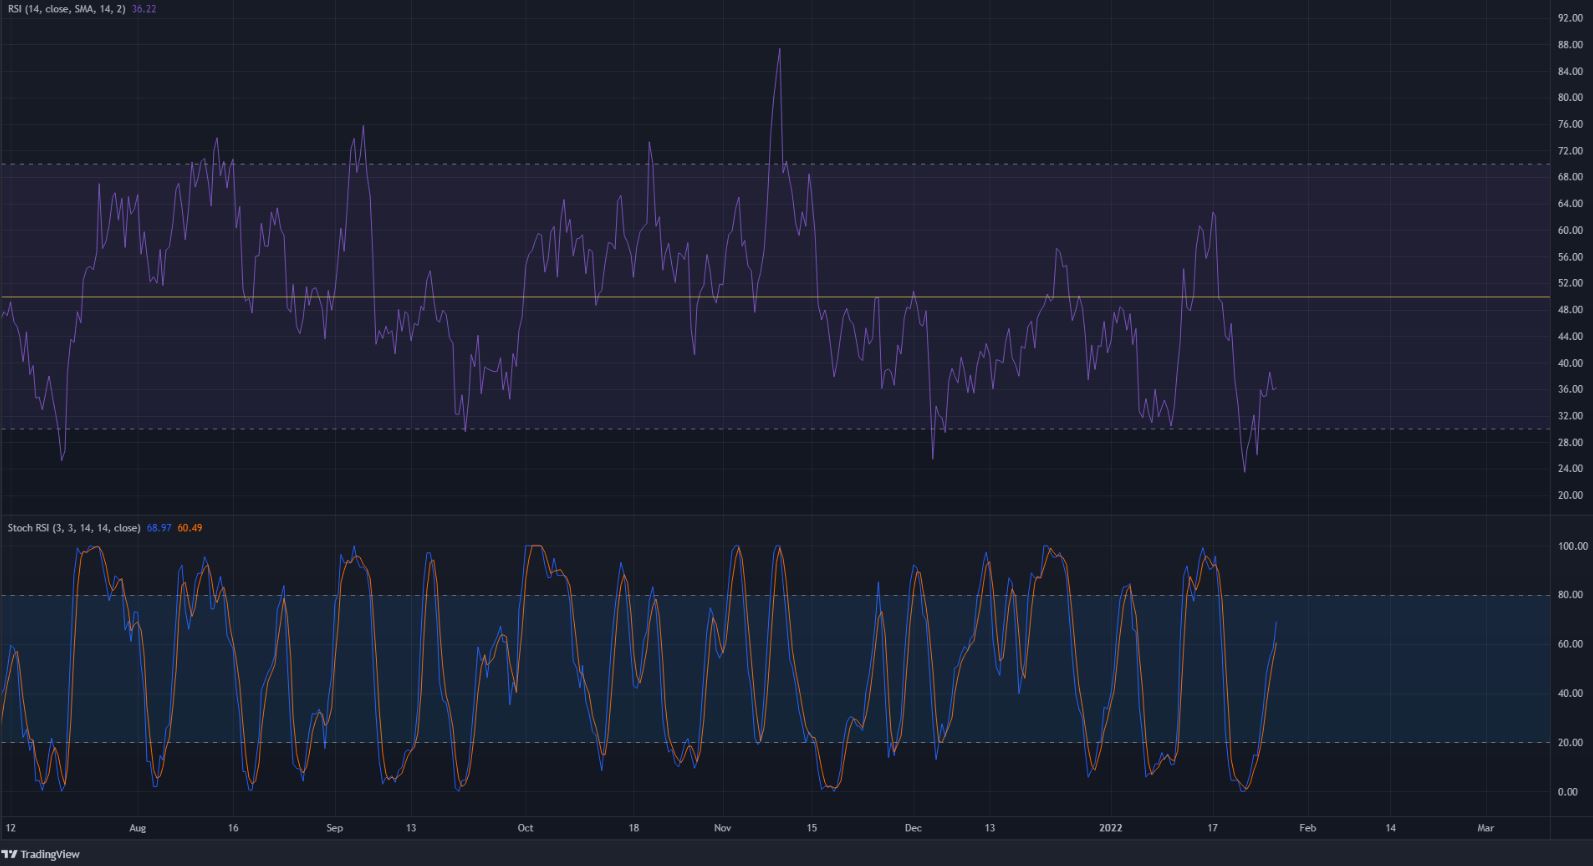
On the price chart, the 21-period SMA (orange) was moving beneath the 55 SMA (green). The RSI on the 12-hour chart has also been below neutral 50 for the better part of the past two months.
Taken together, this was an affirmation of bearish momentum. Another thing to note was that when the 12-hour RSI closed below 30, it has usually been followed by further losses over the next two or three trading sessions.
At the time of writing, the Stochastic RSI was climbing. This showed that bears were once more gathering strength to force another leg downward.
Conclusion
Price seeks liquidity, and LTC was trading within a region of long-term demand. A bounce followed by another leg downward appeared to be likely for LTC over the next month. This bounce could climb as high as the $129-level. This level represented the former lows earlier this month and had confluence with the 55 SMA too.