

Monmouth Poll: GOP has Congress Edge by Default
Congressional Republicans have a small edge over their Democratic colleagues on a dubious metric – they are slightly less likely to be seen as lacking concern for the average American’s financial well-being. This, along with a continuing decline in President Joe Biden’s job rating, contributes to a small preference for GOP control after this year’s midterm elections. At the same time, the Monmouth University Poll finds that elements of Biden’s spending plans remain broadly popular, but passage of the BBB legislation is not a top priority.
Few Americans believe that either political party truly cares about the average family’s pocketbook. Specifically, just 23% say the Democrats in Congress are very concerned with looking out for the economic well-being of average Americans while at the other end of the spectrum 47% say the Democrats are not really concerned. Similarly, just 20% say the Republicans in Congress are very concerned with average Americans’ financial status versus 42% who say the Republicans are not really concerned about it. Four years ago, Americans were slightly less likely to see Congressional Democrats (35%) as being unconcerned with average Americans’ economic well-being compared with the Republicans (40%). The partisan difference is reversed in the current poll, although the gap is not large in either year.
“The GOP advantage on the economic concern question is not large as a percentage, but Democrats had a similarly small edge on this metric in 2018 and ended up gaining 41 House seats,” said Patrick Murray, director of the independent Monmouth University Polling Institute.
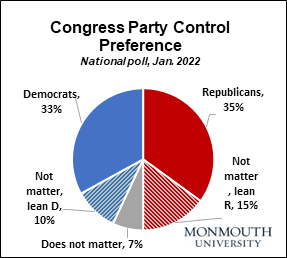
The public is almost evenly split between saying they would rather see the Republicans (35%) or the Democrats (33%) in control of Congress. However, pushing those who initially say party control does not matter on which direction they lean adds 15% to the GOP column versus a smaller 10% for the Democrats. Just over half of the public (54%) says it is very important to have their preferred party in control of Congress. This number is slightly higher among those who want to retain Democratic control (61%) than among those who want a change to Republican control (56%).
Just 19% of the public approves of the job Congress is currently doing. Almost 3 in 4 (74%) disapprove – including 81% of Republicans and 59% of Democrats. Just 24% of Americans feel the country is headed in the right direction. Another warning sign for the party in power is a shift in self-reported partisan affiliation. Currently, 26% of American adults identify themselves as Democrats, a number that ranged from 30% to 34% in Monmouth polling throughout last year. Republican identifiers currently stand at 31% of the population, which is up from a range of 23% to 27% in 2021. Moreover, when these numbers are combined with independents who say they lean toward either party, Republicans (51%) have a decided advantage over Democrats (41%).
“Republicans have a default advantage heading into the midterms. Simply put, they are not currently in power. Voters who don’t see much difference in the parties are going to be a key factor. That means the prospect of changing the congressional majority does not necessarily translate into hope that Washington will get any better,” said Murray.
The public is divided on how productive the federal government would become if Republicans take control of Congress after this year’s midterm elections. Similar percentages think Washington would get more done (27%) as say it would get less done (30%) under a GOP-led Congress. Another 41% say it would get the same amount done as it is doing now. Among those who prefer Republican leadership, 56% believe Congress would get more done under GOP control. Among those who want to retain Democratic leadership, 71% say it would get less done with the GOP. Among those who say party control does not matter (or only lean toward a party preference), though, the vast majority (65%) say Washington would get about the same amount done if Republicans take control as it does now under the Democrats.
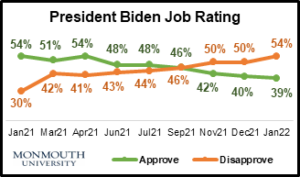
The poll finds that opinion of how much the president is concerned about the average American is no better than views of the two congressional parties. Specifically, just 30% feel Biden is very concerned with looking out for the economic well-being of average Americans. On the other hand, nearly half (47%) of the public feels he is not really concerned. These numbers are similar to Monmouth University Poll results to the same question about former President Donald Trump shortly before his midterm elections – 35% said Trump was very concerned while 46% said he was not really concerned (August 2018). Biden currently holds a job performance rating of 39% approve and 54% disapprove. This marks another downward tick since his net job rating crossed into negative territory at the end of last year.
“Biden’s go-to image during the campaign was ‘Joe from Scranton.’ The public view now is he’s lost the connection to those working-class roots,” said Murray.
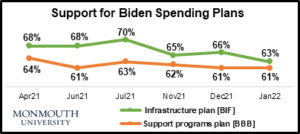
Support for the plan to improve roads, bridges, trains, internet access, the power grid, and clean energy progress – basically the elements of the Bipartisan Infrastructure deal (BIF) that was passed last year – has ticked downward but still stands at a majority (63% now, from a high of 70% in July 2021). Another plan to expand healthcare, childcare, paid leave and college tuition support – key elements of the currently stalled Build Back Better (BBB) legislation – retains fairly steady support (61%). Furthermore, most Americans (56%) continue to support the climate change funding part of the BBB bill.
A key problem for the BBB bill, though, is only 1 in 4 Americans (24%) – including less than half of Democrats (44%) – say that enacting it should be a top priority. A little over one-third (37%) say this legislation is important but there are more pressing matters for Congress to address, 9% say it is not really important to take up this bill right away, and 28% are opposed to its passage at all. These results are similar to December.
“Individual elements of Biden’s spending plans remain broadly popular. It’s the public relations part of the job that seems to be the bigger problem,” said Murray.
The Monmouth University Poll was conducted by telephone from January 20 to 24, 2022 with 794 adults in the United States. The question results in this release have a margin of error of +/- 3.5 percentage points. The poll was conducted by the Monmouth University Polling Institute in West Long Branch, NJ.
QUESTIONS AND RESULTS
(* Some columns may not add to 100% due to rounding.)
1. Do you approve or disapprove of the job Joe Biden is doing as president?
|
TREND: |
Jan.2022 |
Dec.2021 |
Nov.2021 |
Sept.2021 |
July2021 |
June2021 |
April2021 |
March2021 |
Jan.2021 |
|
Approve |
39% |
40% |
42% |
46% |
48% |
48% |
54% |
51% |
54% |
|
Disapprove |
54% |
50% |
50% |
46% |
44% |
43% |
41% |
42% |
30% |
|
(VOL) No opinion |
7% |
11% |
9% |
8% |
8% |
9% |
5% |
8% |
16% |
|
(n) |
(794) |
(808) |
(811) |
(802) |
(804) |
(810) |
(800) |
(802) |
(809) |
2. Do you approve or disapprove of the job the U.S. Congress is doing?
|
TREND: |
Jan.2022 |
Dec.2021 |
Nov.2021 |
Sept.2021 |
July2021 |
June2021 |
April2021 |
March2021 |
Jan.2021 |
|
Approve |
19% |
23% |
18% |
22% |
23% |
21% |
35% |
30% |
35% |
|
Disapprove |
74% |
66% |
70% |
65% |
62% |
65% |
56% |
59% |
51% |
|
(VOL) No opinion |
6% |
11% |
12% |
13% |
15% |
15% |
9% |
11% |
14% |
|
(n) |
(794) |
(808) |
(811) |
(802) |
(804) |
(810) |
(800) |
(802) |
(809) |
|
TREND: Continued |
Nov.2020 |
Early June2020 |
May2020 |
April2020 |
Feb.2020 |
Jan.2020 |
Dec.2019 |
Nov.2019 |
Sept.2019 |
Aug.2019 |
June2019 |
May2019 |
April2019 |
March2019 |
Jan.2019 |
|
Approve |
23% |
22% |
32% |
32% |
20% |
24% |
22% |
23% |
21% |
17% |
19% |
20% |
24% |
23% |
18% |
|
Disapprove |
64% |
69% |
55% |
55% |
69% |
62% |
65% |
64% |
68% |
71% |
69% |
71% |
62% |
68% |
72% |
|
(VOL) No opinion |
13% |
9% |
13% |
13% |
11% |
14% |
13% |
13% |
11% |
13% |
12% |
9% |
14% |
9% |
10% |
|
(n) |
(810) |
(807) |
(808) |
(857) |
(902) |
(903) |
(903) |
(908) |
(1,161) |
(800) |
(751) |
(802) |
(801) |
(802) |
(805) |
|
TREND: Continued |
Nov.2018 |
Aug.2018 |
June2018 |
April2018 |
March2018 |
Jan.2018 |
Dec.2017 |
Sept.2017 |
Aug.2017 |
July2017 |
May2017 |
March2017 |
Jan.2017 |
|
Approve |
23% |
17% |
19% |
17% |
18% |
21% |
16% |
17% |
18% |
19% |
19% |
25% |
23% |
|
Disapprove |
63% |
69% |
67% |
71% |
72% |
68% |
65% |
69% |
69% |
70% |
68% |
59% |
66% |
|
(VOL) No opinion |
14% |
14% |
14% |
12% |
11% |
11% |
19% |
15% |
13% |
11% |
13% |
16% |
11% |
|
(n) |
(802) |
(805) |
(806) |
(803) |
(803) |
(806) |
(806) |
(1,009) |
(805) |
(800) |
(1,002) |
(801) |
(801) |
|
TREND: Continued |
Sept.2016* |
Aug.2016* |
June2016* |
March2016 |
Jan.2016 |
Dec.2015 |
Oct.2015 |
Sept.2015 |
Aug.2015 |
July2015 |
June2015 |
April2015 |
Jan.2015 |
Dec.2014 |
July2013 |
|
Approve |
15% |
14% |
17% |
22% |
17% |
16% |
17% |
19% |
18% |
18% |
19% |
21% |
18% |
17% |
14% |
|
Disapprove |
77% |
78% |
76% |
68% |
73% |
73% |
71% |
71% |
72% |
69% |
71% |
67% |
70% |
73% |
76% |
|
(VOL) No opinion |
8% |
9% |
7% |
10% |
10% |
10% |
12% |
11% |
11% |
12% |
10% |
12% |
11% |
11% |
10% |
|
(n) |
(802) |
(803) |
(803) |
(1,008) |
(1,003) |
(1,006) |
(1,012) |
(1,009) |
(1,203) |
(1,001) |
(1,002) |
(1,005) |
(1,003) |
(1,008) |
(1,012) |
* Registered voters
3. Would you say things in the country are going in the right direction, or have they gotten off on the wrong track?
|
TREND: |
Jan.2022 |
Dec.2021 |
Nov.2021 |
Sept.2021 |
July2021 |
June2021 |
April2021 |
March2021 |
Jan.2021 |
|
Right direction |
24% |
30% |
31% |
29% |
38% |
37% |
46% |
34% |
42% |
|
Wrong track |
71% |
66% |
64% |
65% |
56% |
57% |
50% |
61% |
51% |
|
(VOL) Depends |
3% |
1% |
2% |
4% |
3% |
3% |
2% |
4% |
3% |
|
(VOL) Don’t know |
2% |
3% |
3% |
2% |
4% |
3% |
2% |
2% |
4% |
|
(n) |
(794) |
(808) |
(811) |
(802) |
(804) |
(810) |
(800) |
(802) |
(809) |
|
TREND: Continued |
Nov.2020 |
Early Sept.2020 |
Aug.2020 |
Late June2020 |
Early June2020 |
May2020 |
April2020 |
March2020 |
Feb.2020 |
Jan.2020 |
|
Right direction |
26% |
27% |
22% |
18% |
21% |
33% |
30% |
39% |
37% |
37% |
|
Wrong track |
68% |
66% |
72% |
74% |
74% |
60% |
61% |
54% |
57% |
56% |
|
(VOL) Depends |
4% |
4% |
4% |
5% |
4% |
4% |
5% |
4% |
6% |
6% |
|
(VOL) Don’t know |
2% |
3% |
2% |
3% |
1% |
3% |
5% |
3% |
1% |
1% |
|
(n) |
(810) |
(867) |
(868) |
(867) |
(807) |
(808) |
(857) |
(851) |
(902) |
(903) |
|
TREND: Continued |
Dec.2019 |
Nov.2019 |
Sept.2019 |
Aug.2019 |
June2019 |
May2019 |
April2019 |
March2019 |
Nov.2018 |
Aug.2018 |
June2018 |
April2018 |
March2018 |
Jan.2018 |
|
Right direction |
32% |
30% |
30% |
28% |
31% |
29% |
28% |
29% |
35% |
35% |
40% |
33% |
31% |
37% |
|
Wrong track |
56% |
61% |
61% |
62% |
62% |
63% |
62% |
63% |
55% |
57% |
53% |
58% |
61% |
57% |
|
(VOL) Depends |
8% |
7% |
6% |
8% |
6% |
4% |
7% |
6% |
7% |
6% |
3% |
5% |
6% |
3% |
|
(VOL) Don’t know |
4% |
2% |
2% |
2% |
2% |
3% |
3% |
2% |
3% |
3% |
3% |
4% |
1% |
3% |
|
(n) |
(903) |
(908) |
(1,161) |
(800) |
(751) |
(802) |
(801) |
(802) |
(802) |
(805) |
(806) |
(803) |
(803) |
(806) |
|
TREND: Continued |
Dec.2017 |
Aug.2017 |
May2017 |
March2017 |
Jan.2017 |
Aug.2016* |
Oct.2015 |
July2015 |
June2015 |
April2015 |
Dec.2014 |
July2013 |
|
Right direction |
24% |
32% |
31% |
35% |
29% |
30% |
24% |
28% |
23% |
27% |
23% |
28% |
|
Wrong track |
66% |
58% |
61% |
56% |
65% |
65% |
66% |
63% |
68% |
66% |
69% |
63% |
|
(VOL) Depends |
7% |
4% |
5% |
4% |
4% |
2% |
6% |
5% |
5% |
5% |
5% |
5% |
|
(VOL) Don’t know |
3% |
5% |
3% |
5% |
2% |
3% |
4% |
3% |
3% |
2% |
3% |
4% |
|
(n) |
(806) |
(805) |
(1,002) |
(801) |
(801) |
(803) |
(1,012) |
(1,001) |
(1,002) |
(1,005) |
(1,008) |
(1,012) |
* Registered voters
4. Would you rather see the Republicans or the Democrats in control of Congress, or doesn’t this matter to you? [CHOICES WERE ROTATED] [If DOES NOT MATTER: If you had to lean one way or the other would you pick the Republicans or the Democrats?]
|
|
Jan.2022 |
|
Republicans |
35% |
|
Not matter, but lean Rep |
15% |
|
Democrats |
33% |
|
Not matter, but lean Dem |
10% |
|
Does not matter, no lean |
7% |
|
(VOL) Don’t know |
0% |
|
(n) |
(794) |
5. Is it very important, somewhat important, or only a little important to have [Republicans/Democrats] in control of Congress? [CHOICE READ FROM Q4]
|
|
Jan.2022 |
|
Very important |
54% |
|
Somewhat important |
23% |
|
Only a little important |
15% |
|
(VOL) Don’t know / Does not matter who controls Congress (from Q4) |
8% |
|
(n) |
(794) |
6. For each of the following people or groups, please tell me whether you think they are very concerned, somewhat concerned, or not really concerned with looking out for the economic well-being of average Americans? [ITEMS WERE ROTATED]
President Biden
|
COMPARISON: |
BIDEN |
|
|
TRUMP |
|
|
Jan.2022 |
|
|
Aug.2018 |
|
Very concerned |
30% |
|
|
35% |
|
Somewhat concerned |
22% |
|
|
17% |
|
Not really concerned |
47% |
|
|
46% |
|
(VOL) Don’t know |
0% |
|
|
2% |
|
(n) |
(794) |
|
|
(805) |
The Republicans in Congress
|
TREND: |
Jan.2022 |
Aug.2018 |
|
Very concerned |
20% |
17% |
|
Somewhat concerned |
37% |
39% |
|
Not really concerned |
42% |
40% |
|
(VOL) Don’t know |
1% |
4% |
|
(n) |
(794) |
(805) |
The Democrats in Congress
|
TREND: |
Jan.2022 |
Aug.2018 |
|
Very concerned |
23% |
22% |
|
Somewhat concerned |
31% |
38% |
|
Not really concerned |
47% |
35% |
|
(VOL) Don’t know |
0% |
5% |
|
(n) |
(794) |
(805) |
President Biden proposed a couple of multi-trillion dollar spending plans last year.
7. An infrastructure plan was passed by Congress for spending on roads, bridges and trains, internet access, power grid improvements, and clean energy projects. In general, do you support or oppose this plan? [Is that strongly or somewhat support/oppose?]
|
TREND: |
Jan.2022 |
Dec.2021** |
Nov.2021** |
July2021** |
June2021** |
|
April2021* |
|
Strongly support |
40% |
42% |
44% |
51% |
49% |
Support |
68% |
|
Somewhat support |
23% |
24% |
21% |
19% |
19% |
||
|
Somewhat oppose |
9% |
9% |
8% |
8% |
8% |
Oppose |
29% |
|
Strongly oppose |
26% |
22% |
23% |
21% |
21% |
||
|
(VOL) Don’t know |
2% |
3% |
3% |
2% |
3% |
(VOL) Don’t know |
3% |
|
(n) |
(794) |
(808) |
(811) |
(804) |
(810) |
(n) |
(800) |
** Question wording was “[One is/The other is] an infrastructure plan to be spent on…”
* April 2021 wording was “President Biden recently proposed a $2 trillion infrastructure plan…”
8. Another plan that is still being considered by Congress would expand access to healthcare and childcare, and provide paid leave and college tuition support. In general, do you support or oppose this plan? [Is that strongly or somewhat support/oppose?]
|
TREND: |
Jan.2022 |
Dec.2021** |
Nov.2021** |
July2021** |
June2021** |
|
April2021* |
|
Strongly support |
42% |
42% |
45% |
47% |
41% |
Support |
64% |
|
Somewhat support |
19% |
19% |
17% |
16% |
20% |
||
|
Somewhat oppose |
8% |
8% |
7% |
8% |
10% |
Oppose |
34% |
|
Strongly oppose |
28% |
27% |
28% |
27% |
24% |
||
|
(VOL) Don’t know |
2% |
4% |
4% |
2% |
5% |
(VOL) Don’t know |
2% |
|
(n) |
(794) |
(808) |
(811) |
(804) |
(810) |
(n) |
(800) |
** Question wording was “[One is/The other is] a plan to expand access to…”
* April 2021 wording was “Biden is also expected to propose a large spending plan …”
9. The plan to expand healthcare and other forms of support also includes a significant amount of money to deal with climate change. In general, do you support or oppose the climate change part of the plan? [Is that strongly or somewhat support/oppose?]
|
TREND: |
Jan.2022 |
Dec.2021 |
Nov.2021 |
|
Strongly support |
40% |
42% |
47% |
|
Somewhat support |
16% |
14% |
13% |
|
Somewhat oppose |
8% |
11% |
7% |
|
Strongly oppose |
33% |
31% |
31% |
|
(VOL) Don’t know |
3% |
3% |
3% |
|
(n) |
(794) |
(808) |
(811) |
10. The bill on support programs and climate change passed the House, but still awaits action in the Senate. How important is it for Congress to enact this bill into law? Do you feel this should be the top priority; that it is important but there are other more pressing matters for Congress to deal with; that it is not really important to take up right away, or that it should not be passed at all?
|
TREND: |
Jan.2022 |
Dec.2021 |
|
Top priority |
24% |
28% |
|
Important, but other priorities |
37% |
33% |
|
Not really important |
9% |
9% |
|
Should not be passed at all |
28% |
26% |
|
(VOL) Don’t know |
2% |
3% |
|
(n) |
(79 4) |
(808) |
11. Democrats currently control Congress. If Republicans take control of Congress after this year’s midterm elections, do you think Washington would get more done, less done, or about the same amount done as it is doing now?
|
|
Jan.2022 |
|
More |
27% |
|
Less |
30% |
|
About the same |
41% |
|
(VOL) Don’t know |
2% |
|
(n) |
(794) |
[Q12-42 held for future release.]
METHODOLOGY
The Monmouth University Poll was sponsored and conducted by the Monmouth University Polling Institute from January 20 to 24, 2022 with a probability-based national random sample of 794 adults age 18 and older. This includes 267 contacted by a live interviewer on a landline telephone and 527 contacted by a live interviewer on a cell phone, in English. Telephone numbers were selected through a mix of random digit dialing and list-based sampling. Landline respondents were selected with a modified Troldahl-Carter youngest adult household screen. Interviewing services were provided by Braun Research, with sample obtained from Dynata (RDD, n=476), Aristotle (list, n=119) and a panel of prior Monmouth poll participants (n=199). Monmouth is responsible for all aspects of the survey design, data weighting and analysis. The full sample is weighted for region, age, education, gender and race based on US Census information (ACS 2018 one-year survey). For results based on this sample, one can say with 95% confidence that the error attributable to sampling has a maximum margin of plus or minus 3.5 percentage points (unadjusted for sample design). Sampling error can be larger for sub-groups (see table below). In addition to sampling error, one should bear in mind that question wording and practical difficulties in conducting surveys can introduce error or bias into the findings of opinion polls.
|
DEMOGRAPHICS (weighted) |
|
Self-Reported |
|
31% Republican |
|
43% Independent |
|
26% Democrat |
|
|
|
49% Male |
|
51% Female |
|
|
|
30% 18-34 |
|
33% 35-54 |
|
38% 55+ |
|
|
|
63% White |
|
12% Black |
|
16% Hispanic |
|
9% Asian/Other |
|
|
|
68% No degree |
|
32% 4 year degree |
|
MARGIN OF ERROR |
|||
|
unweighted sample |
moe(+/-) |
||
|
TOTAL |
|
794 |
3.5% |
|
REGISTERED VOTER |
Yes |
735 |
3.6% |
|
No |
59 |
12.8% |
|
|
SELF-REPORTED PARTY ID |
Republican |
242 |
6.3% |
|
Independent |
340 |
5.3% |
|
|
Democrat |
206 |
6.8% |
|
|
IDEOLOGY |
Liberal |
170 |
7.5% |
|
Moderate |
294 |
5.7% |
|
|
Conservative |
308 |
5.6% |
|
|
GENDER |
Male |
396 |
4.9% |
|
Female |
398 |
4.9% |
|
|
AGE |
18-34 |
105 |
9.6% |
|
35-54 |
268 |
6.0% |
|
|
55+ |
416 |
4.8% |
|
|
CHILDREN IN HOME |
Yes |
187 |
7.2% |
|
No |
601 |
4.0% |
|
|
RACE |
White, non-Hispanic |
601 |
4.0% |
|
Other |
169 |
7.5% |
|
|
COLLEGE GRADUATE |
No degree |
402 |
4.9% |
|
4 year degree |
388 |
5.0% |
|
|
WHITE COLLEGE |
White, no degree |
307 |
5.6% |
|
White, 4 year degree |
294 |
5.7% |
|
|
INCOME |
<$50K |
231 |
6.5% |
|
$50 to <$100K |
238 |
6.4% |
|
|
$100K+ |
273 |
5.9% |
|
Crosstabs may be found in the PDF file on the report webpage: https://www.monmouth.edu/polling-institute/reports/monmouthpoll_US_012622/


Leave a Reply