Altcoin
VeChain, Tezos, Ethereum Classic Price Analysis: 25 January
As the market leaders displayed recovery signs, VeChain managed to claw back and reclaim the $0.049-mark. Also, Tezos jumped from the lower band of the Bollinger bands toward its basis line. However, they still failed to induce trend-altering volumes.
Ethereum Classic struggled to cross the 20 SMA while entering a near-term low volatility phase.
VeChain (VET)
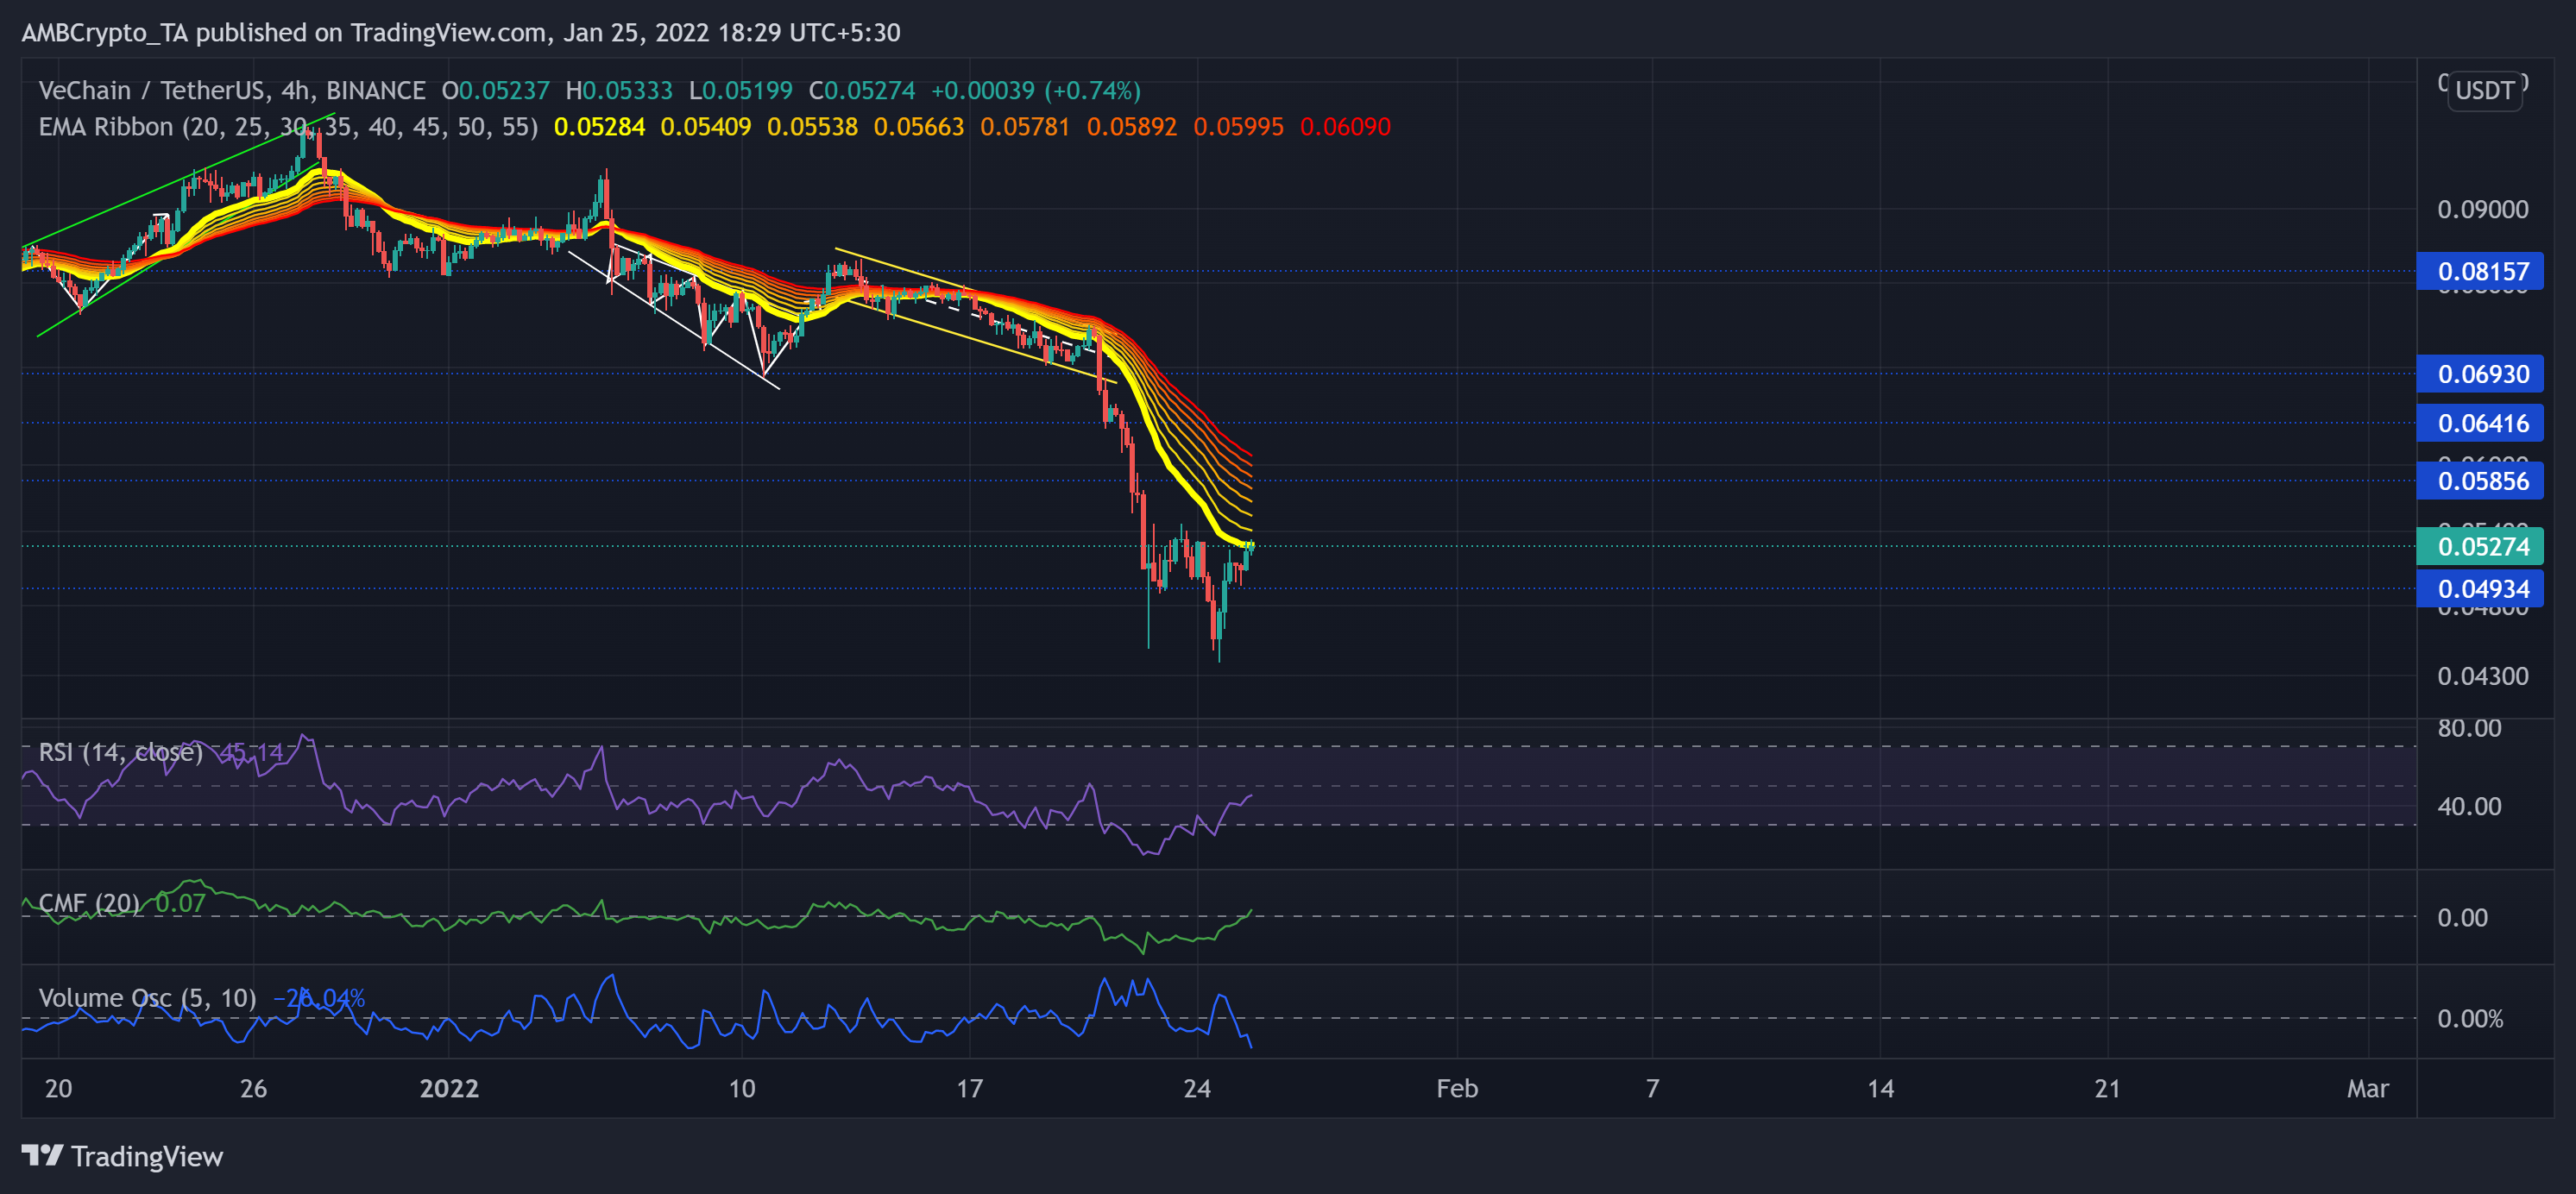
Source: TradingView, VET/USDT
VET lost 41.23% of its value (from 20 January) and plunged toward its 11-month on 24 January. The bulls even failed to defend the $0.05856-mark resistance (previous support). As a result, the price fell below all its EMA ribbons.
As the gap between the ribbons widened, the bears had an edge. Now, the bulls endeavored to cross the 20 EMA (dark yellow) as the selling pressure eased.
At press time, VET was trading at $0.05274. The bearish RSI needed to find a close above the half-line to make way for a sustained recovery. The CMF skewed in favor of the buyers after a sharp uptrend in the last three days. However, the last two green candlesticks occurred on low volumes, as evidenced by the Volume Oscillator.
Tezos (XTZ)
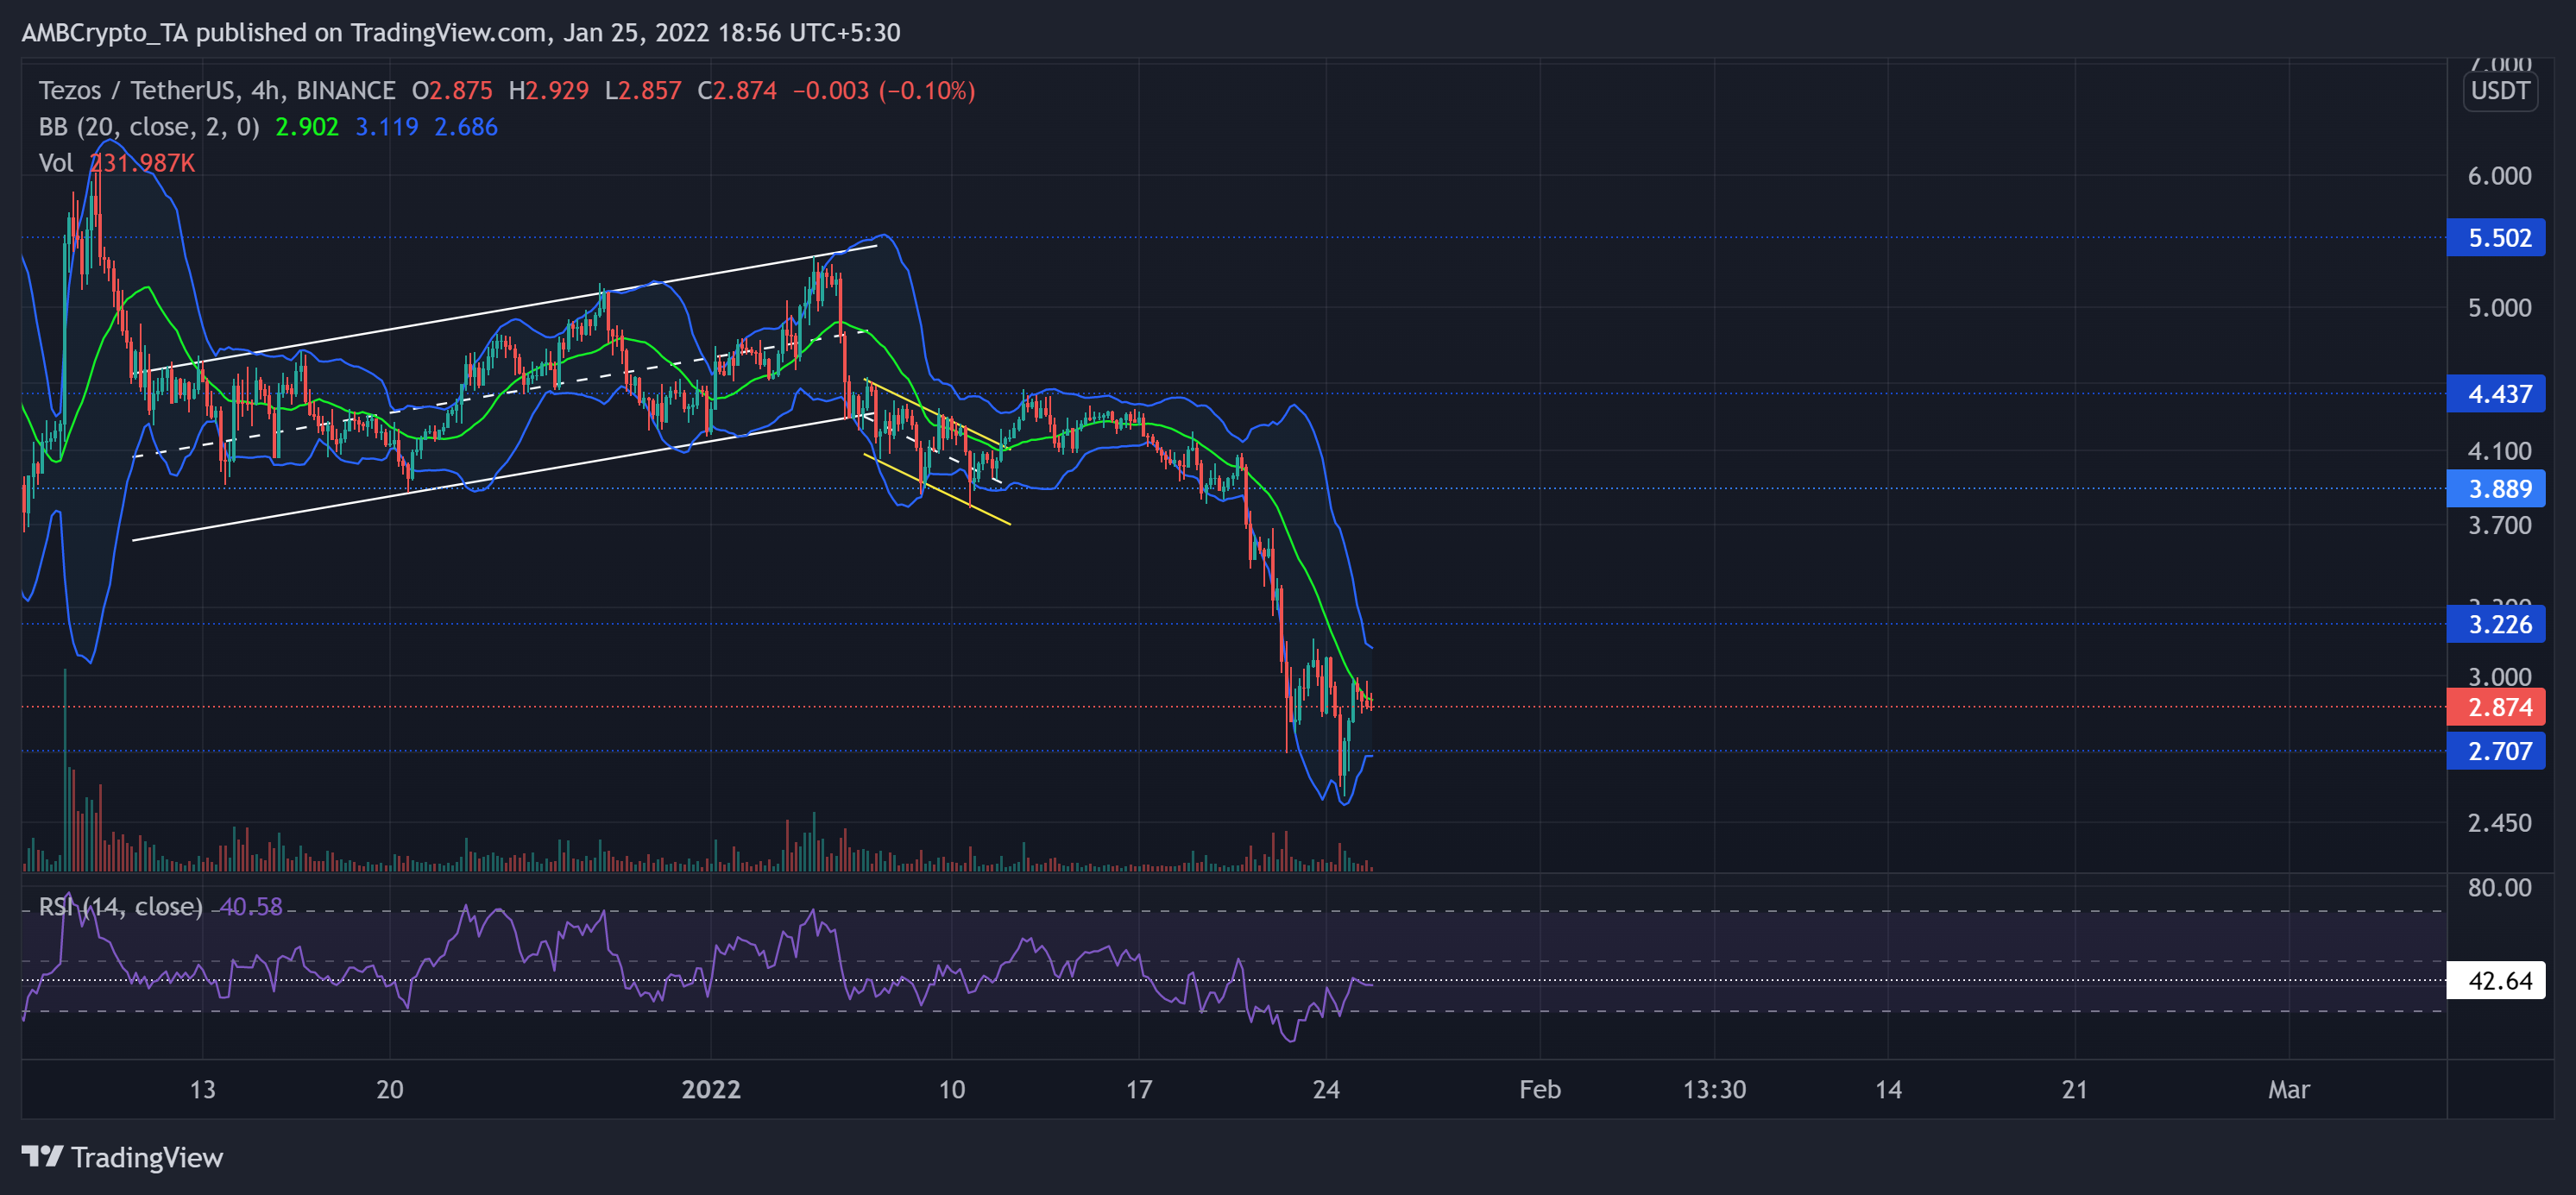
Source: TradingView, XTZ/USDT
The up-channel (white) breakdown tested the $3.8 five-month resistance (previous support) for 12 days until the broader sell-off on 21 January. Then, the alt registered a 37.73% decline and touched its six-month low on 24 January.
After falling towards the $2.7-mark, it showed strong revival signs from the lower band of the Bollinger Bands. But it still struggled to surpass the basis line (green).
At press time, XTZ traded at $2.874. After hitting its record low on 22 January, the RSI saw a 23 point revival in the last three days. It tested the 42-mark resistance before assuming a slightly weak trajectory. Besides, the volume histogram depicted that the pullback volumes have been higher than incline volumes.
Ethereum Classic (ETC)
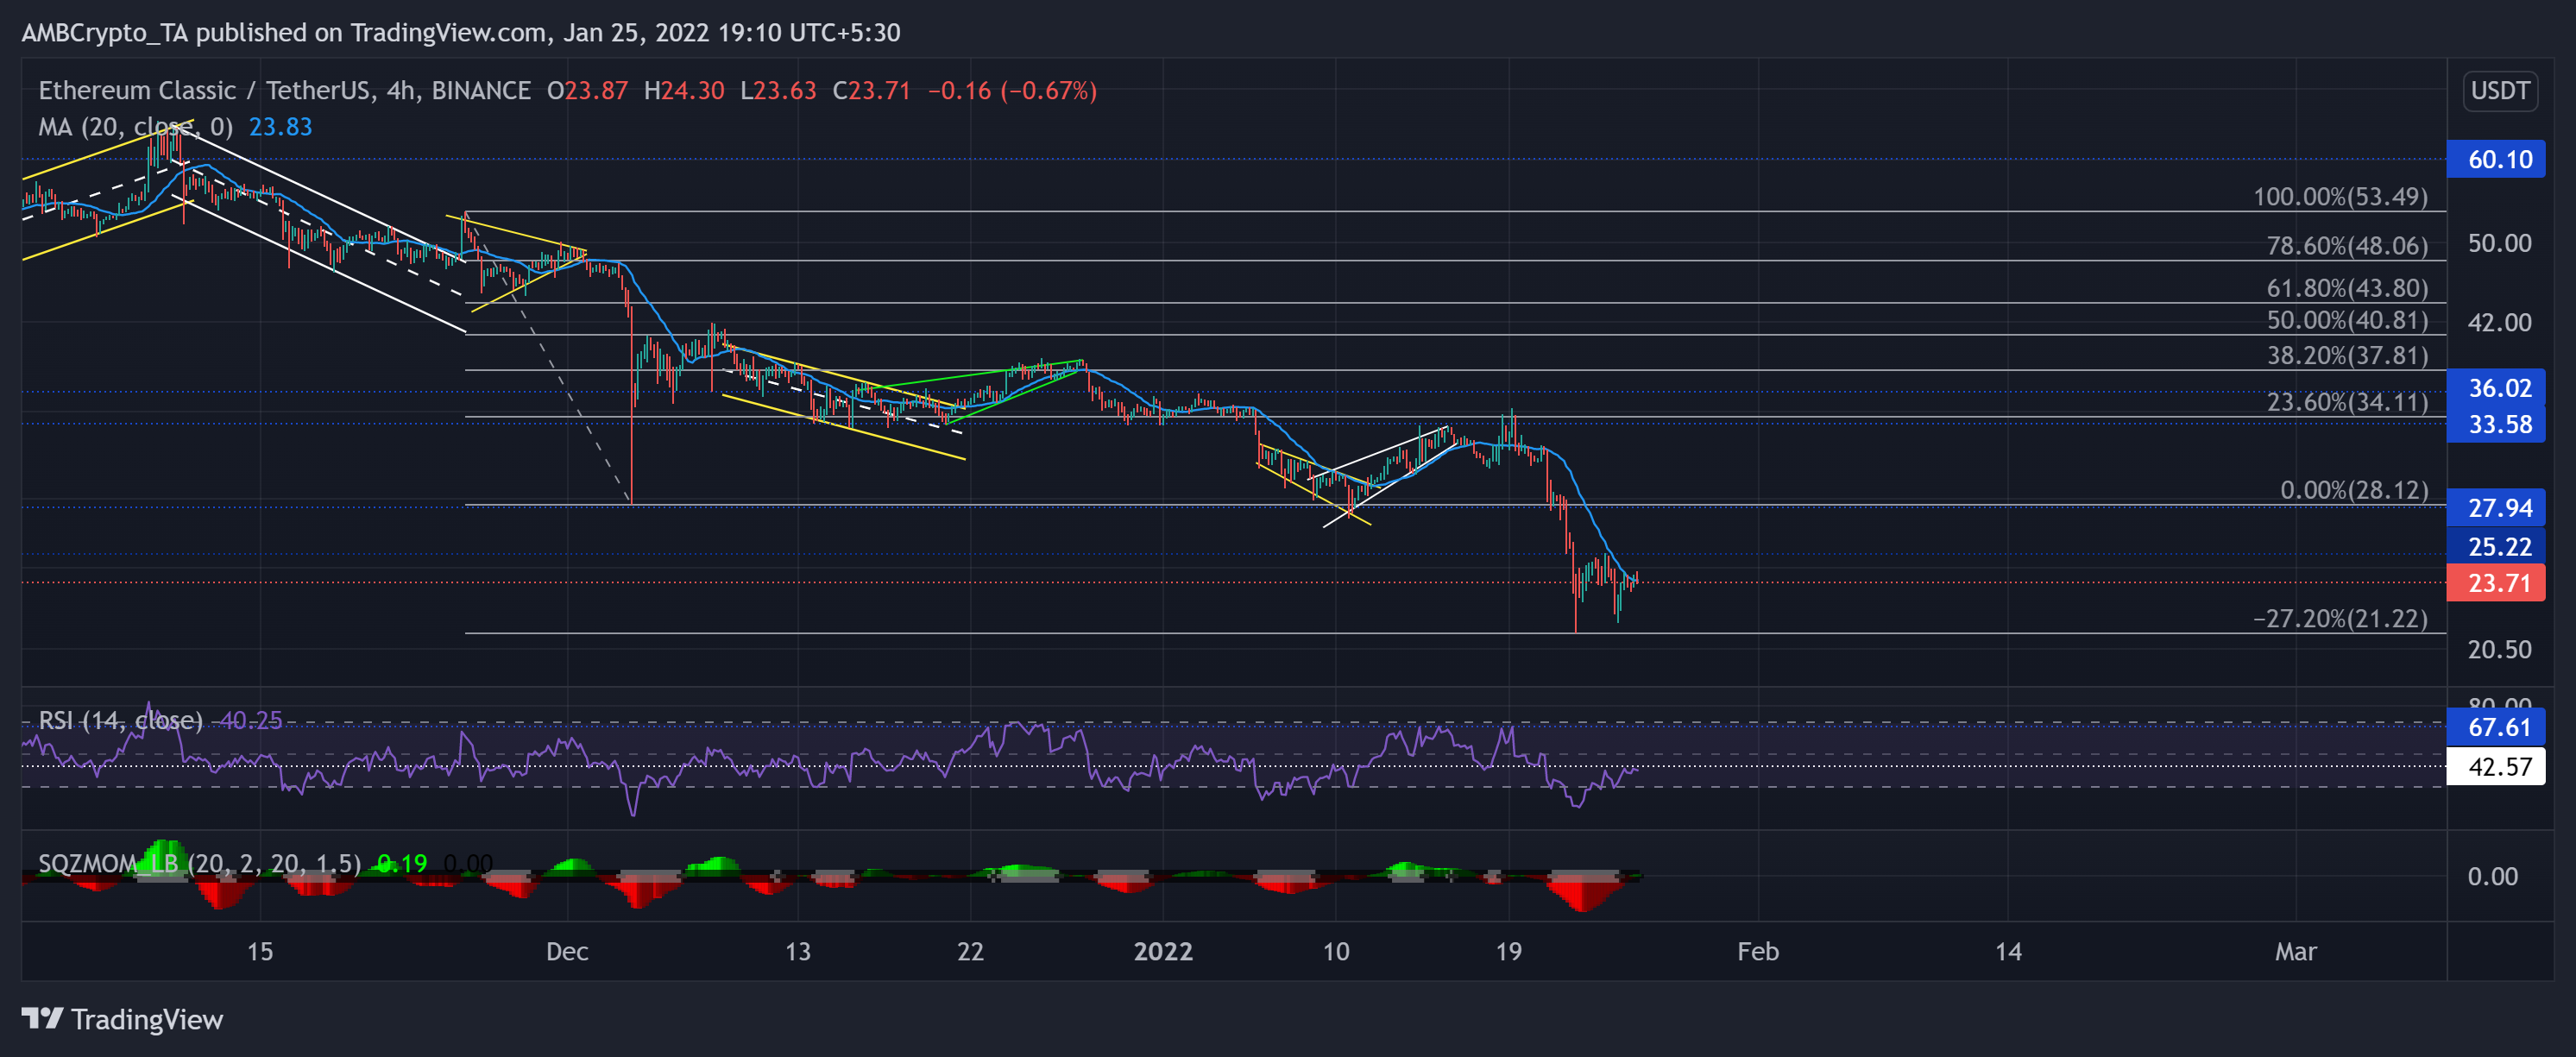
Source: TradingView, ETC/USDT
After losing its previous oscillation range, all the bullish revival attempts found resistance at the $33-mark near the 23.6% Fibonacci resistance. Then, as the sell-off phase initiated, ETC lost 39.98% (from 19 January high) until it hit its nine-month low on 22 January. From here on, the testing point for the bulls continued to stand near the 20-SMA (cyan), followed by the $25-mark.
At press time, ETC traded at $23.71. The RSI finally rose above the oversold territory. Now, crossing the 42-mark would be a barrier for ETC bulls. Further, the Squeeze Momentum Indicator flashed black dots, hinting at a low volatility phase.

![Cardano's [ADA] quiet month: Key numbers you need to know](https://ambcrypto.com/wp-content/uploads/2024/04/Cardano-1-400x240.png)


![Examining whether Uniswap [UNI] can gain 200% in 2024](https://ambcrypto.com/wp-content/uploads/2024/04/Uniswap-Featured-Image-400x240.webp)