Altcoin
Polkadot, Shiba Inu, CRV Price Analysis: 25 January
Bitcoin’s jump above its 4-hour 20 SMA over the past day seemed to pave the path for a possible recovery. Polkadot still needed to challenge the upper trendline of the down-channel to confirm a reversal.
On the flip side, Shiba Inu saw a symmetrical triangle while its near-term technicals displayed mixed signals.
Polkadot (DOT)
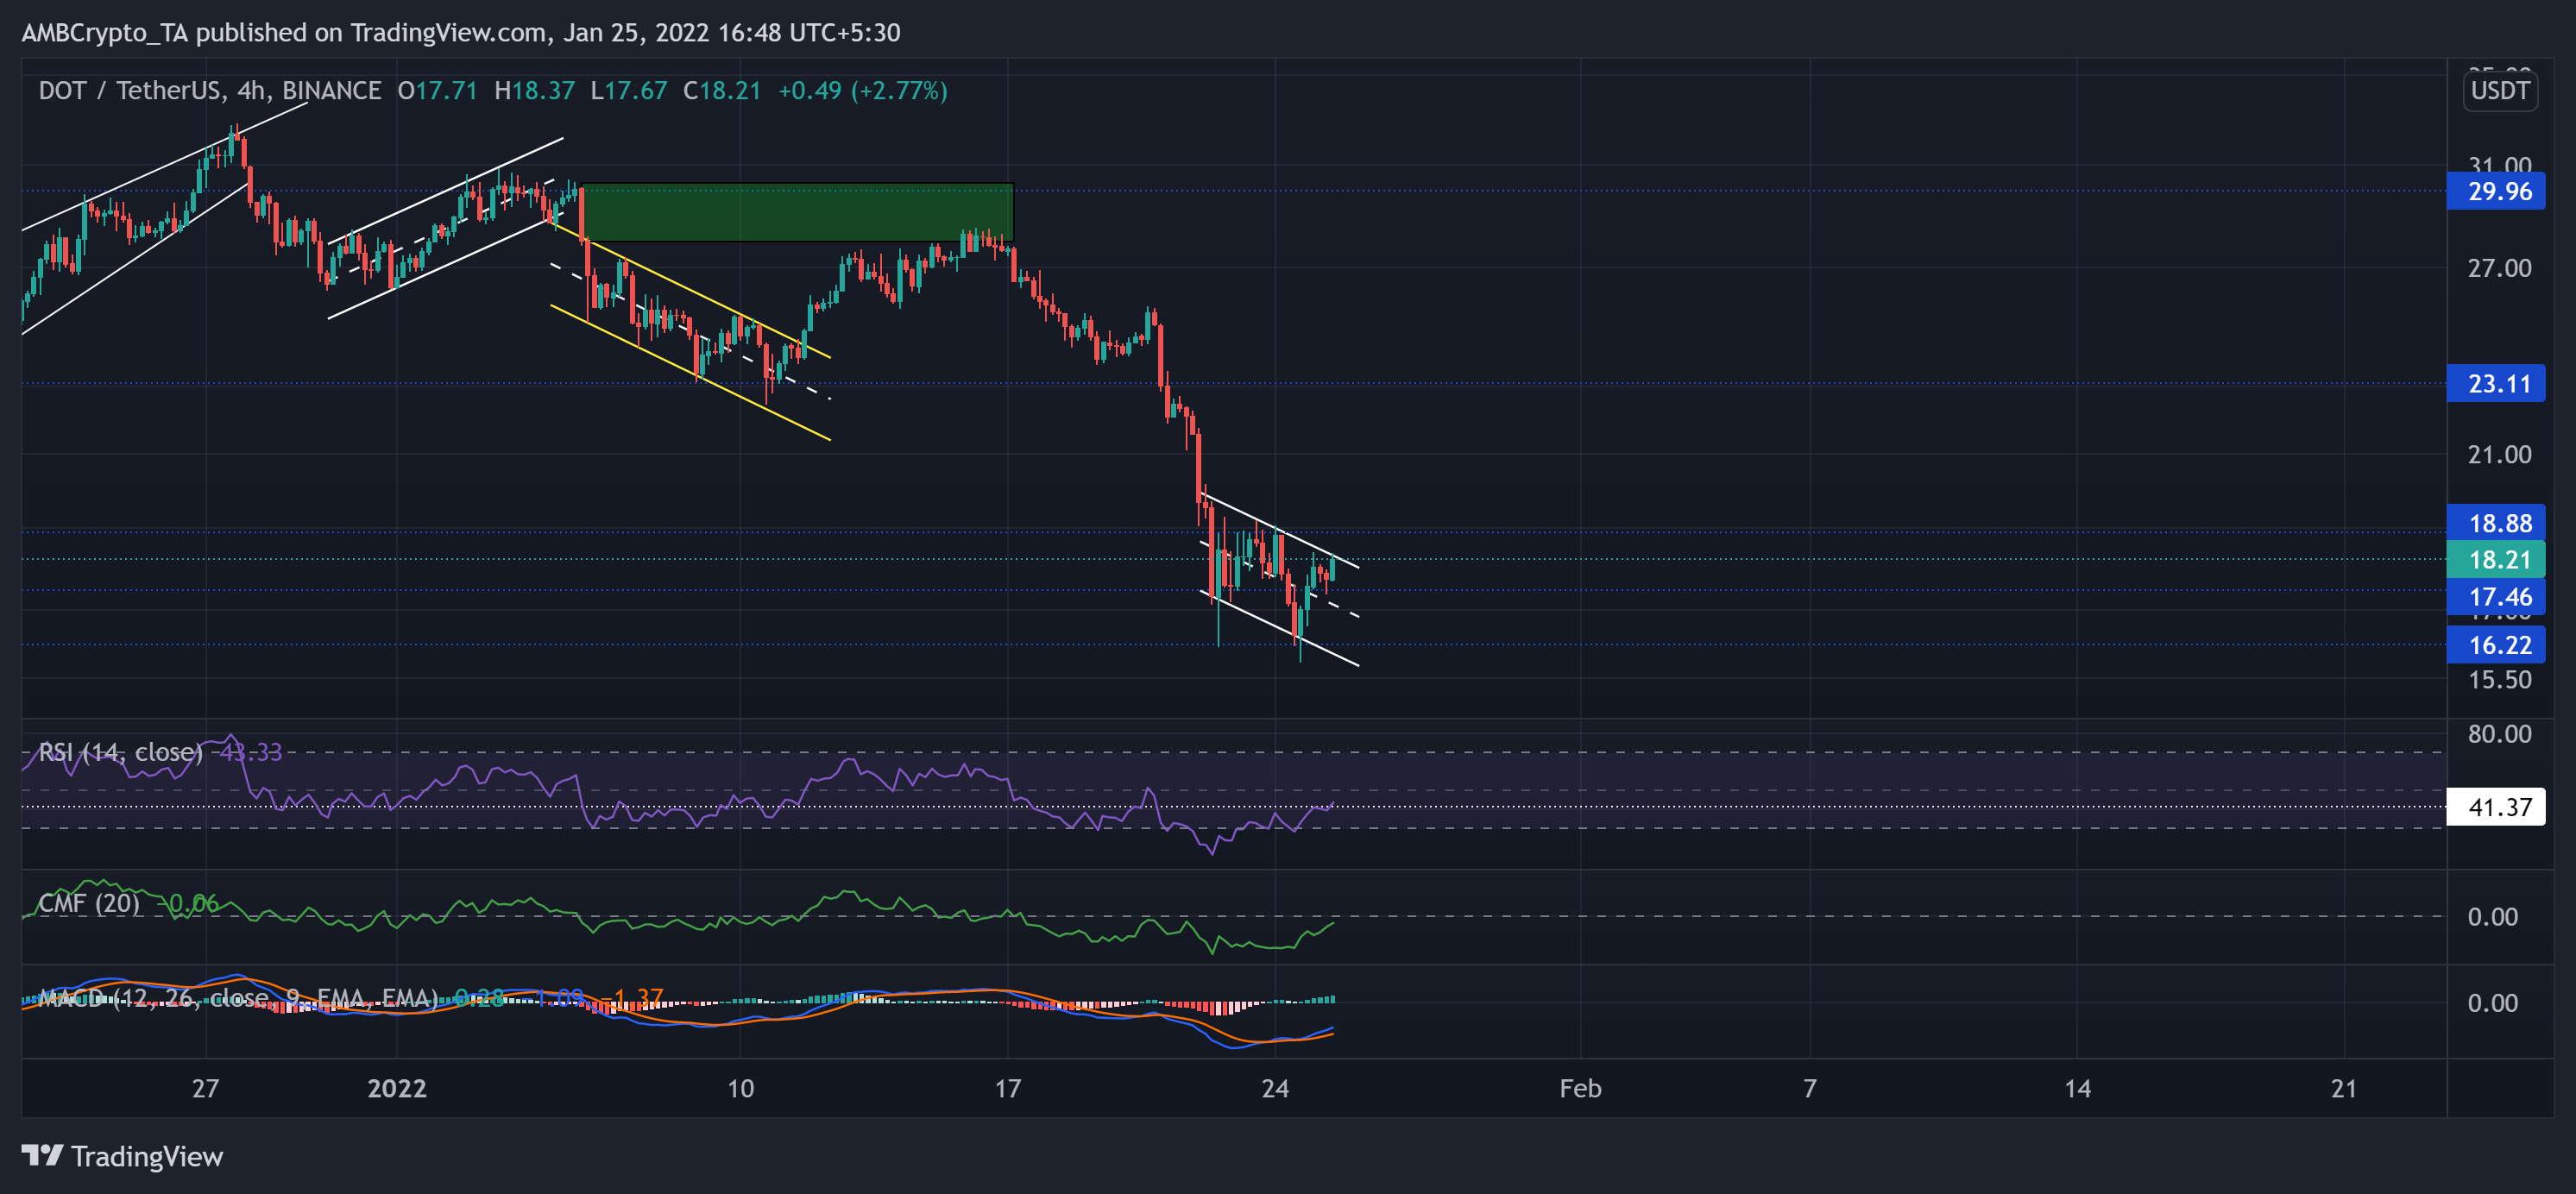
Source: TradingView, DOT/USDT
The alt has been on a slump for the past 11 weeks. After the sellers stepped in at the $29.96-mark, the 5 January sell-off formed a strong supply zone (rectangle, green) for DOT. Since then, the bears took over as they breached the $23.11-mark five-month support (now resistance).
The 21 January fallout triggered a 38.34% decline, while the alt rushed to touch its 25-week low on 24 January. Now, the immediate resistance stood at the upper trendline of the down-channel. And then at the $18.8-mark.
At press time, DOT traded at $18.21. The RSI stood at the 43-mark. After testing the oversold region, it showed a solid revival by breaching the 41-mark. Further, the CMF showed recovery but was yet to cross the half-line. Also, the MACD confirmed the previous analysis, but its histogram and lines pointed at decreasing selling pressure.
Shiba Inu (SHIB)

Source: TradingView, SHIB/USD
As the $0.00003255 resistance stood sturdy, the down-channel (white) breakout failed to enter into price discovery. Since then, the alt swayed below its 20 SMA (red). To top it up, the 21 January sell-off saw an over 39.94% retracement until SHIB nudged its 15-week low on 22 January.
Then, it saw a strong reversal rally after the buyers stepped in at the $0.00001864-level. Now, the meme token saw a symmetrical triangle (yellow) on its 4 -hour chart.
At press time, SHIB traded above its 20 SMA at $0.00002106. The RSI bounced back from the oversold region after touching its record low of 12.35. It revived by over 30 points in the past day but still struggled to cross the half-line. While the bulls initiated a recovery, the distance between the +DI and -DI reduced.
Curve DAO Token (CRV)
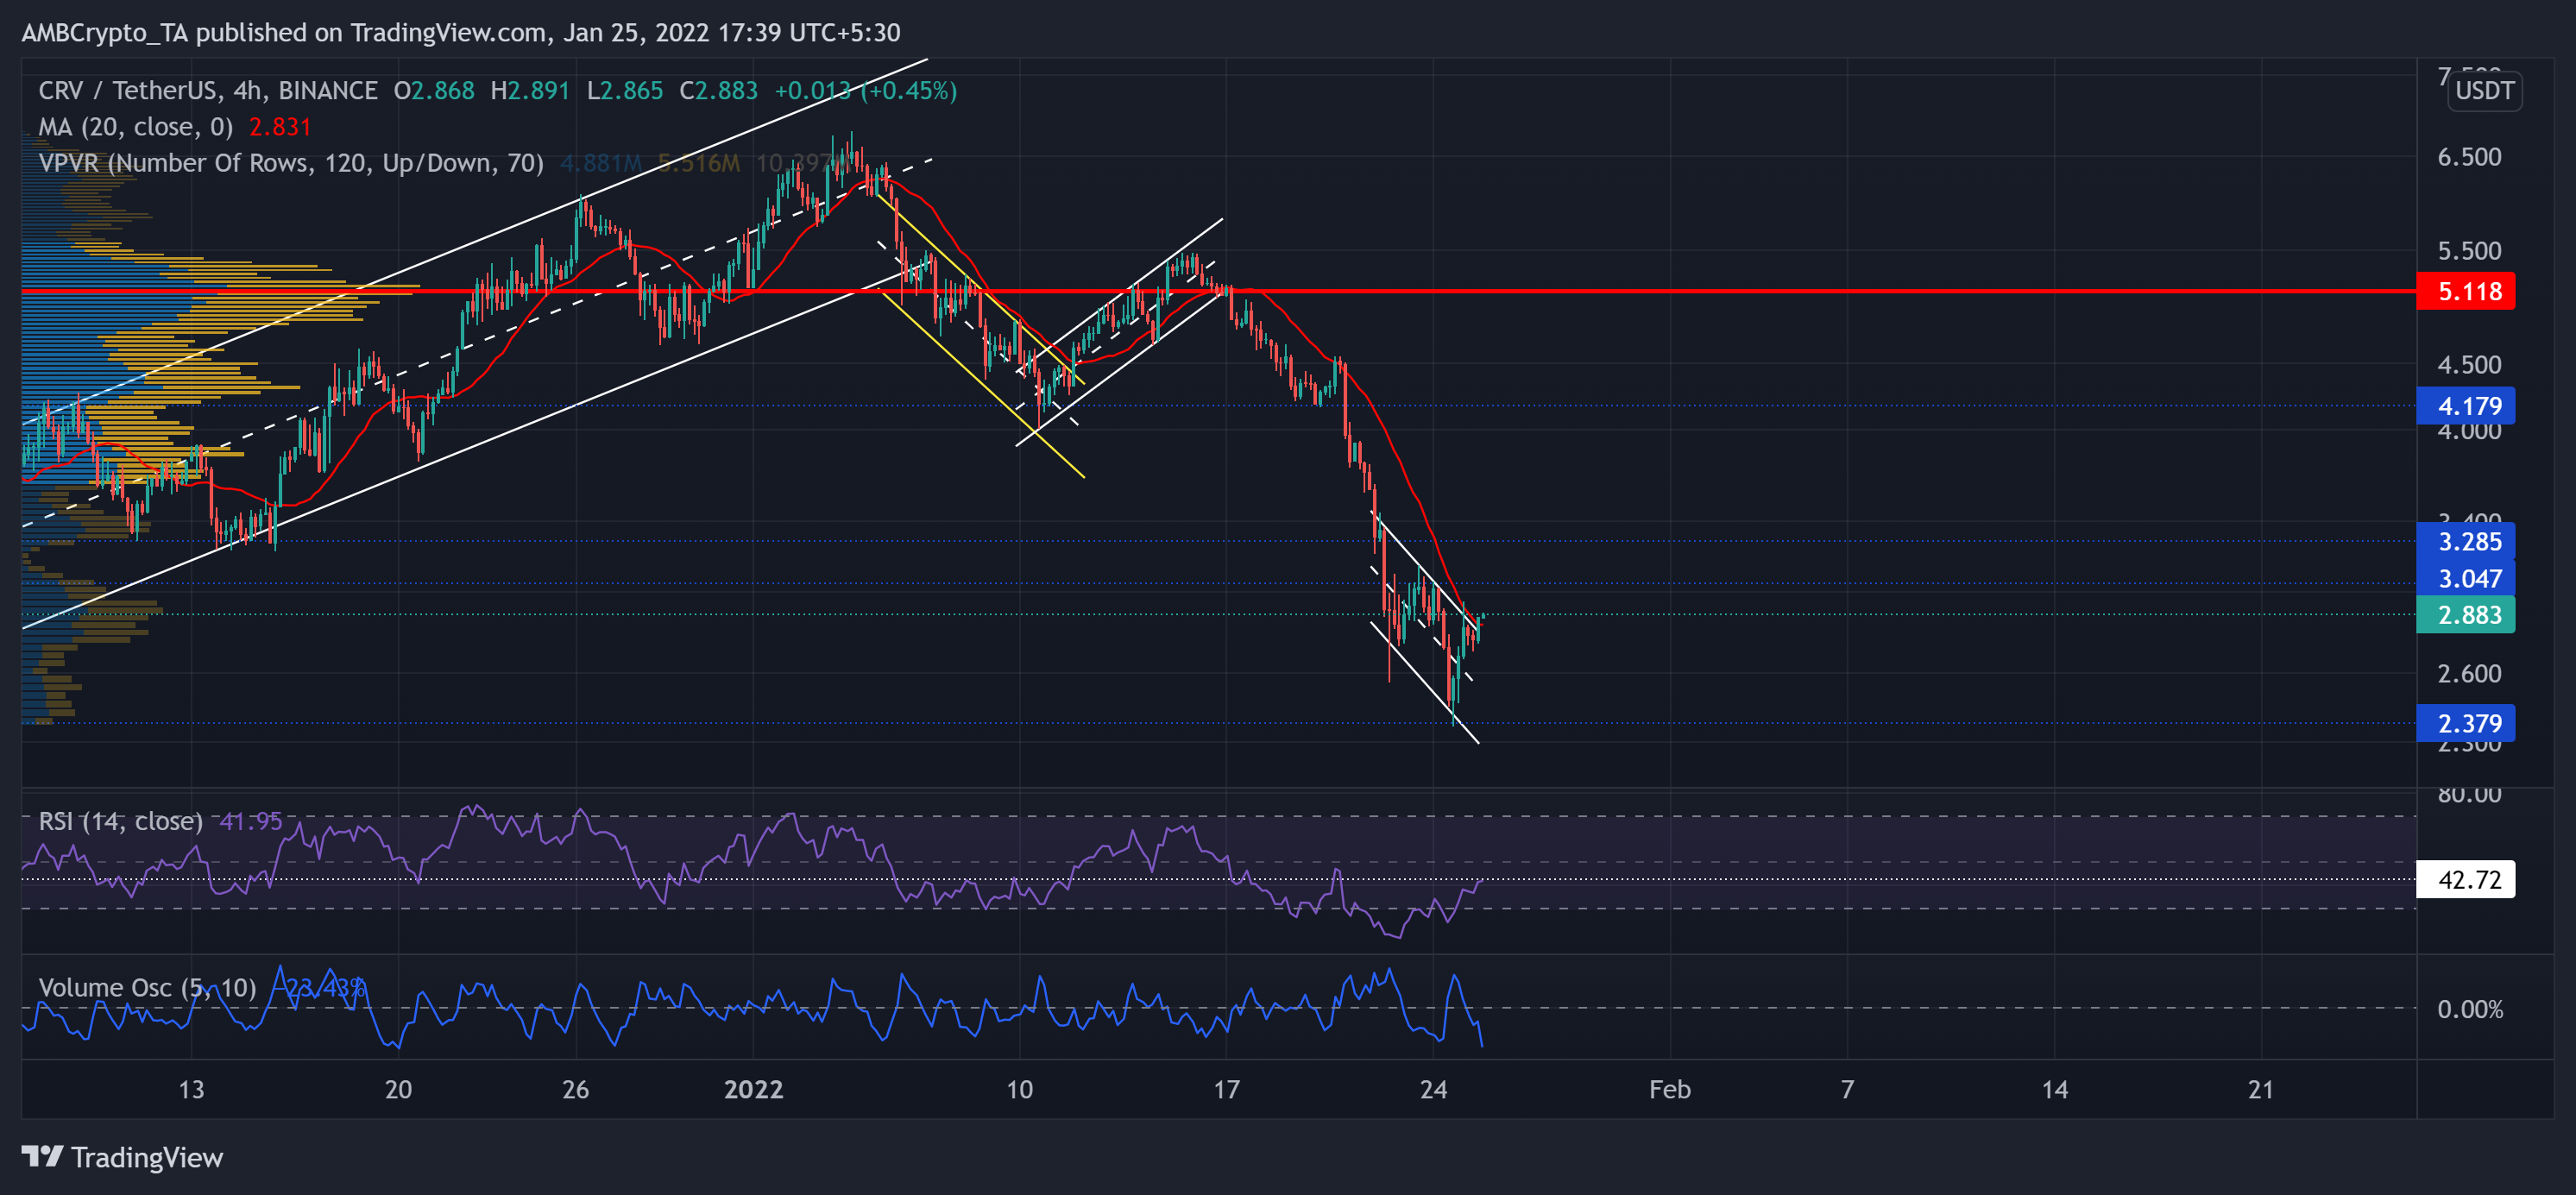
Source: TradingView, CRV/USDT
Since declining from its Point of Control (red), the sellers accelerated their vigor and breached the vital $4.17-mark. The recent fall marked a 47.4% retracement to touch its 16-week low on 24 January.
Over the past few days, it formed a down-channel (white) on its 4-hour chart. Now, as the price jumped above the 20 SMA (red) and broke out the pattern, the buying influence seemed to increase.
At press time, CRV traded at $2.883. The RSI saw an over 20 point surge in the last three days. But it needed to cross the 42-mark resistance to confirm a sustainable reversal. Also, we need to keep in mind that the Volume Oscillator was southbound during the recent breakout, hinting at a weak bull move.