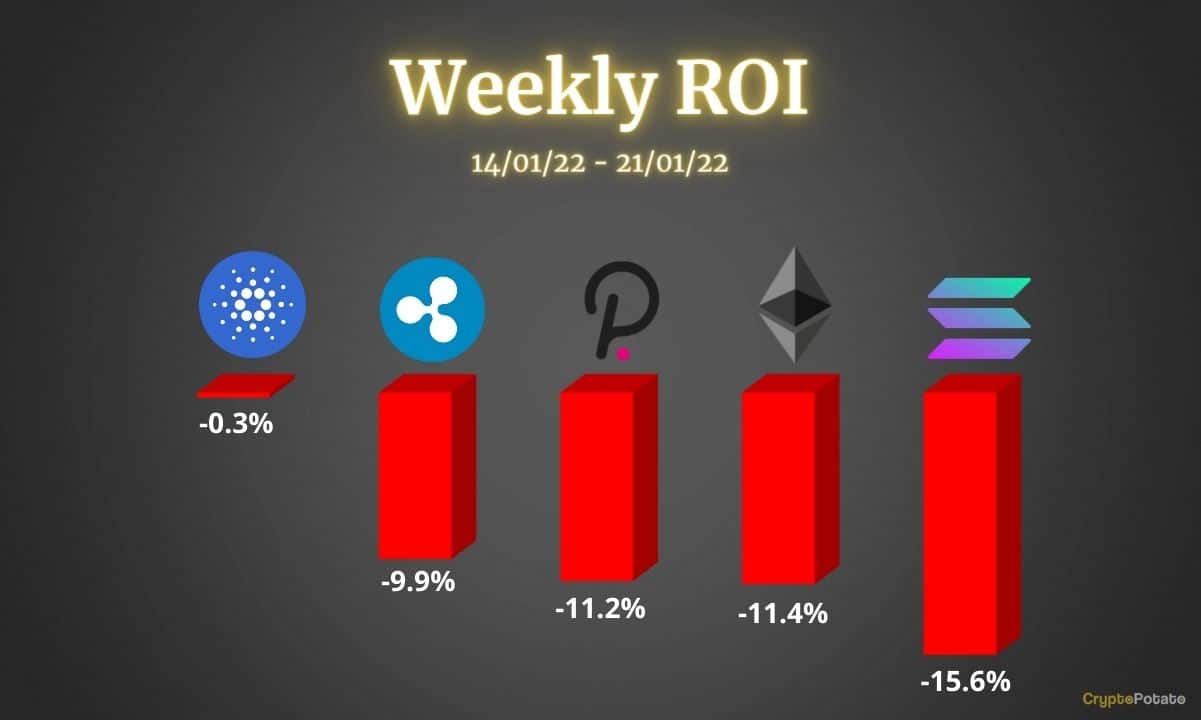
This week, we take a closer look at Ethereum, Ripple, Cardano, Solana, and Polkadot.
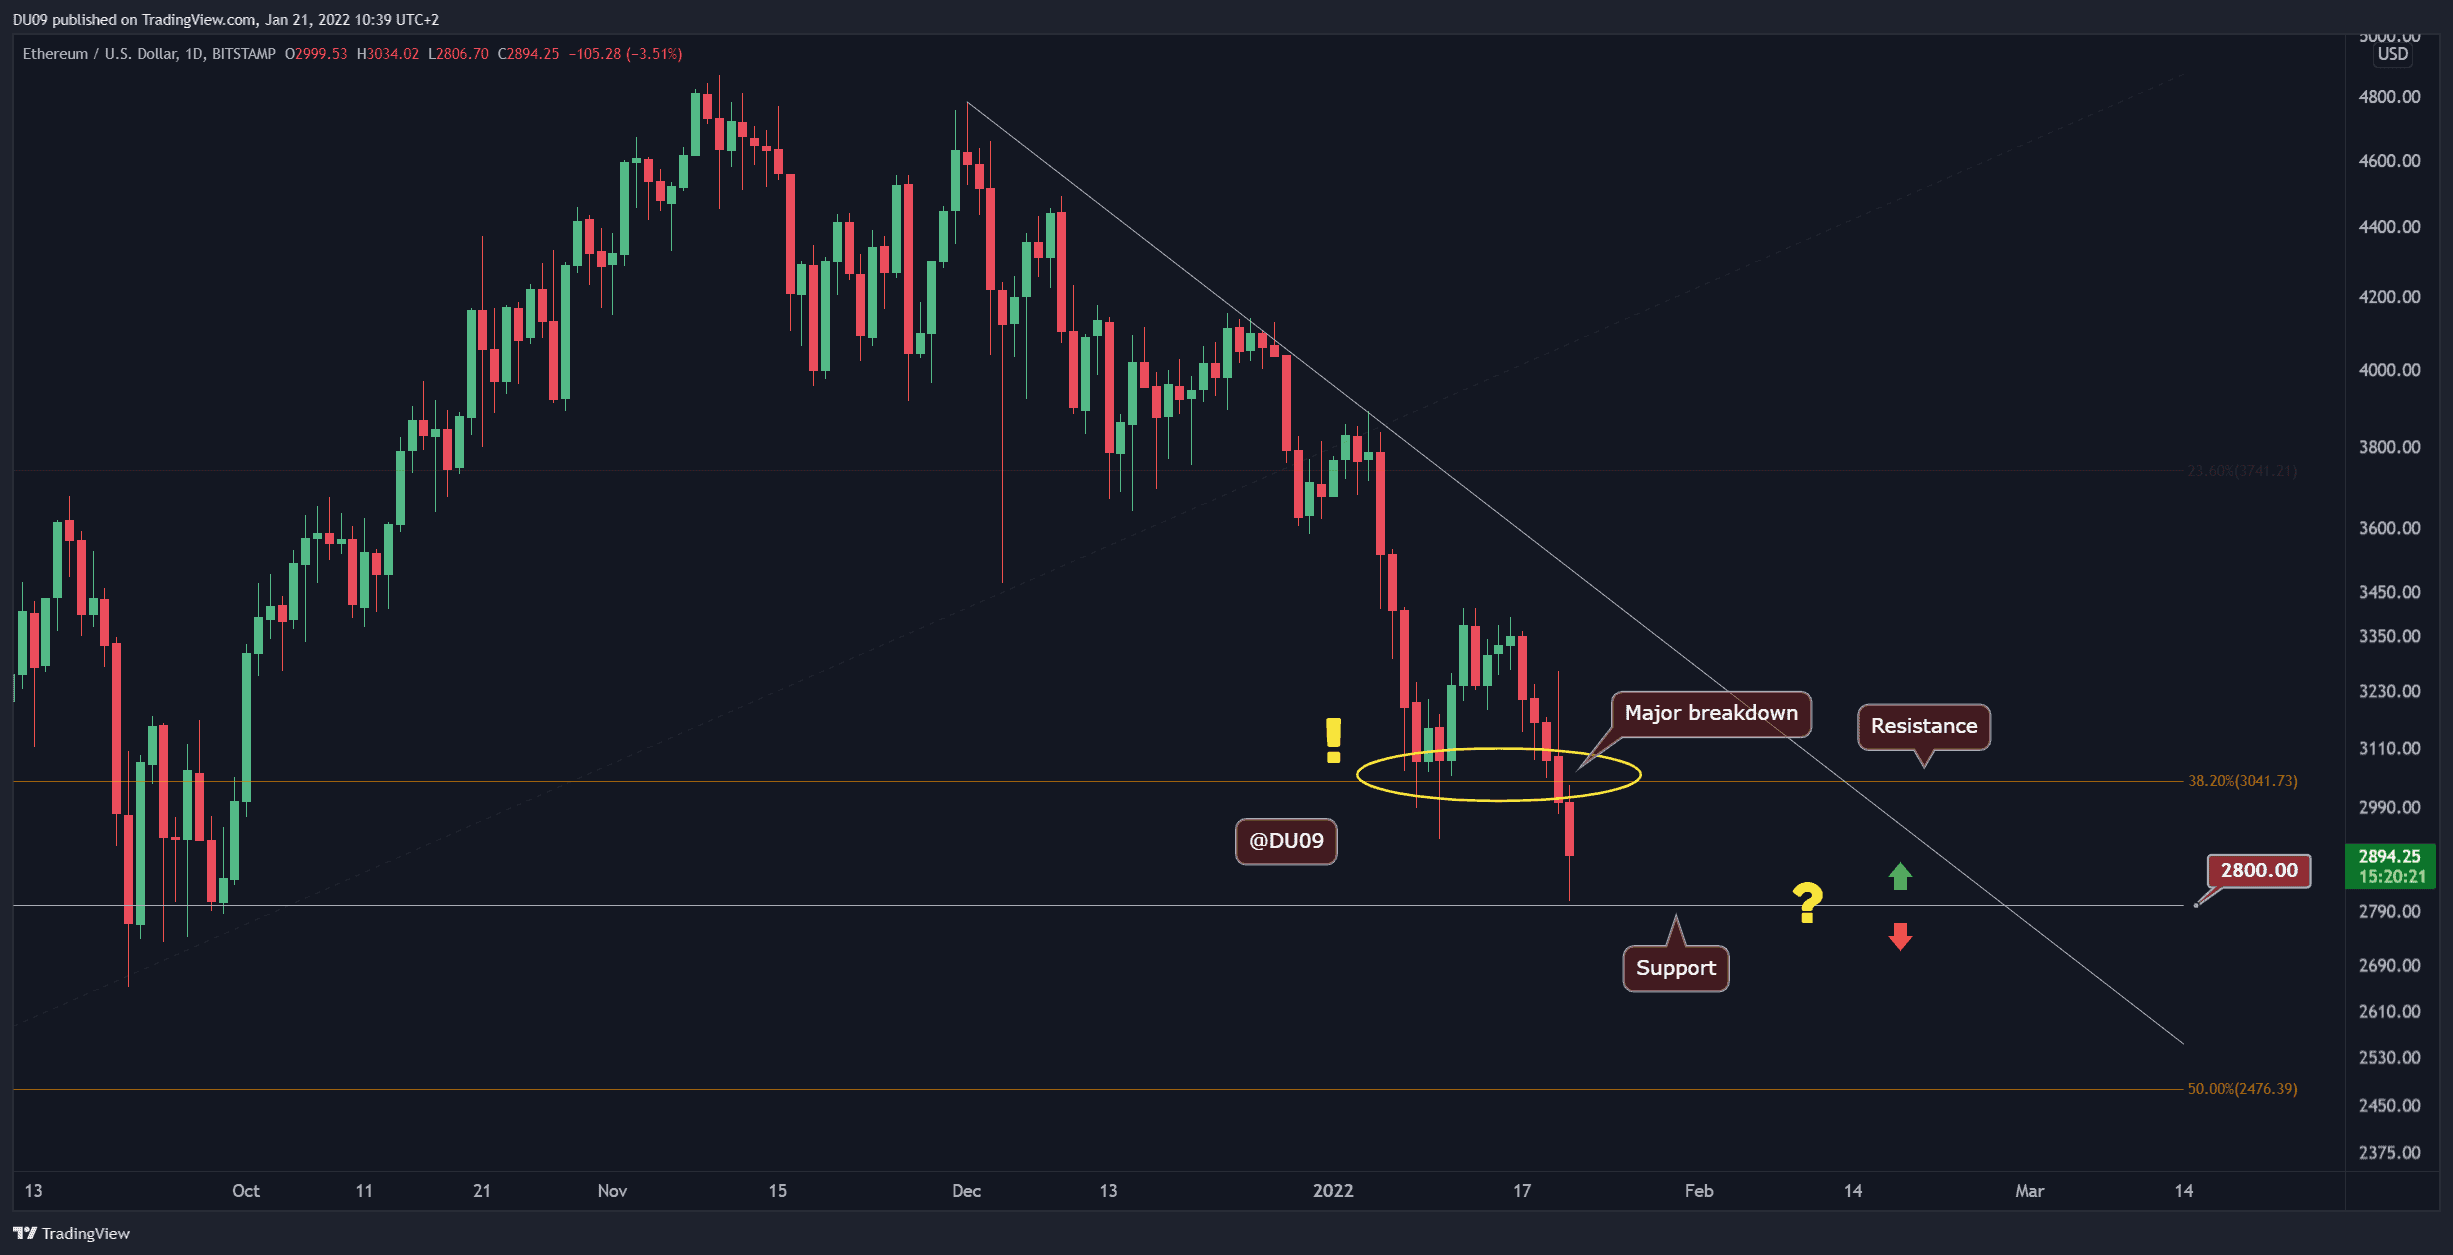
Last night, the significant market crash pushed ETH’s price under the critical support of $3,000, which will now act as resistance. Unfortunately, the loss of this crucial psychological level is a major blow to most market participants and sets the stage for ETH to potentially explore lower levels this year. Compared to seven days ago, ETH lost 11.4% of its dollar value.
The outlook on the market is very bearish, and one of the possible scenarios is for ETH’s price to rally and confirm the $3,000 level as resistance, after which the correction may continue. The current support is now found at $2,800 but appears weak.
Looking ahead, considering this latest breakdown in market structure, ETH has a good chance to fall lower in 2022. Targets such as $2,000 or below are now a very real possibility due to the current price action. The only way this can be avoided is if ETH reclaims the $3,000 level and turns it into support again.
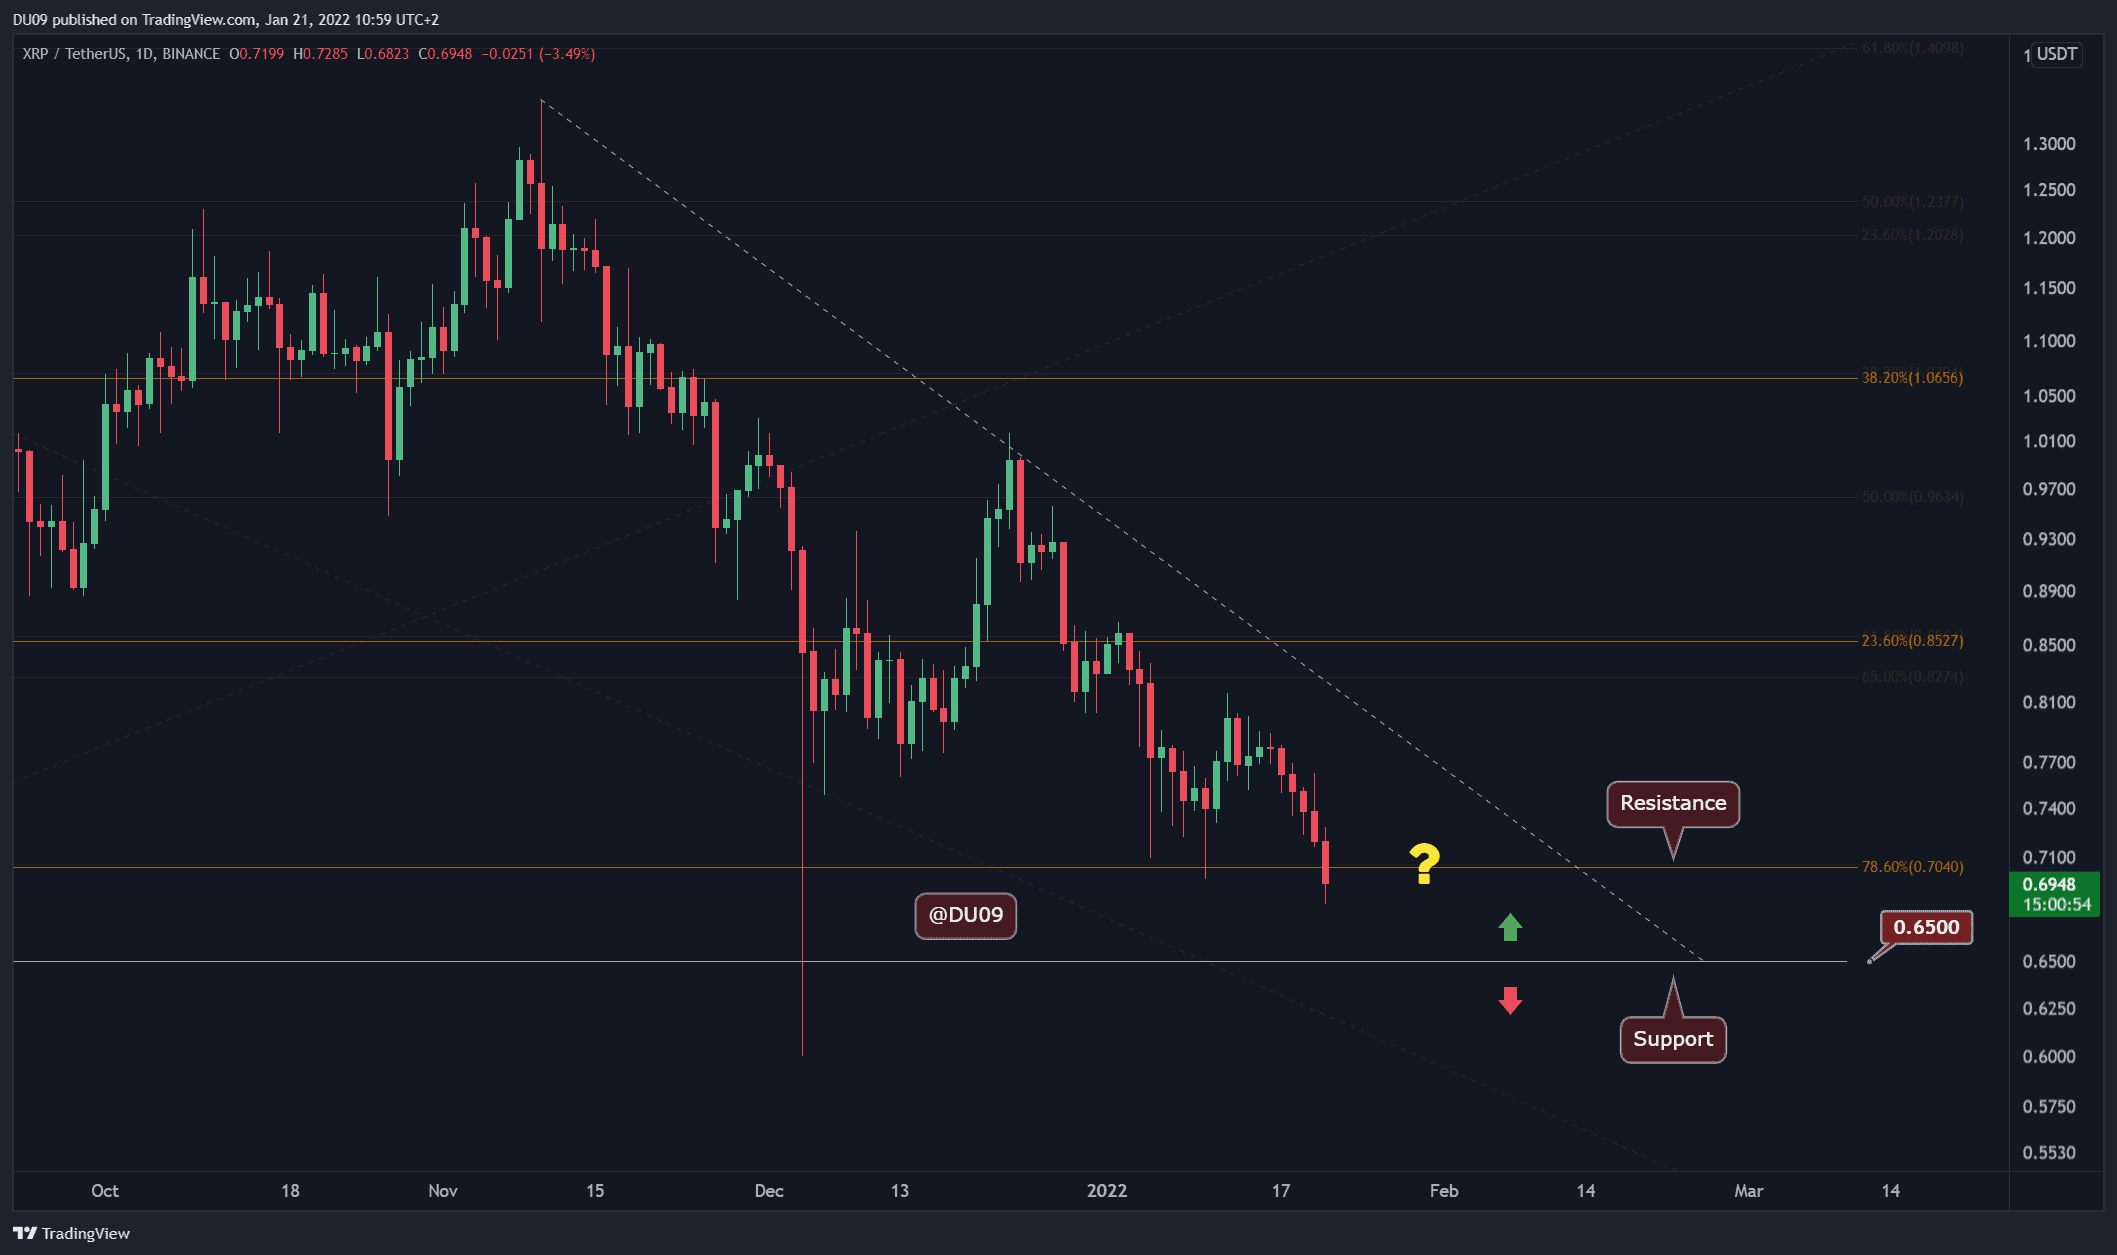
XRP did not fare better after last night, losing the key support at $0.70, which is now being contested between bulls and bears. Overall, the cryptocurrency lost 9.9% of its price in the past week. The next key support level is found at $0.65 and may provide a short relief if the decline continues.
What is interesting to note about the XRP price action is that the drop yesterday was quite shallow if we compare it to BTC or ETH. This signals that the market already considers XRP to be at a significant discount. This may, of course, change in the future if the market remains bearish, but the bears were not as aggressive in this case.
Earlier this week, XRP gave some bullish signals, such as the higher lows on RSI and bullish MACD. However, due to this last drop in price, those signals have now been invalidated.
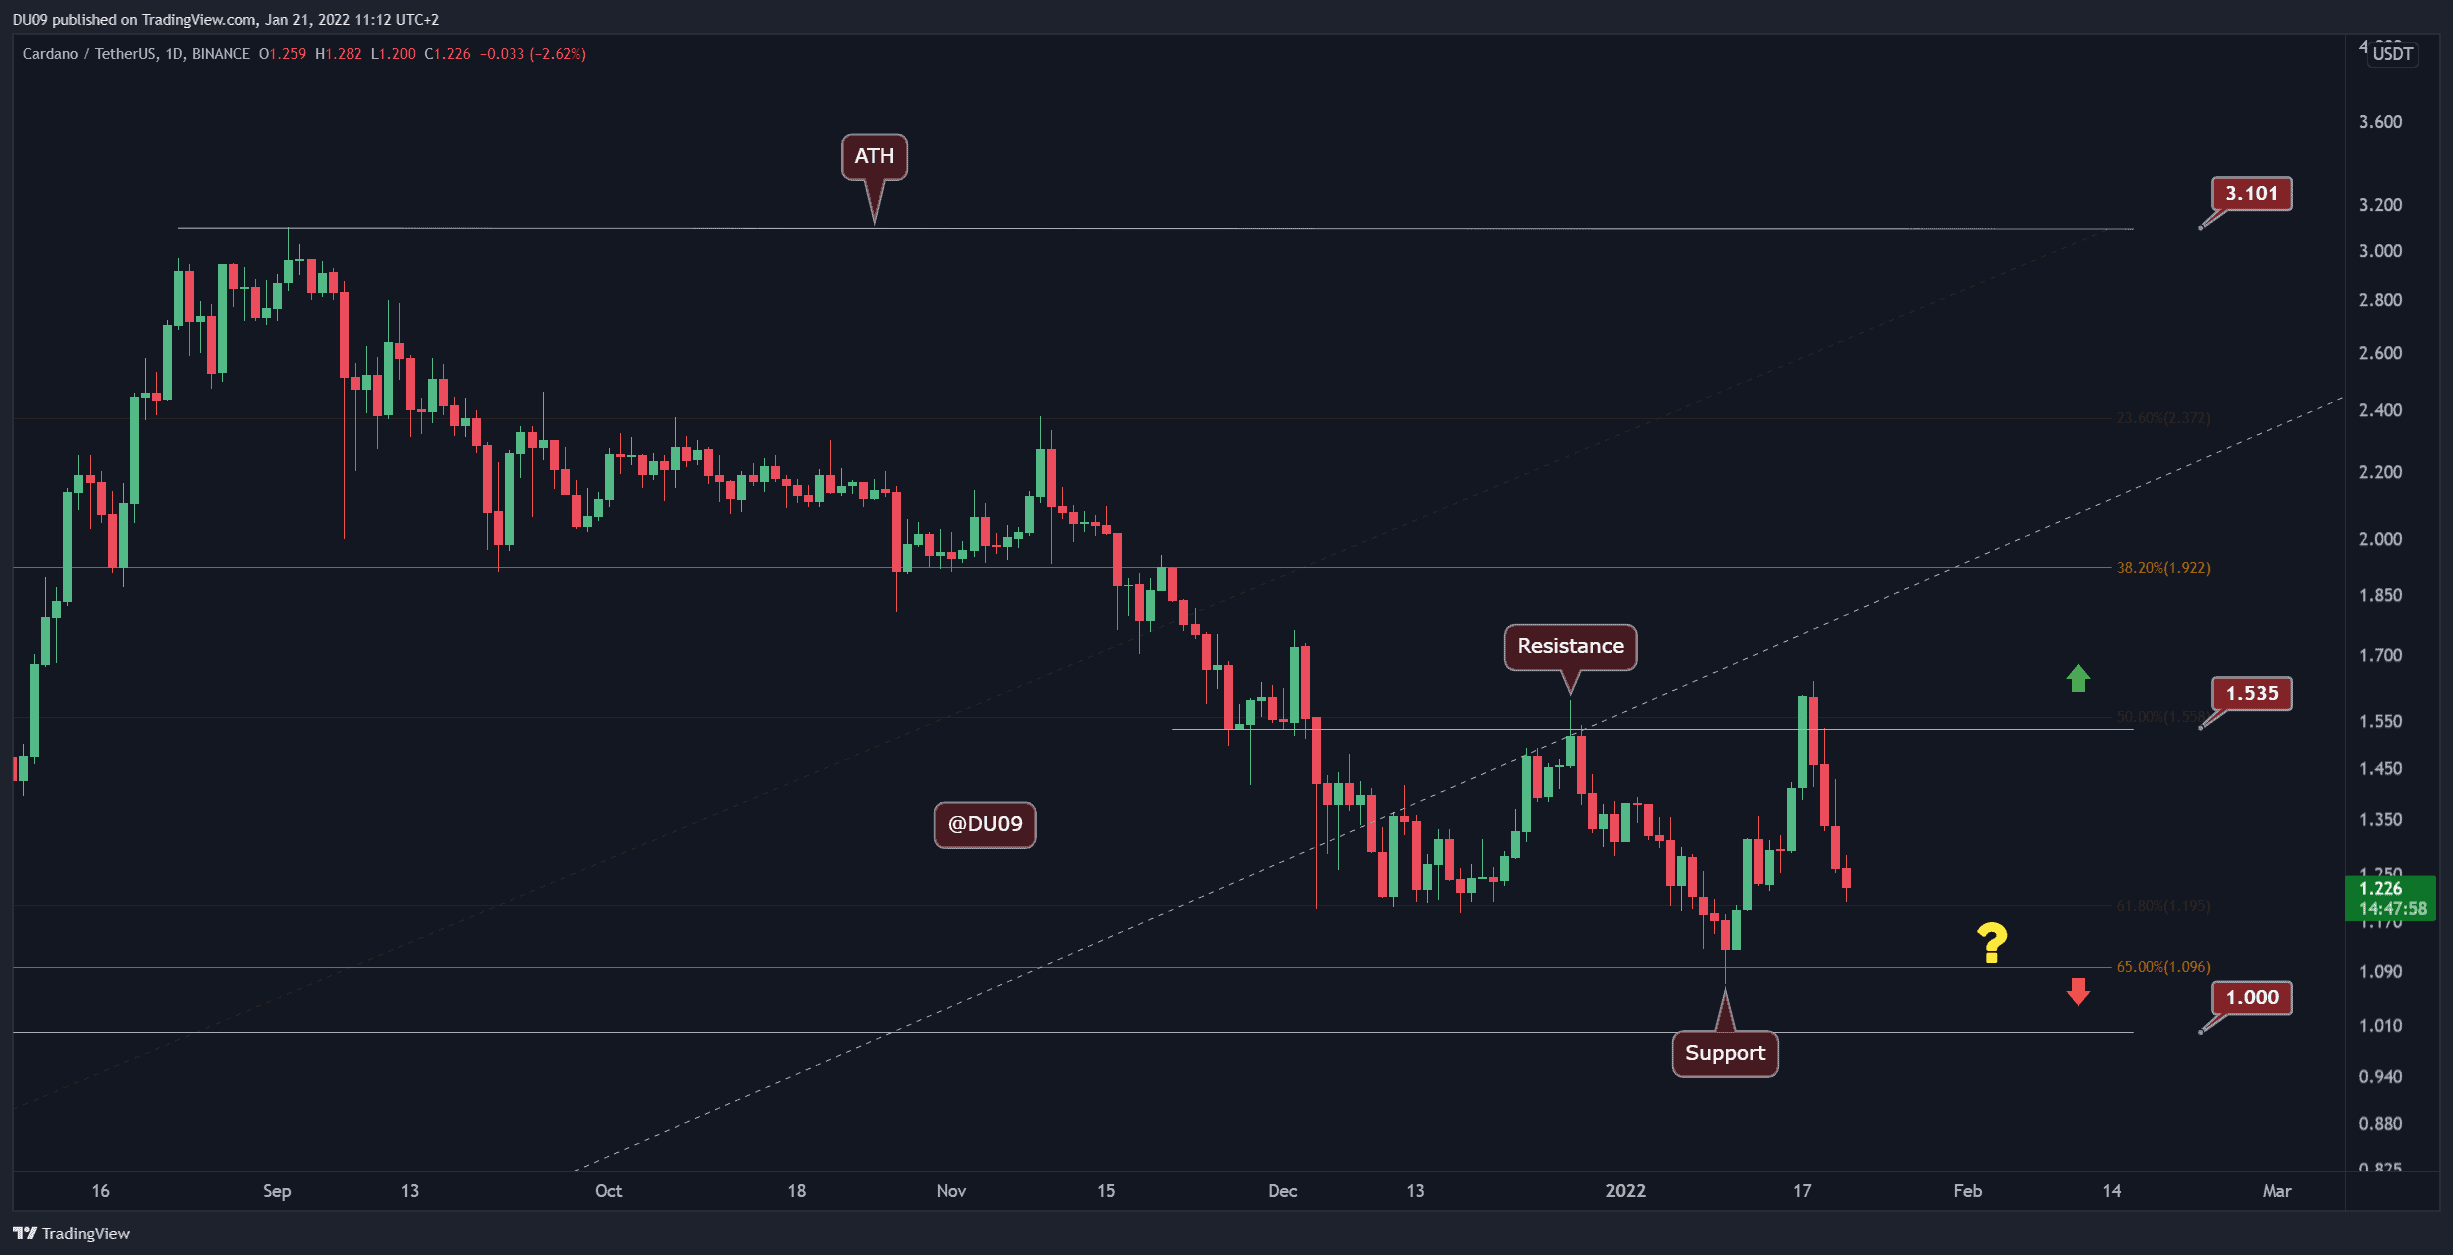
ADA’s price action this past week resembles a roller coaster with price volatility being off the charts. After it rallied to $1.6, the price dropped back to $1.2. These are swings exceeding 30% in a few days. The key support just above $1 has not been tested during this most recent drop, but it did push ADA to erase most of its recent gains. Overall, the cryptocurrency is back where it was last week.
The resistance above $1.5 will likely not be tested any time soon considering current market conditions and the indicators on ADA are quickly turning bearish. It would be interesting to see how it performs in the coming week if the market remains bearish.
Looking ahead, Cardano just saw the release of its first decentralized automated market maker called SundaeSwap, which seems to have had a very difficult rollout with transactions stuck and huge slippage. The creators warned that they may face bottlenecks on the network, but this does not seem to bode well for ADA holders.
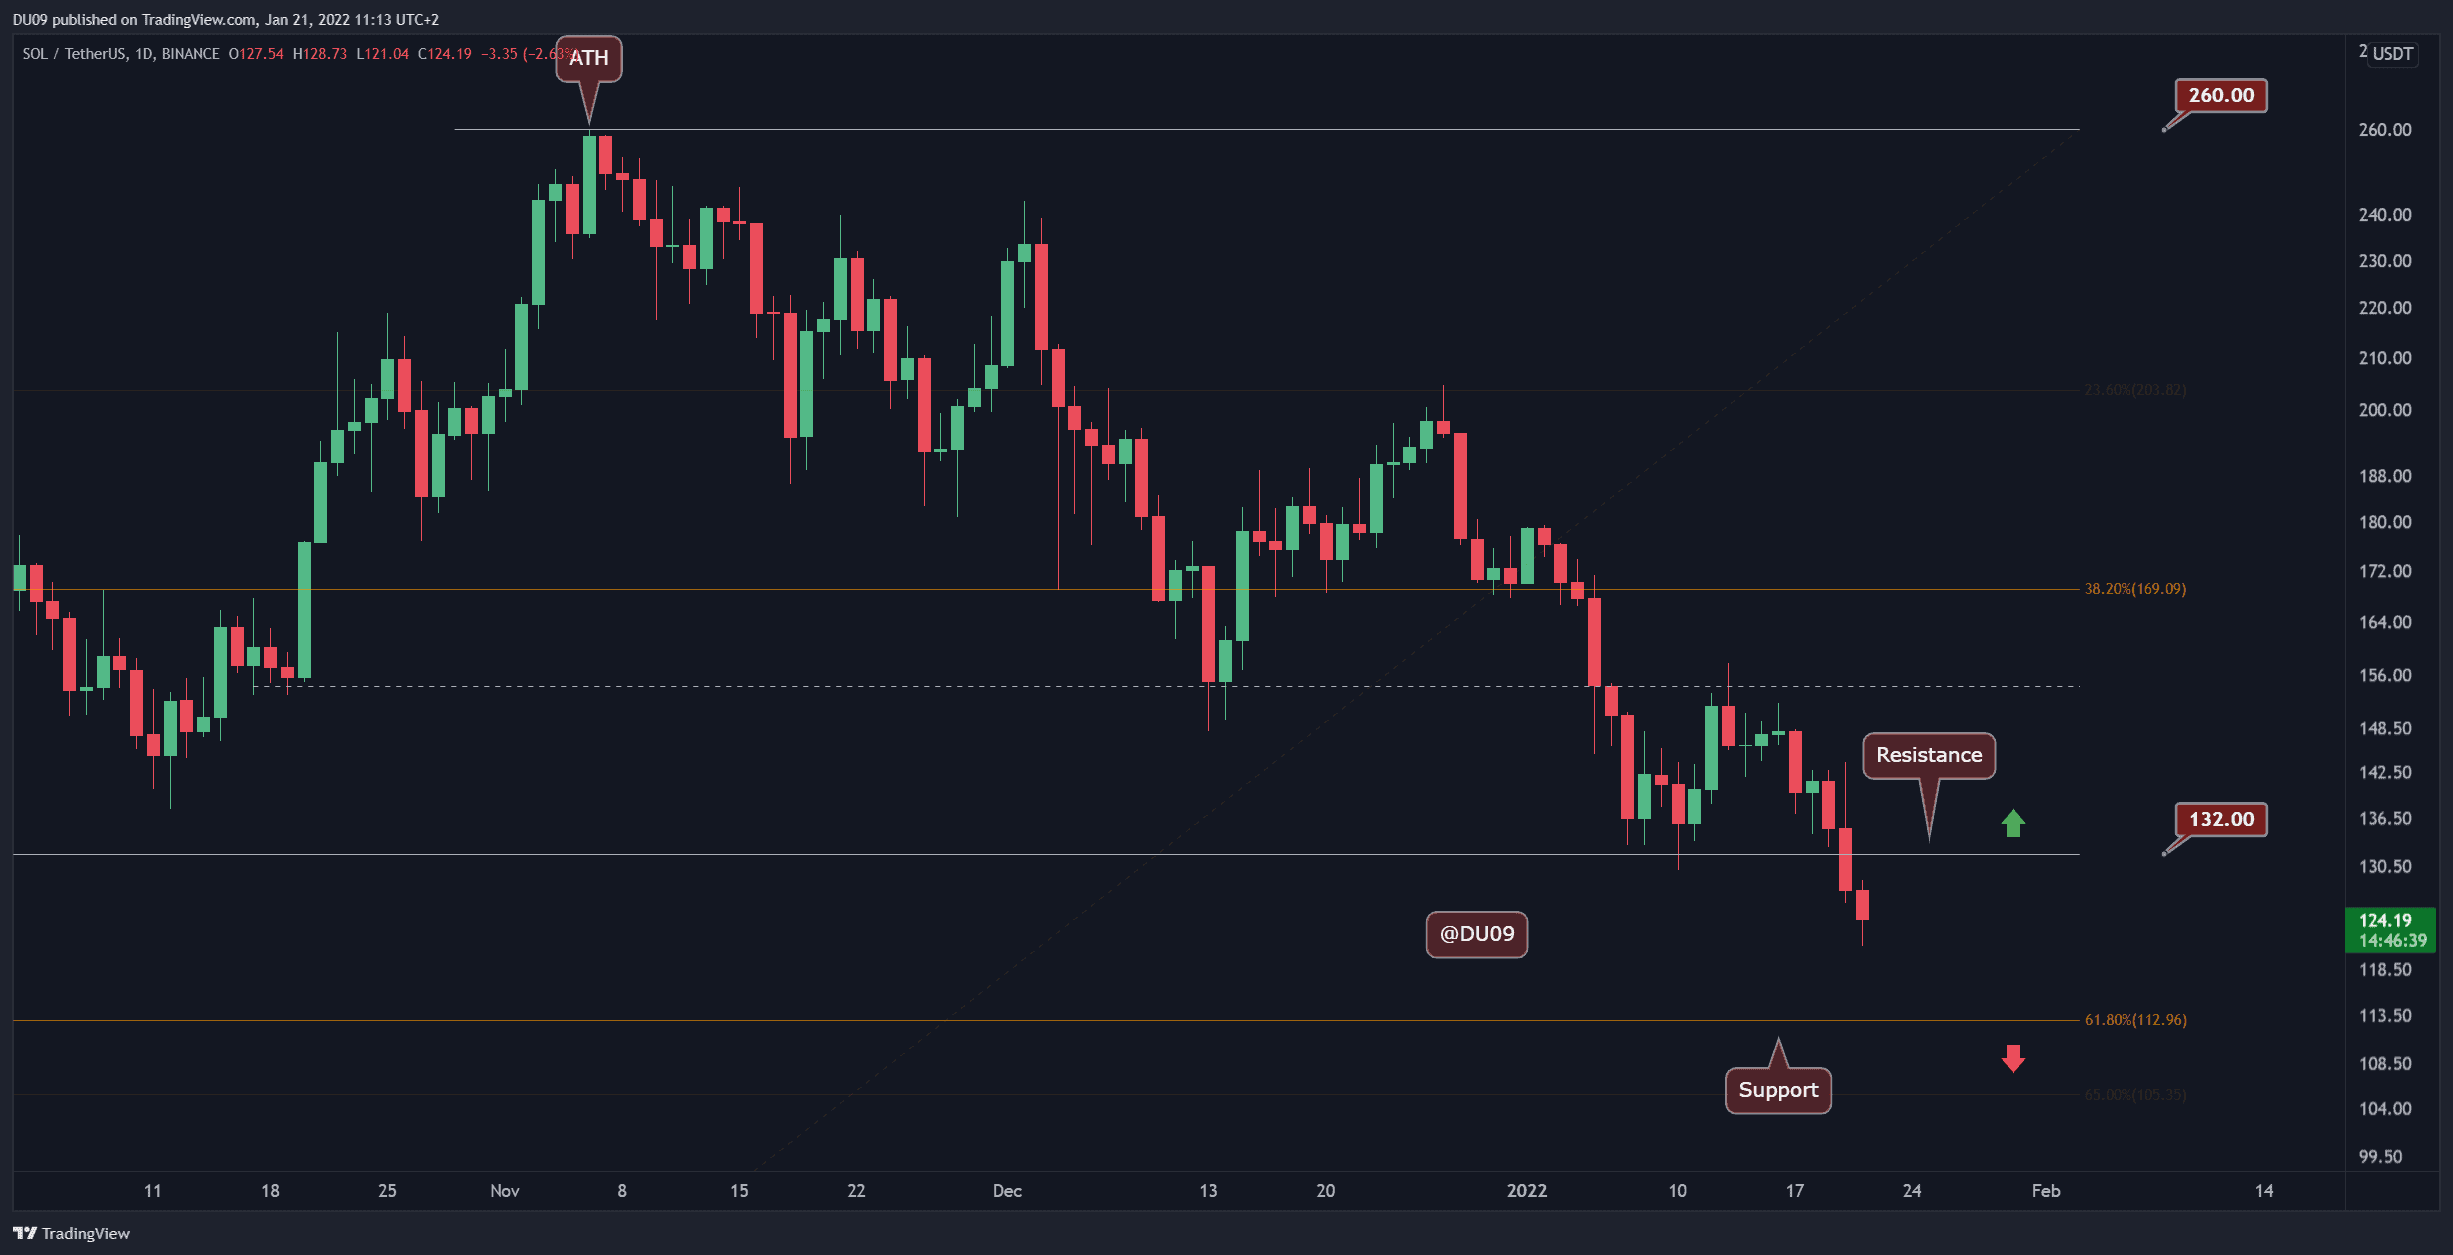
Yesterday night, SOL broke below the key support at $132, and the decline has temporarily stopped at the $120 level. However, this breakdown signals that SOL may fall to the next key support in the next few days found at $113.
The previous support has turned into resistance, and unless SOL moves above $132, it seems unlikely that this downtrend will end anytime soon. Overall, SOL had a terrible week, losing 15.6% of its value.
With this latest crash, the RSI has entered the oversold area (<30 points) on the daily timeframe, and the MACD did a bearish crossover. These are key signals that the bears have full control of the price action.
The overall picture for SOL is bleak, and the question is if it will manage to maintain a price level above $100. A failure there will signal a much deeper correction for SOL in 2022.
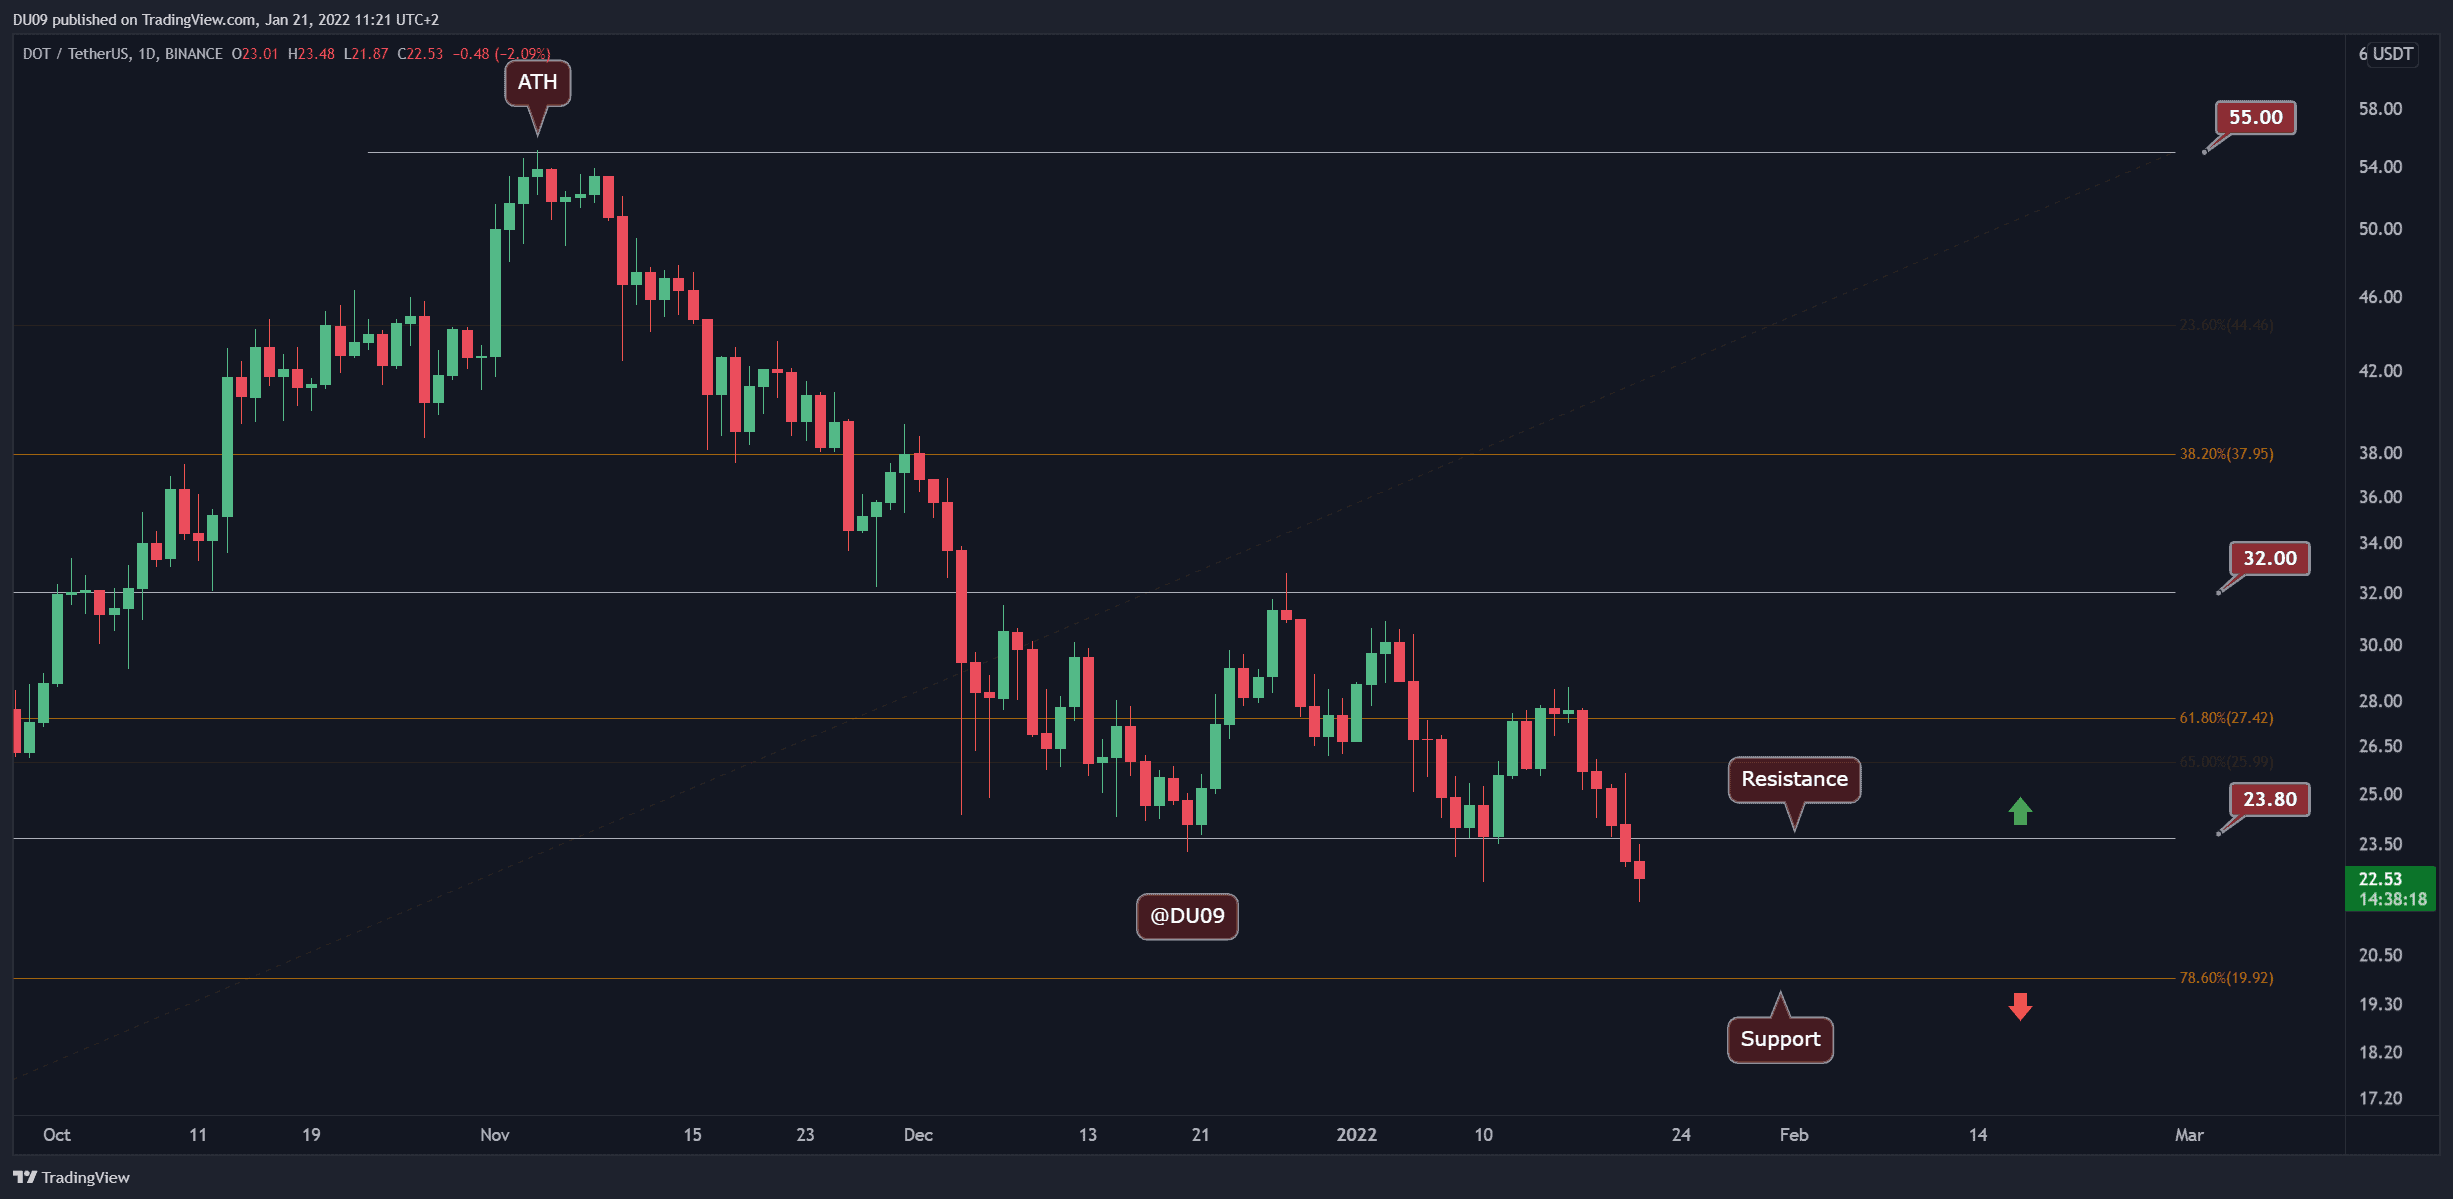
DOT also lost its key support at $24, ending a long consolidation period within a large price range ($24 – $32) that started in December 2021. Now, the price appears set to test the next key support level at $20. Due to this most recent price action, DOT has lost 11.2% of its valuation in a week.
The resistance is found at $24, as former support levels turn into resistance during an indecisive market. The indicators also continue to signal a bearish price action.
The coming week may see a general bounce across the market, and DOT may retest the $24 level. It is, however, important to keep an eye on the bigger picture and not be lured into potential traps.