Altcoin
Avalanche, Stellar, AAVE Price Analysis: 20 January
Correlating with the market sentiment, altcoins like Avalanche, Stellar and AAVE exhibited a bearish inclination. Avalanche fell below all its EMA ribbons. Although its RSI recovered, it needed to ramp up its volumes to confirm a strong bull move.
Stellar and AAVE were still on the bearish bandwagon while their CMF’s still try to keep up the hope for investors.
Avalanche (AVAX)
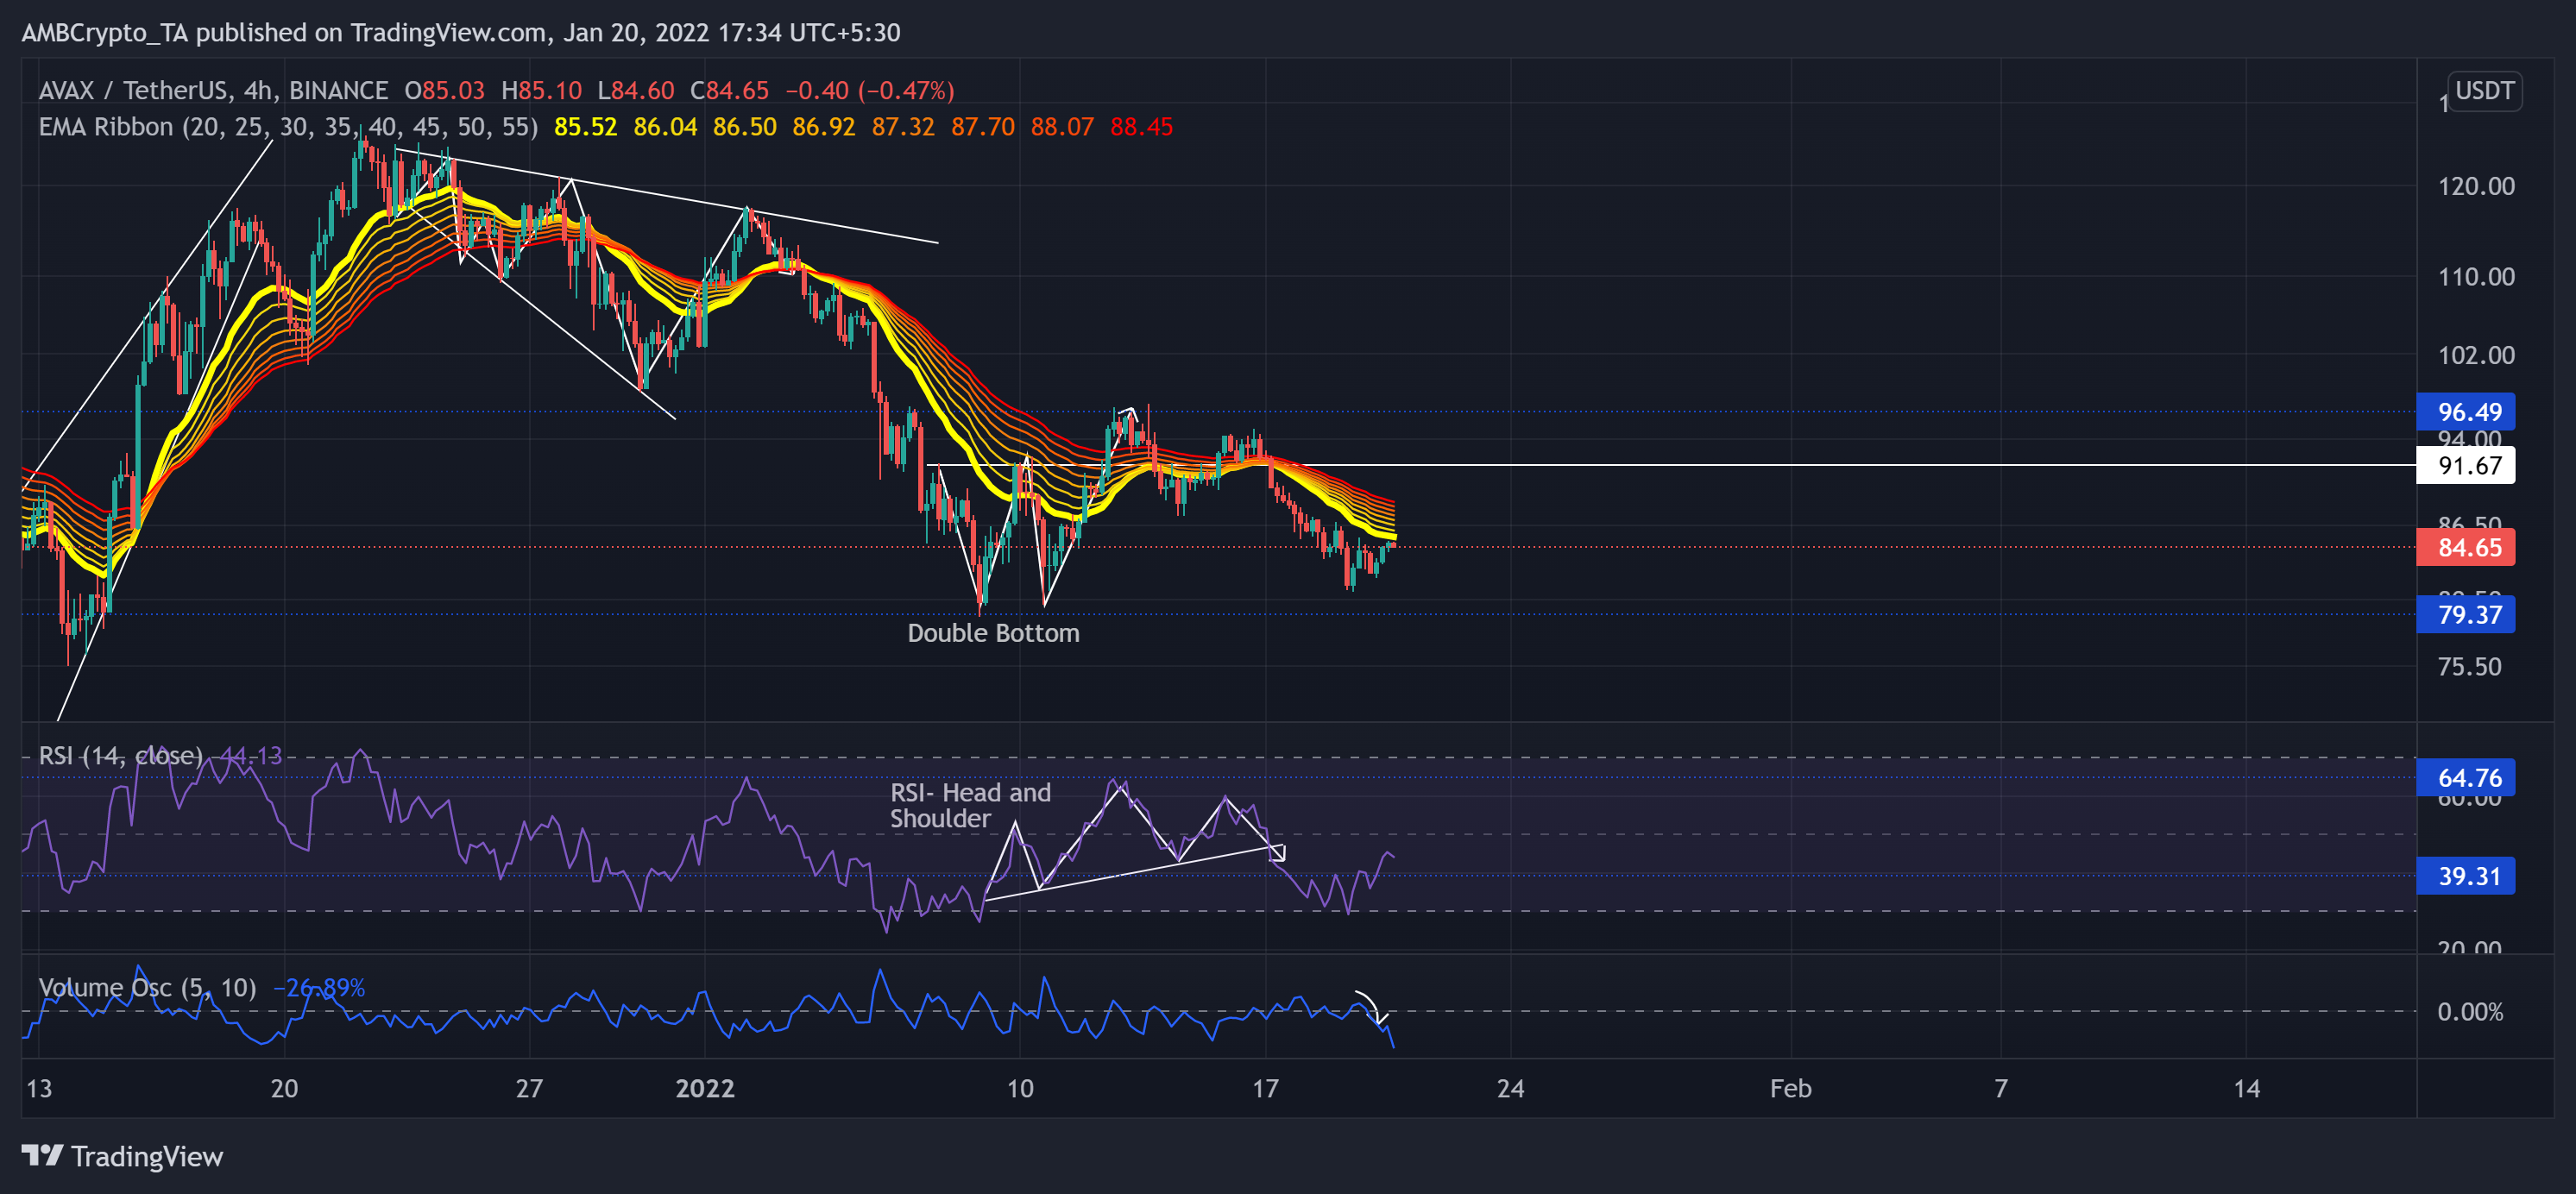
Source: TradingView, AVAX/USDT
AVAX saw a 37.58% retracement (since 22 December) and tested the $79.3-support twice in the last 12 days. The double-bottom breakout on its 4-hour chart failed to cross its month-long resistance at the $96.49-mark.
Over the last week, AVAX lost nearly 12.2% of its value. As a result, it fell below all its EMA ribbons while the selling influence heightened. Now, the 20-EMA stood as an immediate hurdle for the bulls to conquer.
At press time, the altcoin was trading at $84.65. After confirming the head and shoulder pattern, the 4-hour RSI tested the oversold region. over the past day, the RSI surged by nearly 15 points and snapped off the 39-mark. However, it becomes vital to take note of the dip by the Volume Oscillator. It depicted weak trading volumes and a rather weak bull move.
Stellar (XLM)
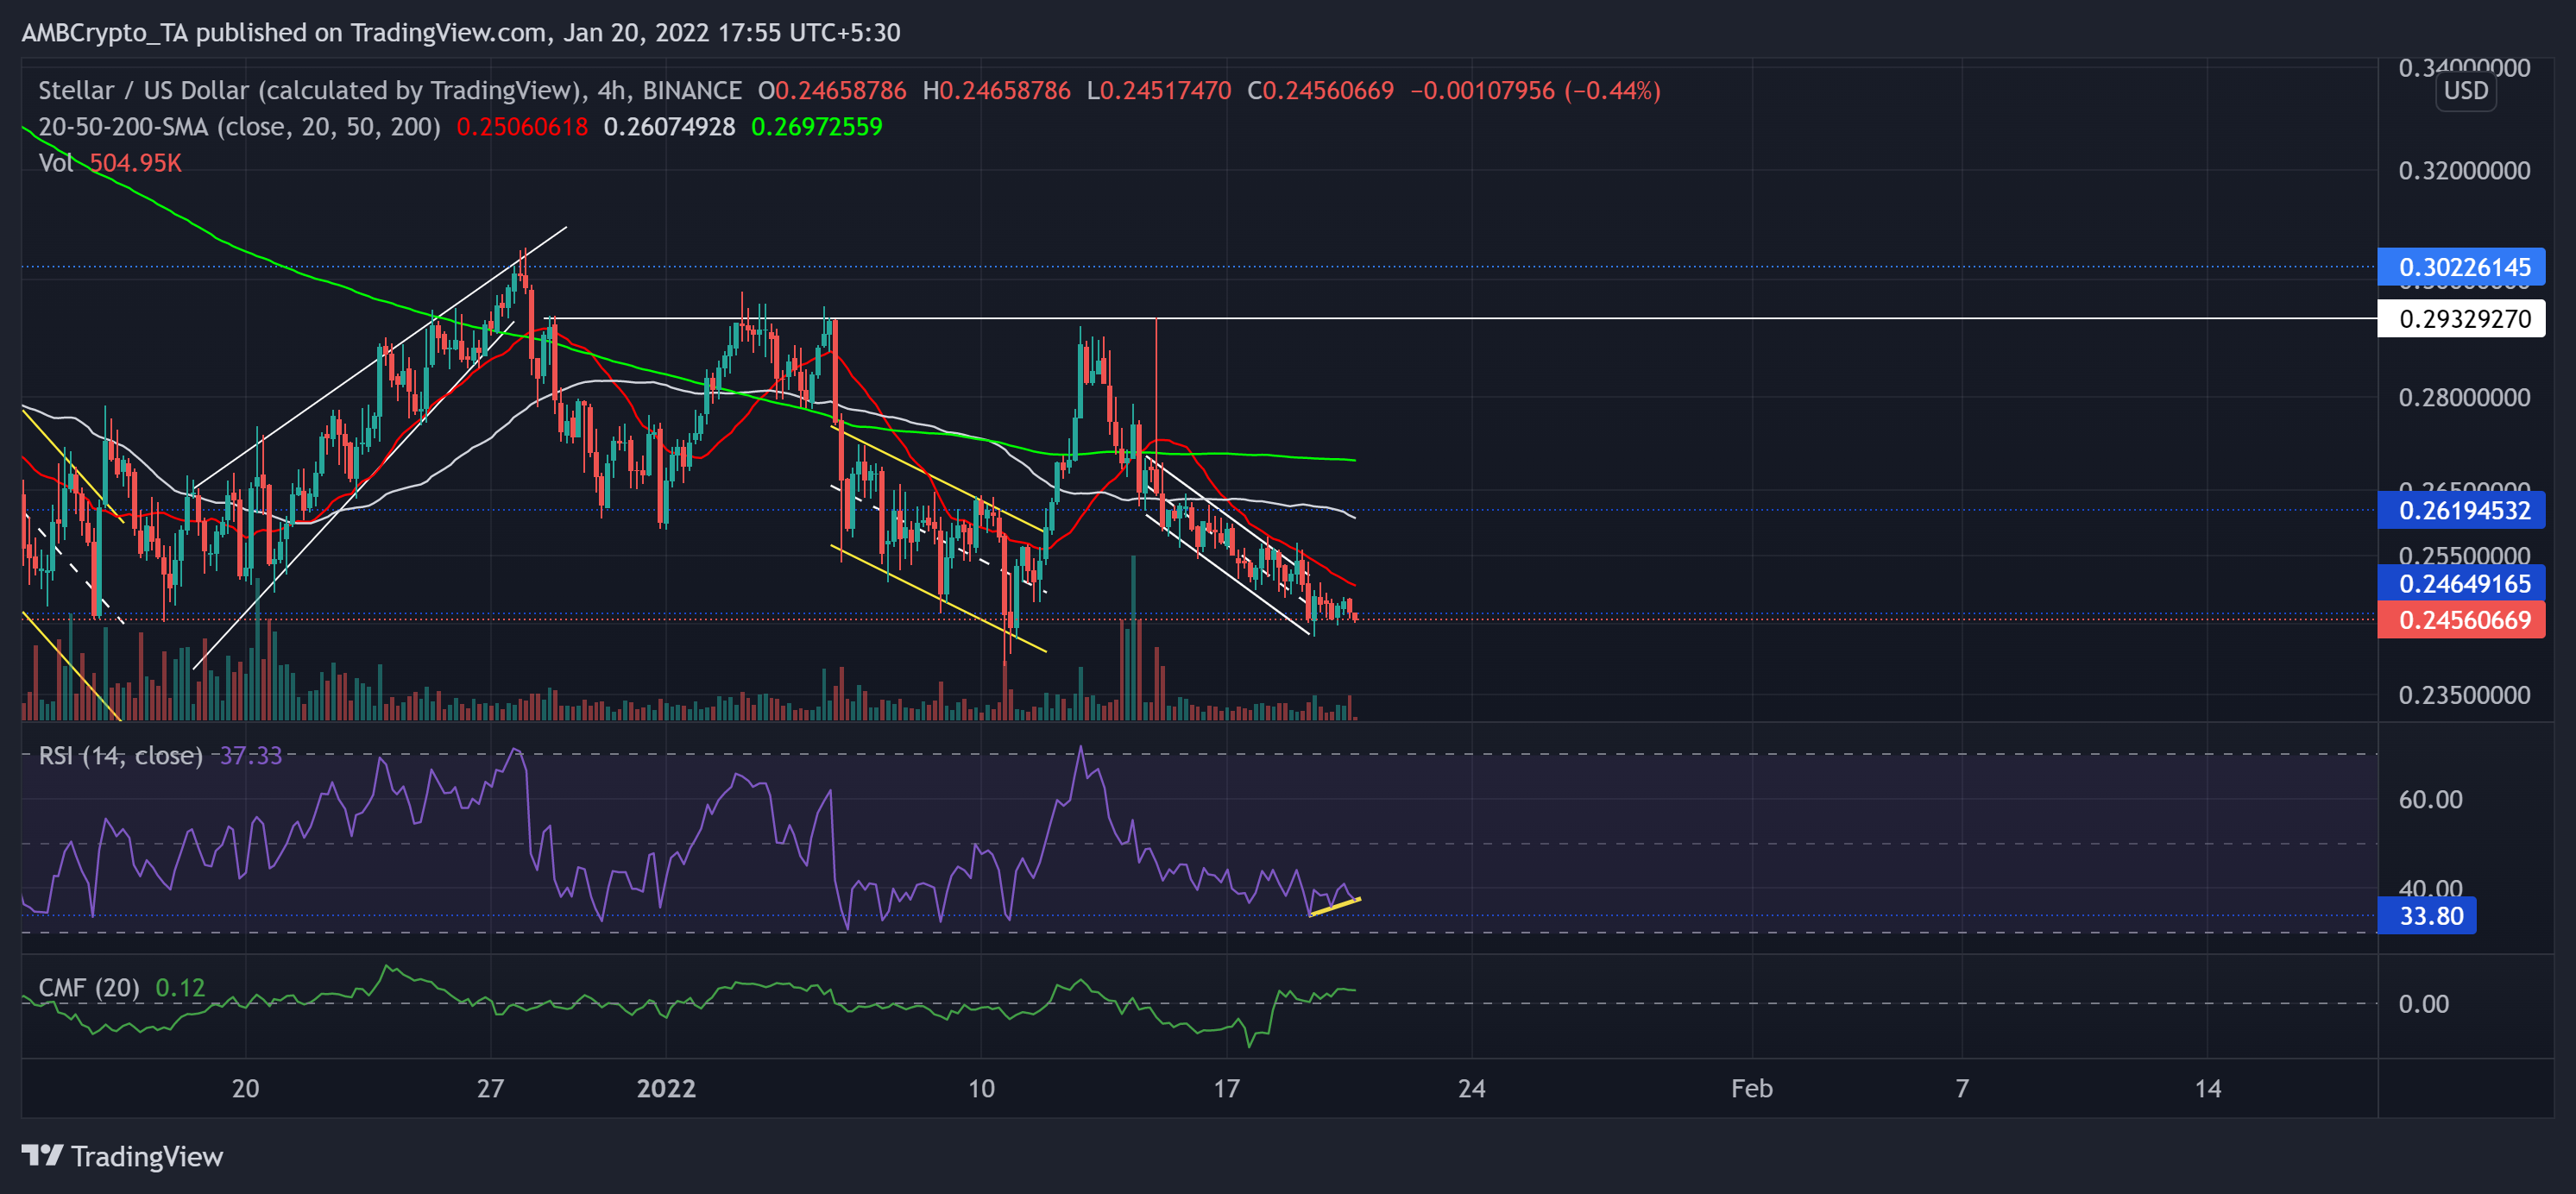
Source: TradingView, XLM/USD
The broader 5 January sell-off led XLM to lose over 18% of its value until it poked its five-week low on 10 January. The previous down-channel downfall halted at the $0.02464-mark 24-week support (now resistance).
Now, to prevent a further breakdown, the buyers needed to step in after failing to defend the crucial $0.2464-mark. Any comeback attempt by the bulls would find resistance at the 20-SMA (red).
At press time, XLM traded below its 20-50-200 SMA at $0.2456. After losing its half-line support, the RSI slightly revived from the 33-mark. If it fails to maintain the trendline support (yellow), the price will have to brace for a further dive. However, the CMF rapidly ascended in the last two days to find itself above the zero line. It visibly supported the bulls.
AAVE
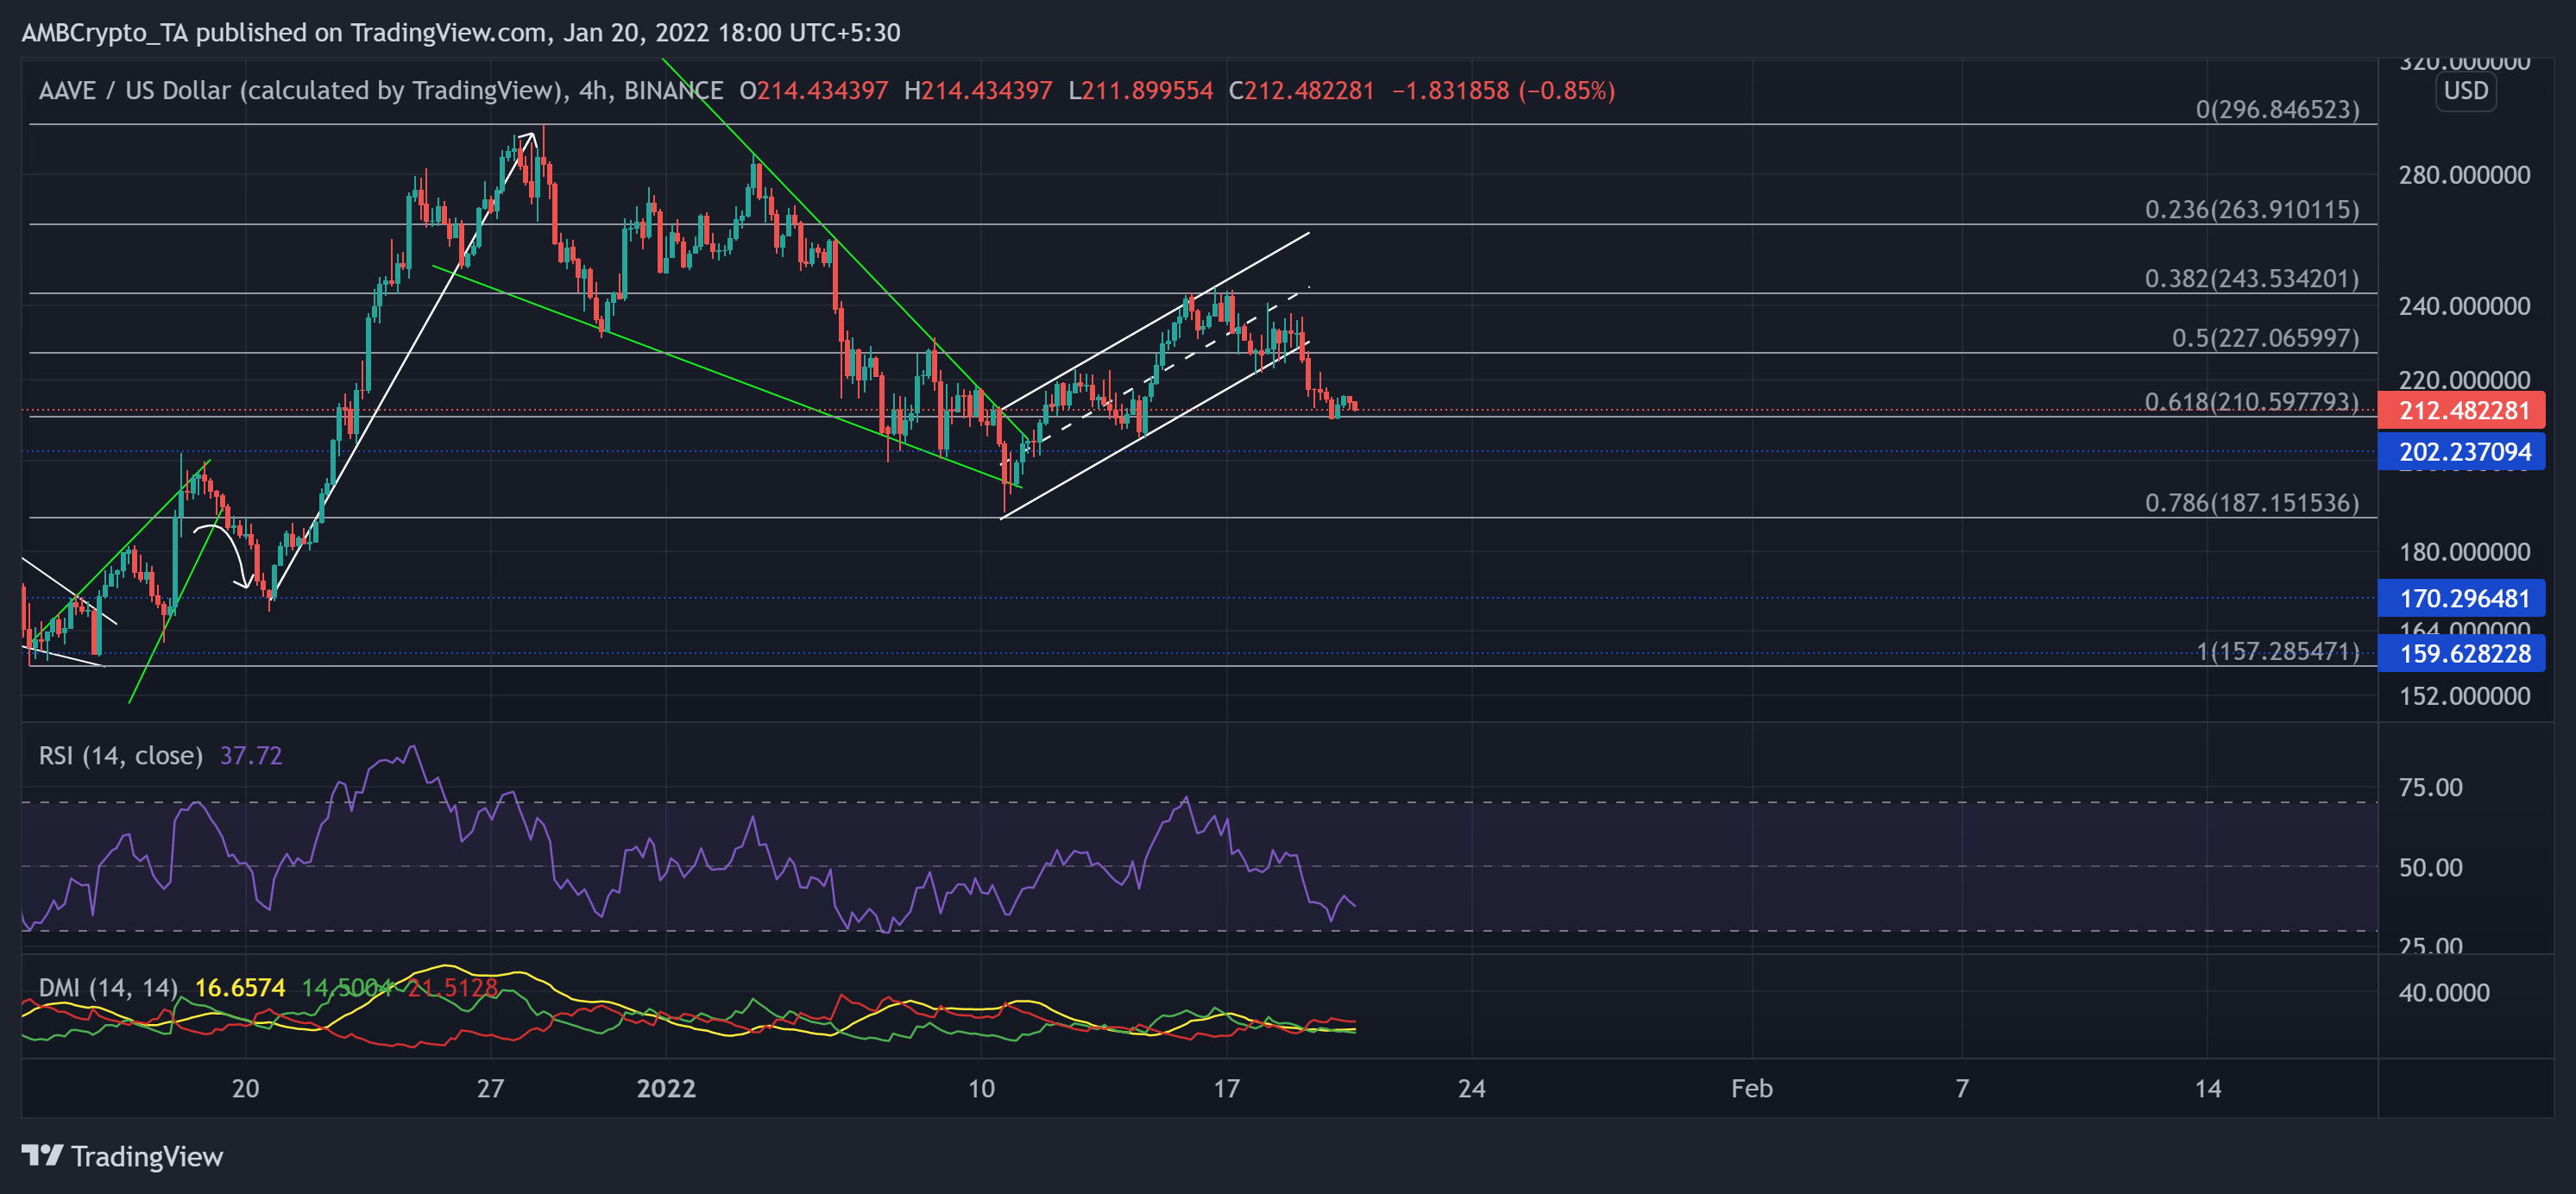
Source: TradingView, AAVE/USD
The alt reversed its descent from the critical $159-mark long-term support on 15 December. It saw a staggering 84.8%ROI (from 15 December low) until it poked its six-week high on 28 December.
Over the past few days, AAVE saw a falling wedge (green) breakout that reclaimed the lost 61.8% Fibonacci support.
Now, the bears triggered a pullback and caused an up-channel (white) breakdown that found support at the golden Fibonacci level.
At press time, AAVE traded at $0.0. The RSI wavered below the half-line and flashed a bearish bias. Also, the DMI depicted a bearish edge, but the ADX (directional trend) was weak for AAVE.