
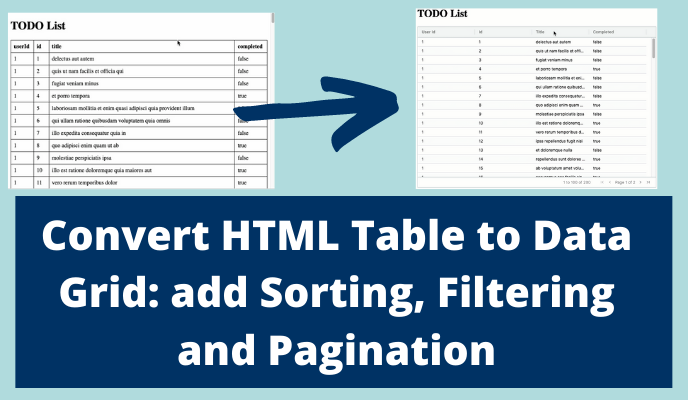
HTML Tables are simple to use for rendering small amounts of data. But they can be hard for users to work with when they display a lot of data.
Features like sorting, filtering, and pagination make it easier to work with many rows of data. We can easily implement those features by migrating from an HTML Table to a JavaScript Data Grid component.
In this post we will use the free community edition of AG Grid JavaScript Data Grid to convert from a long static HTML table to an easy to use interactive Data Grid. The amount of JavaScript we need to do this is minimal and very simple.
We will build the example code in three steps:
- Render a static list of Todo Items data in an HTML Table.
- Load a list of Todo Items from a REST API and render in the table.
- Convert the HTML Table to a Data Grid to allow sorting, filtering and pagination.
How to Render Data with HTML Tables
The first version of our application will allow us to create the basic page structure and make sure we are rendering the right data for the user.
I create a simple index.html file as shown below:
<!DOCTYPE html>
<html>

<head>
    <title>Table Example</title>
</head>

<body>

    <style>
        table {
            border-collapse: collapse;
            width: 100%;
        }

        td,
        th {
            border: 1px solid #000000;
            text-align: left;
            padding: 8px;
        }
    </style>

    <h1>TODO List</h1>

    <div id="data-table">
        <table id="html-data-table">
            <tr>
                <th>userId</th>
                <th>id</th>
                <th>title</th>
                <th>completed</th>
            </tr>
            <tr>
                <td>1</td>
                <td>1</td>
                <td>My todo 1</td>
                <td>false</td>
            </tr>
        </table>
    </div>

</body>

</html>
This will render a single Todo Item in a table.
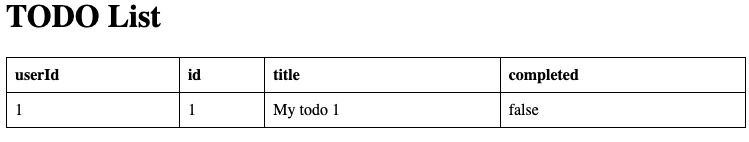
Here is the example Static HTML Table Page.
The table is styled to have a width of 100% of the page using width:100% and the border lines between cells in the table have been styled to show as one line with border-collapse: collapse.
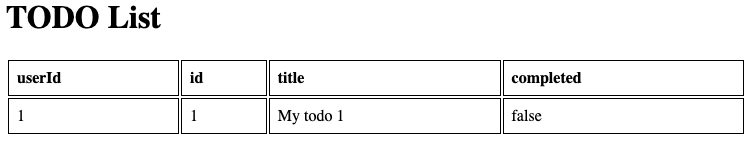
Without the border-collapse value the table would look like the image below:
Benefits of Short HTML Tables
HTML Tables are a very fast way to render small amounts of data in a tabular form on a page.
Tables require styling because the default styling of a table varies between browsers and is often shown with no borders making the data hard to read.
At the moment, our list of Todo Items is statically coded into the page. For the next step we will fetch the list from a REST API using JavaScript.
How to Read JSON from an API to Render in an HTML Table
Since we will be loading the data from an API, I won't hard code any data in the table. To support dynamic loading, I simply remove the line of data from the table because I'm going to create the data rows using JavaScript:
    <div id="data-table">
        <table id="html-data-table">
            <tr>
                <th>userId</th>
                <th>id</th>
                <th>title</th>
                <th>completed</th>
            </tr>
        </table>
    </div>
I will add the JavaScript in the index.html page immediately before the terminating body tag.
    <script type="text/javascript" charset="utf-8">
    </script>
</body>
To start, I will write the code that reads the data.
I will use the "{JSON} Placeholder" REST API application for this demonstration. By making a GET request on the URL https://jsonplaceholder.typicode.com/todos we will receive a JSON response which is a list of Todo Items.
You can try it for yourself without JavaScript by clicking on the link above.
The easiest way to make a GET request on the API is by using the fetch function built into JavaScript.
    <script type="text/javascript" charset="utf-8">

        fetch('https://jsonplaceholder.typicode.com/todos')
            .then(function (response) {
                return response.json();
            }).then(function (apiJsonData) {
                console.log(apiJsonData);
            })

    </script>
</body>
To explain the above code, I'll describe it in sections below:
- Issue a GET request to
https://jsonplaceholder.typicode.com/todos
fetch('https://jsonplaceholder.typicode.com/todos')
- Then when the request is finished, convert the response to a JavaScript Object – in our case this will be an array containing all the Todo Items.
.then(function (response) {
	return response.json();
})
- Then write the JavaScript object to the console
.then(function (apiJsonData) {
	console.log(apiJsonData);
})
With this code in our application, we won't see anything in the table, but we would see the array rendered in the Browser Dev Tools Console where we could view the data.
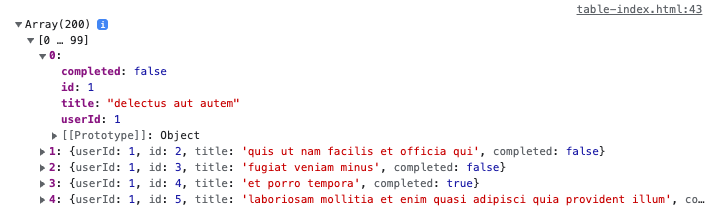
The API call returns 200 items, and each item is a Todo Object:
  {
    "userId": 1,
    "id": 1,
    "title": "delectus aut autem",
    "completed": false
  }
Our next step is to render the data in the table:
    <script type="text/javascript" charset="utf-8">

        fetch('https://jsonplaceholder.typicode.com/todos')
            .then(function (response) {
                return response.json();
            }).then(function (apiJsonData) {
                console.log(apiJsonData);
                renderDataInTheTable(apiJsonData);
            })

        function renderDataInTheTable(todos) {
            const mytable = document.getElementById("html-data-table");
            todos.forEach(todo => {
                let newRow = document.createElement("tr");
                Object.values(todo).forEach((value) => {
                    let cell = document.createElement("td");
                    cell.innerText = value;
                    newRow.appendChild(cell);
                })
                mytable.appendChild(newRow);
            });
        }
    </script>
</body>
The renderDataInTheTable function finds the table in the DOM so that we can append new rows to it, then loops over all the Todo Items returned from the API call.
For each Todo Item the code creates a new tr element, then adds each value in the Todo Item to the table as a td element.
let newRow = document.createElement("tr");
Object.values(todo).forEach((value) => {
    let cell = document.createElement("td");
    cell.innerText = value;
    newRow.appendChild(cell);
})
When the fetch and renderDataInTheTable code is added to our application, and the page loads, we will see that the HTML table now has all 200 Todo Items rendered in the table.
Here is the example Dynamic HTML Table Page.
Benefits and Disadvantages of Long HTML Tables
HTML Tables are an easy way to render data on a page but are not very usable for long lists of data.
The data items can be hard to find, although the user can search the data by using the built in 'find in the page' functionality of the browser.
By rendering in an HTML table, our users have no way to sort the data, or filter it to show only completed Todo Items. We would have to add extra code to our application to implement sorting and filtering functionality.
HTML Tables will automatically grow as more rows are added to the table. This can make them harder to use in an application when a lot of data has been added.
When we add a lot of data we probably want to have pagination to restrict the table of data to show only a certain number of rows and allow the user to click through to the next page to see more items. This, again, is functionality we would have to write extra code to handle.
When our application gets to the point that we need more user interaction, we should consider using a Data Grid component.
We can use it to add extra functionality like:
- sorting
- filtering
- column resizing
- pagination
Data Grid Components and Libraries
There are many free Data Grid Components available, but most of them are framework specific so they require coding using either React, Angular, or Vue.
I'm using AG Grid for this example because the free version can be used with JavaScript, TypeScript, React, Angular or Vue. The "AG" stands for Agnostic, meaning can be used with any framework.
When you learn to use AG Grid in one framework, the same API is available for other frameworks, making your knowledge transferrable to other projects.
The free version of AG Grid can be used in commercial applications, so if you manage to expand the demo application shown here into a commercial Todo List Management Application, you'll still be able to use AG Grid for free. Many commercial applications have been built using the free version of AG Grid.
In addition, AG Grid is frequently sought as a skill in job applications, so is worth experimenting with.
The commercial version of AG Grid has extra features like Excel Exporting and creating Charts, but we don't need any of that functionality in this demo.
Using a Data Grid means that we configure the Data Grid, give it the data to render, and the Grid handles all the other functionality like sorting, filtering, and pagination.
We can convert our existing code to use AG Grid with just a few changes.
How to Add AG Grid JavaScript and CSS
AG Grid is a library so we will include the JavaScript required.
If you are using build tools like npm, then various npm install commands are listed in the Getting Started with AG Grid documentation.
We are using plain JavaScript, so we can include the script in our head section.
<head>
    <title>Data Grid Example</title>
    <script src="https://unpkg.com/ag-grid-community/dist/ag-grid-community.min.noStyle.js"></script>
    <link rel="stylesheet" href="https://unpkg.com/ag-grid-community/dist/styles/ag-grid.css">
    <link rel="stylesheet" href="https://unpkg.com/ag-grid-community/dist/styles/ag-theme-balham.css">
</head>
This includes the community edition of AG Grid and the CSS required to render the Grid properly.
Our data-table div no longer needs to have any table element:
    <div id="data-table" class="ag-theme-balham">
    </div>
AG Grid will create the HTML for the Data Grid when we set it up. We add the class to use an AG Grid theme. In this example we are using the theme ag-theme-balham.
AG Grid requires setting a width and height for the div. I chose to add this as the style section in the code:
    <style>
        #data-table {
            height: 500px;
            width: 100%;
        }
    </style>
The grid will be shown as 500 pixels high and fill 100% width of the screen. This replicates the basic styling we had with the HTML table. But it also shows one of the benefits of using a Data Grid. The size of the table rendered can be easily controlled and scroll bars will be added automatically as necessary by the Grid itself.
How to Configure AG Grid and Render Data
The script section of the code changes because we need to:
- Configure the data grid.
- Create a new data grid using the configuration.
- Fetch the data and add it to the grid.
I'll show the initial amended script section below and then explain it in the following paragraphs.
    <script type="text/javascript" charset="utf-8">

        const columnDefs = [
            { field: 'userId' },
            { field: 'id' },
            { field: 'title' },
            { field: 'completed' },
        ];

        const gridOptions = {
            columnDefs: columnDefs,
            onGridReady: (event) =>{renderDataInTheTable(event.api)}
        };

        const eGridDiv = document.getElementById('data-table');
        new agGrid.Grid(eGridDiv, gridOptions);

        function renderDataInTheTable(api) {
            fetch('https://jsonplaceholder.typicode.com/todos')
                .then(function (response) {
                    return response.json();
                }).then(function (data) {
                    api.setRowData(data);
                    api.sizeColumnsToFit();
                })
        }
    </script>
A Data Grid is data- and configuration-driven – we don't have to write much code in order to create a functional Data Grid.
First we create an array of Column Objects which define the columns in the Data Grid. These columns map on to the data.
The data that we are receiving from the API call has four properties: "userId", "id", "title" and "completed":
  {
    "userId": 1,
    "id": 1,
    "title": "delectus aut autem",
    "completed": false
  }
To render these in the Data Grid as columns, we create an Object with a field property where the value is the name of the property in the Data Object.
        const columnDefs = [
            { field: 'userId' },
            { field: 'id' },
            { field: 'title' },
            { field: 'completed' },
        ];
Next we create the gridOptions object. This configures the Data Grid:
        const gridOptions = {
            columnDefs: columnDefs,
            onGridReady: (event) =>{renderDataInTheTable(event.api)}
        };
The columnDefs property is assigned the array of Column Objects that we defined earlier.
The onGridReady property is assigned a function which will call the renderDataInTheTable function when the grid has been created and rendered in the DOM (that is, when the grid is ready).
To add the grid to the page, we find the div element which will contain the grid, then instantiate a new AG Grid object for that element and with the options we configured:
        const eGridDiv = document.getElementById('data-table');
        new agGrid.Grid(eGridDiv, gridOptions);
The function to fetch the data and render the data in the grid is much the same fetch code that we used for the dynamic HTML table. The difference is that the renderDataInTheTable function receives an AG Grid Api object as a parameter, allowing us to call AG Grid functionality to set the row data and size the columns to fit the grid:
        function renderDataInTheTable(api) {
            fetch('https://jsonplaceholder.typicode.com/todos')
                .then(function (response) {
                    return response.json();
                }).then(function (data) {
                    api.setRowData(data);
                    api.sizeColumnsToFit();
                })
        }
When this code runs, we will have basically replicated the same functionality of the dynamic HTML table, but now all the data is shown in a Data Grid with a scroll bar.
To receive the benefits of using a Data Grid and allow the user to sort, filter, and navigate through the data, we only have to amend the configuration.
How to Implement Sorting, Filtering, and Pagination
Here's what we've configured in the Data Grid so far:
- which fields from the data to display
- what data to use
To add sorting, filtering, resizable columns, and pagination, we amend the gridOptions configuration:
        const gridOptions = {

            defaultColDef: {
                sortable: true,
                filter: 'agTextColumnFilter',
                resizable: true
            },

            pagination: true,

            columnDefs: columnDefs,
            onGridReady: (event) =>{renderDataInTheTable(event.api)}
        };
We can configure columns in AG Grid individually by adding additional properties to the columnDefs objects. Or if the same functionality is required by default in all columns we can configure the defaultColDef.
Here we configure it to be sortable, filterable, and resizable:
            defaultColDef: {
                sortable: true,
                filter: 'agTextColumnFilter',
                resizable: true
            },
The default filter we defined for all the columns is the text filter.
To add automatic pagination to the grid, we add the pagination: true property and AG Grid will automatically paginate the data for us.
User Friendly Data Grid
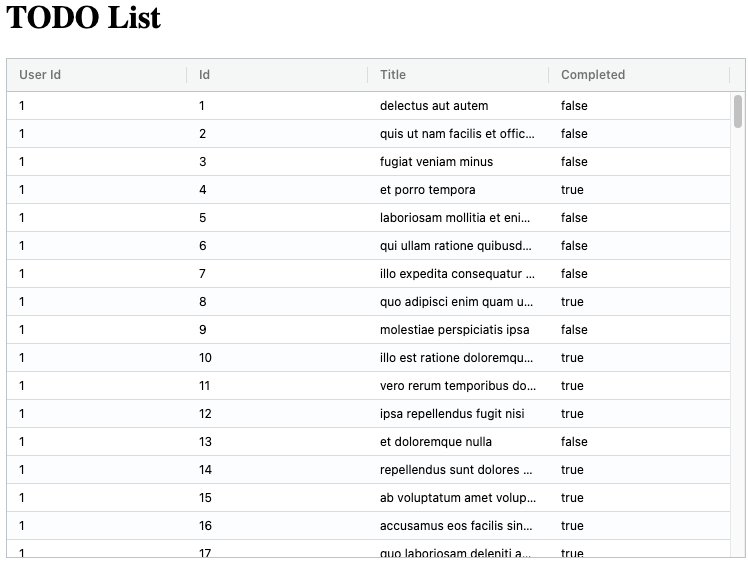
With the above code we have created a User Friendly Data Grid that dynamically fetches the data and adds it to a Data Grid which supports sorting, filtering, and pagination.
Here is the example Data Grid HTML Page:
<!DOCTYPE html>
<html>

<head>
    <title>Data Grid Example</title>
    <script src="https://unpkg.com/ag-grid-community/dist/ag-grid-community.min.noStyle.js"></script>
    <link rel="stylesheet" href="https://unpkg.com/ag-grid-community/dist/styles/ag-grid.css">
    <link rel="stylesheet" href="https://unpkg.com/ag-grid-community/dist/styles/ag-theme-balham.css">
</head>

<body>
    <style>
        #data-table {
            height: 500px;
            width: 100%;
        }
    </style>

    <h1>TODO List</h1>

    <div id="data-table" class="ag-theme-balham">
    </div>

    <script type="text/javascript" charset="utf-8">

        const columnDefs = [
            { field: 'userId' },
            { field: 'id' },
            { field: 'title' },
            { field: 'completed' },
        ];

        const gridOptions = {

            defaultColDef: {
                sortable: true,
                filter: 'agTextColumnFilter',
                resizable: true
            },

            pagination: true,

            columnDefs: columnDefs,
            onGridReady: (event) =>{renderDataInTheTable(event.api)}
        };

        const eGridDiv = document.getElementById('data-table');

        new agGrid.Grid(eGridDiv, gridOptions);

        function renderDataInTheTable(api) {
            fetch('https://jsonplaceholder.typicode.com/todos')
                .then(function (response) {
                    return response.json();
                }).then(function (data) {
                    api.setRowData(data);
                    api.sizeColumnsToFit();
                })
        }
    </script>
</body>
</html>
Number Filters
Since the userId and id columns are numeric, we could make then use a number filter by amending the columnDefs:
        const columnDefs = [
            { field: 'userId', filter: 'agNumberColumnFilter'},
            { field: 'id', filter: 'agNumberColumnFilter'},
            { field: 'title' },
            { field: 'completed' },
        ];
Here is the example Data Grid Number Filters HTML Page.
There are a lot of configuration options for columns listed in the AG Grid Documentation, for example configuring the width, style, and making the cells editable.
Benefits of a Data Grid
For many web sites, a simple HTML table will be a perfectly sensible way to render tabular data. It's fast and easy to understand, and with a little CSS the table can look good for your users.
When your pages become more complex, render more data, or require more interactivity for the user, then it starts to make more sense to use a Data Grid component or library.
Data Grids provide much of the functionality your users need, without having to write a lot of code. In the example presented in this post, we moved from a dynamic table which read the data from an API, to a Data Grid reading from an API with sorting, filtering, pagination, and column resizing.
This is a lot of extra functionality, but our HTML code was the same length and the JavaScript we added was less complicated because the Data Grid did all the work of rendering the data.
Data Grids can handle hundreds of thousands of rows and update quickly so they are often used in real time financial trading systems with prices in cells updating every few milliseconds.
If you are using React, then in addition to AG Grid you could look at Material UI or React Table. React Table is a 'table' rather than a Data Grid so it requires a little more code initially to render the table.
Both Material UI and React Table are only available for React. AG Grid is framework agnostic and will work with JavaScript, TypeScript, React, Angular, and Vue.
The source code for this post can be found in this Github repo in the folder docs/html-table-to-data-grid.