Quick Links
Gantt charts are essential tools for project managers. But if you are a beginner or only need this type of chart for one project, you can save money on expensive software and make a Gantt chart in Excel.
What Is a Gantt Chart?
A Gantt chart is a graph that shows a project schedule, with its first iterations being a simple bar chart in the early 1900s. Since then, it grew into a more modern visual for displaying not just a schedule but relationships and dependencies in relation to the project schedule.
With this in mind, you can create a basic Gantt chart in Excel using a stacked bar chart. If you need to take your management of the project further with those additional details, Microsoft offers templates specifically for Gantt charts. Let's look at both.
Use a Stacked Bar Chart as a Gantt Chart
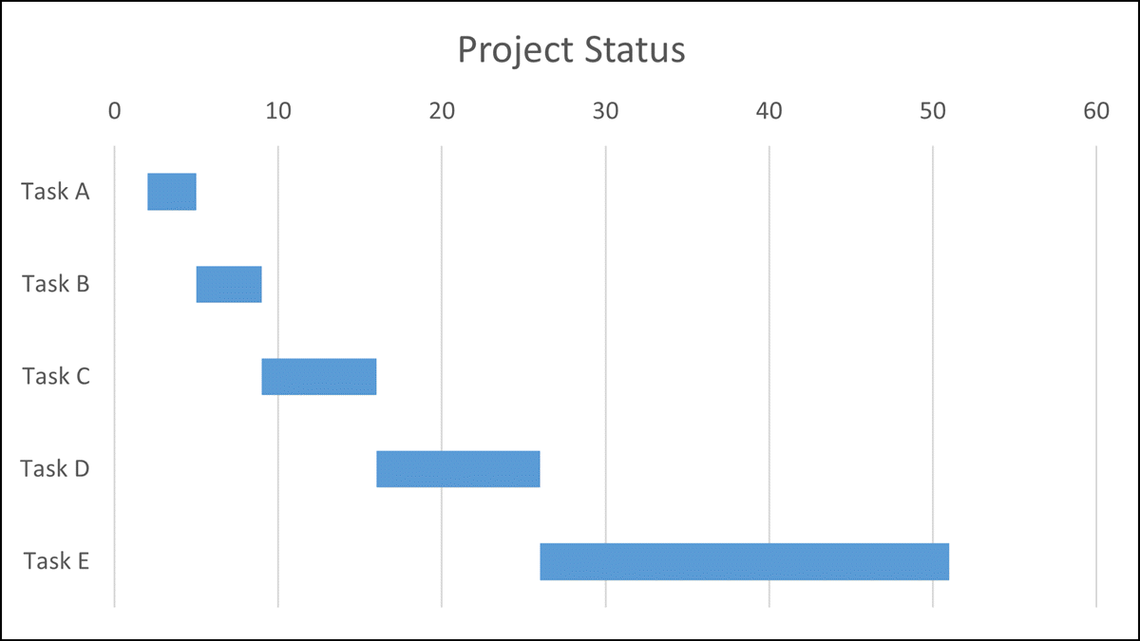
With a stacked bar chart, which is one of Excel's built-in graph types, you can quickly and easily show the status of a project in the appearance of a Gantt chart.
Be sure that you have the data that you want to display on the chart to start. This can include project tasks with the durations for each. Here, we'll use tasks, how many days ago the tasks started, and the number of days left to complete each.
Select the data for your chart and go to the Insert tab. Click the Insert Column or Bar Chart drop-down box and select Stacked Bar below 2-D or 3-D, depending on your preference.

When the chart appears, you'll make a few adjustments to make its appearance better match that of a Gantt chart.
First, you'll want to change the order of the tasks on the vertical axis. As you can see, they display from bottom to top by default.

Double-click the vertical axis or right-click it and pick "Format Axis" to open the sidebar.

Confirm that the Format Axis sidebar opens to the Axis Options tab and expand Axis Options directly below if necessary. Check the box for Categories in Reverse Order.

Next, you'll remove the fill color for the first series (Started) to only display the remaining days (Days Left.) Keep the Format sidebar open and double-click this series on the chart to select it.

Click the Fill & Line tab in the sidebar, expand Fill, and choose "No Fill."

Now that you have a stacked bar chart that functions as a basic Gantt chart, you can make other adjustments if you like. You can do things like remove the legend, enter a title, change the colors, and pick a different font using the sidebar or Chart Design tab.

If you make changes to the chart data on your sheet, such as the number of days left, the chart updates automatically.

For additional projects, try saving your Gantt chart as a template to reuse later.
Use a Gantt Chart Template in Excel
If you want to include more details for your project than a simple status, such as responsible team members or project phases, you can use a Gantt chart template in Excel.
For Microsoft 365 subscribers, Excel provides a handful of premium Gantt chart options. Go to File > New, select the Office tab, and enter "Gantt chart" into the search box. From there, you can choose one of the templates.

If you don't subscribe to Microsoft 365, not to worry. Microsoft offers a free Simple Gantt Chart template created by Vertex42.com you can download that might just do the trick.

Click "Download" and open the template with Excel. When it appears, you'll need to click "Enable Editing" at the top to work with the template.

Complete the fields on the top left for Project Title, Company Name, and Project Lead as you like. Enter the Project Start date and the Display Week you want to begin with.

You can then enter the tasks for each phase of your project, the names of those responsible, and the start and end dates. As you add the Start and End Dates, you'll see the Gantt chart on the right update automatically.

For additional help with this specific template, click the About tab in the template or visit Vertex42.com.
Creating a basic Gantt chart doesn't have to be difficult. With these simple options, you can set up a schedule to keep your project on track.