Analysis
Shiba Inu, LUNA, VeChain Price Analysis: 19 January
Shiba Inu flashed a bearish inclination while bouncing back from the $0.00002706-level support. Its OBV still kept the bullish hopes alive. Also, Terra saw an increase in its buying power while its RSI crossed the midline.
On the other hand, VeChain continued its bearish outlook after falling below its EMA ribbons.
Shiba Inu (SHIB)
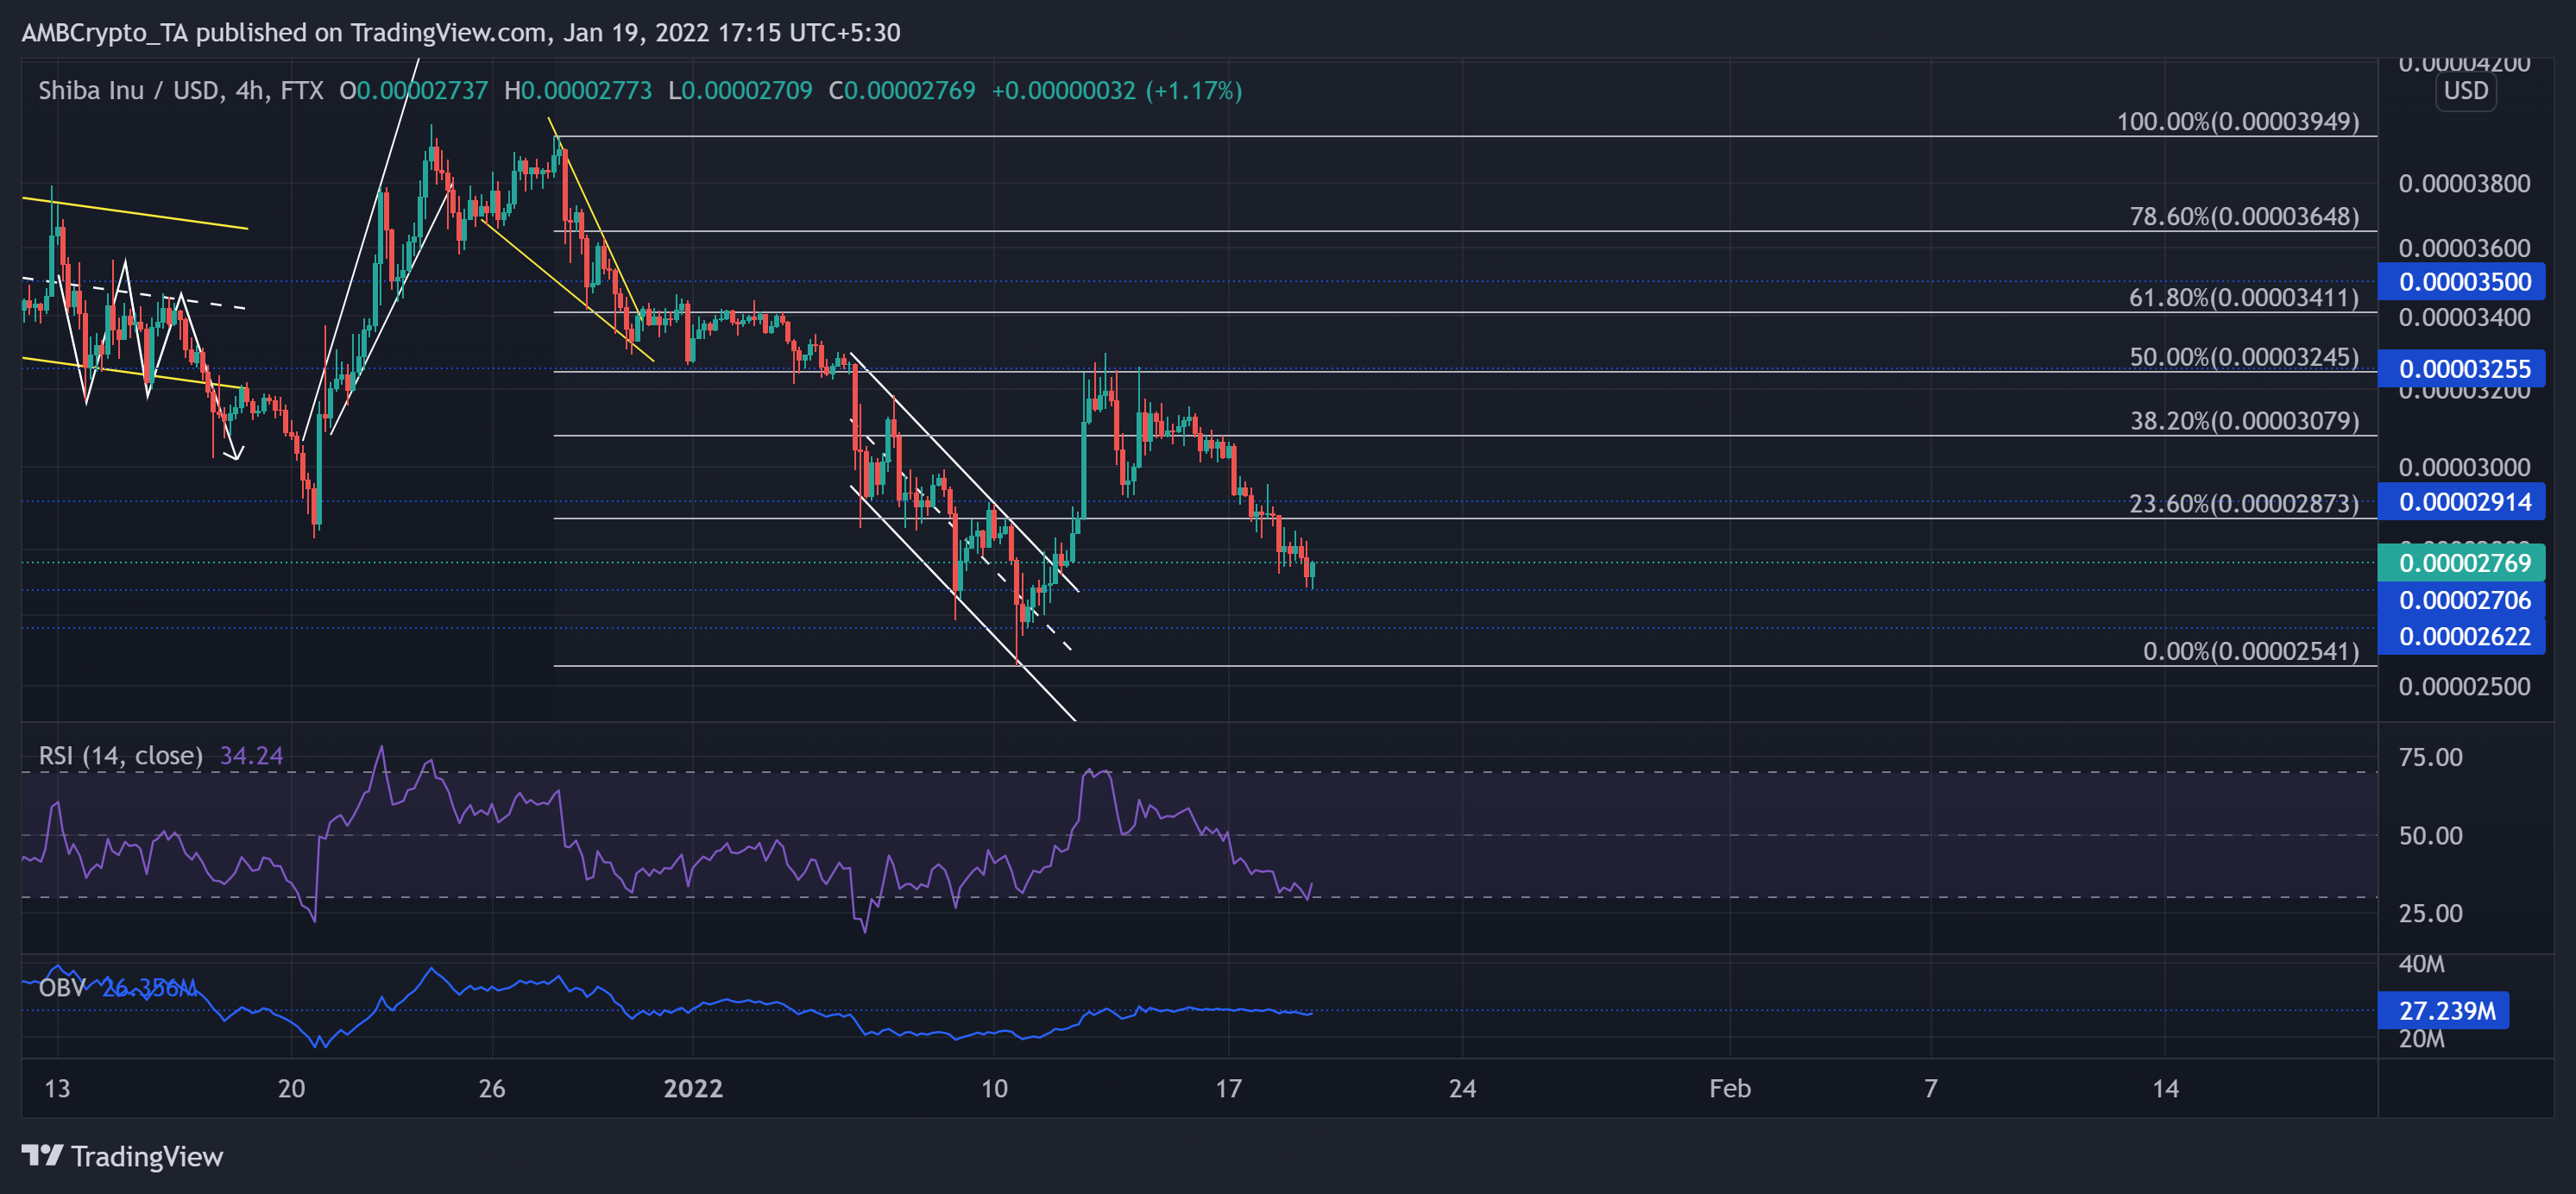
Source: TradingView, SHIB/USD
While the 61.8% Fibonacci resistance stood sturdy, the falling wedge (yellow) breakout failed to bag in returns for the investors. To top it up, the 5 January sell-off saw an over 22% retracement until SHIB poked its three-month low on 10 January.
Then, although it saw an excellent rally, the sellers stepped in at $0.00003245-level near the 50% resistance. Over the last five days, the alt was down by over 17%. The bulls then defended the $0.00002706-level support while the near-term technicals showed revival signs.
At press time, the alt traded at $0.00002769. The RSI bounced back from the oversold region after confirming a bearish vigor. However, the OBV still did not correspond with the recent fall, hinting at a likely bullish comeback.
Terra (LUNA)
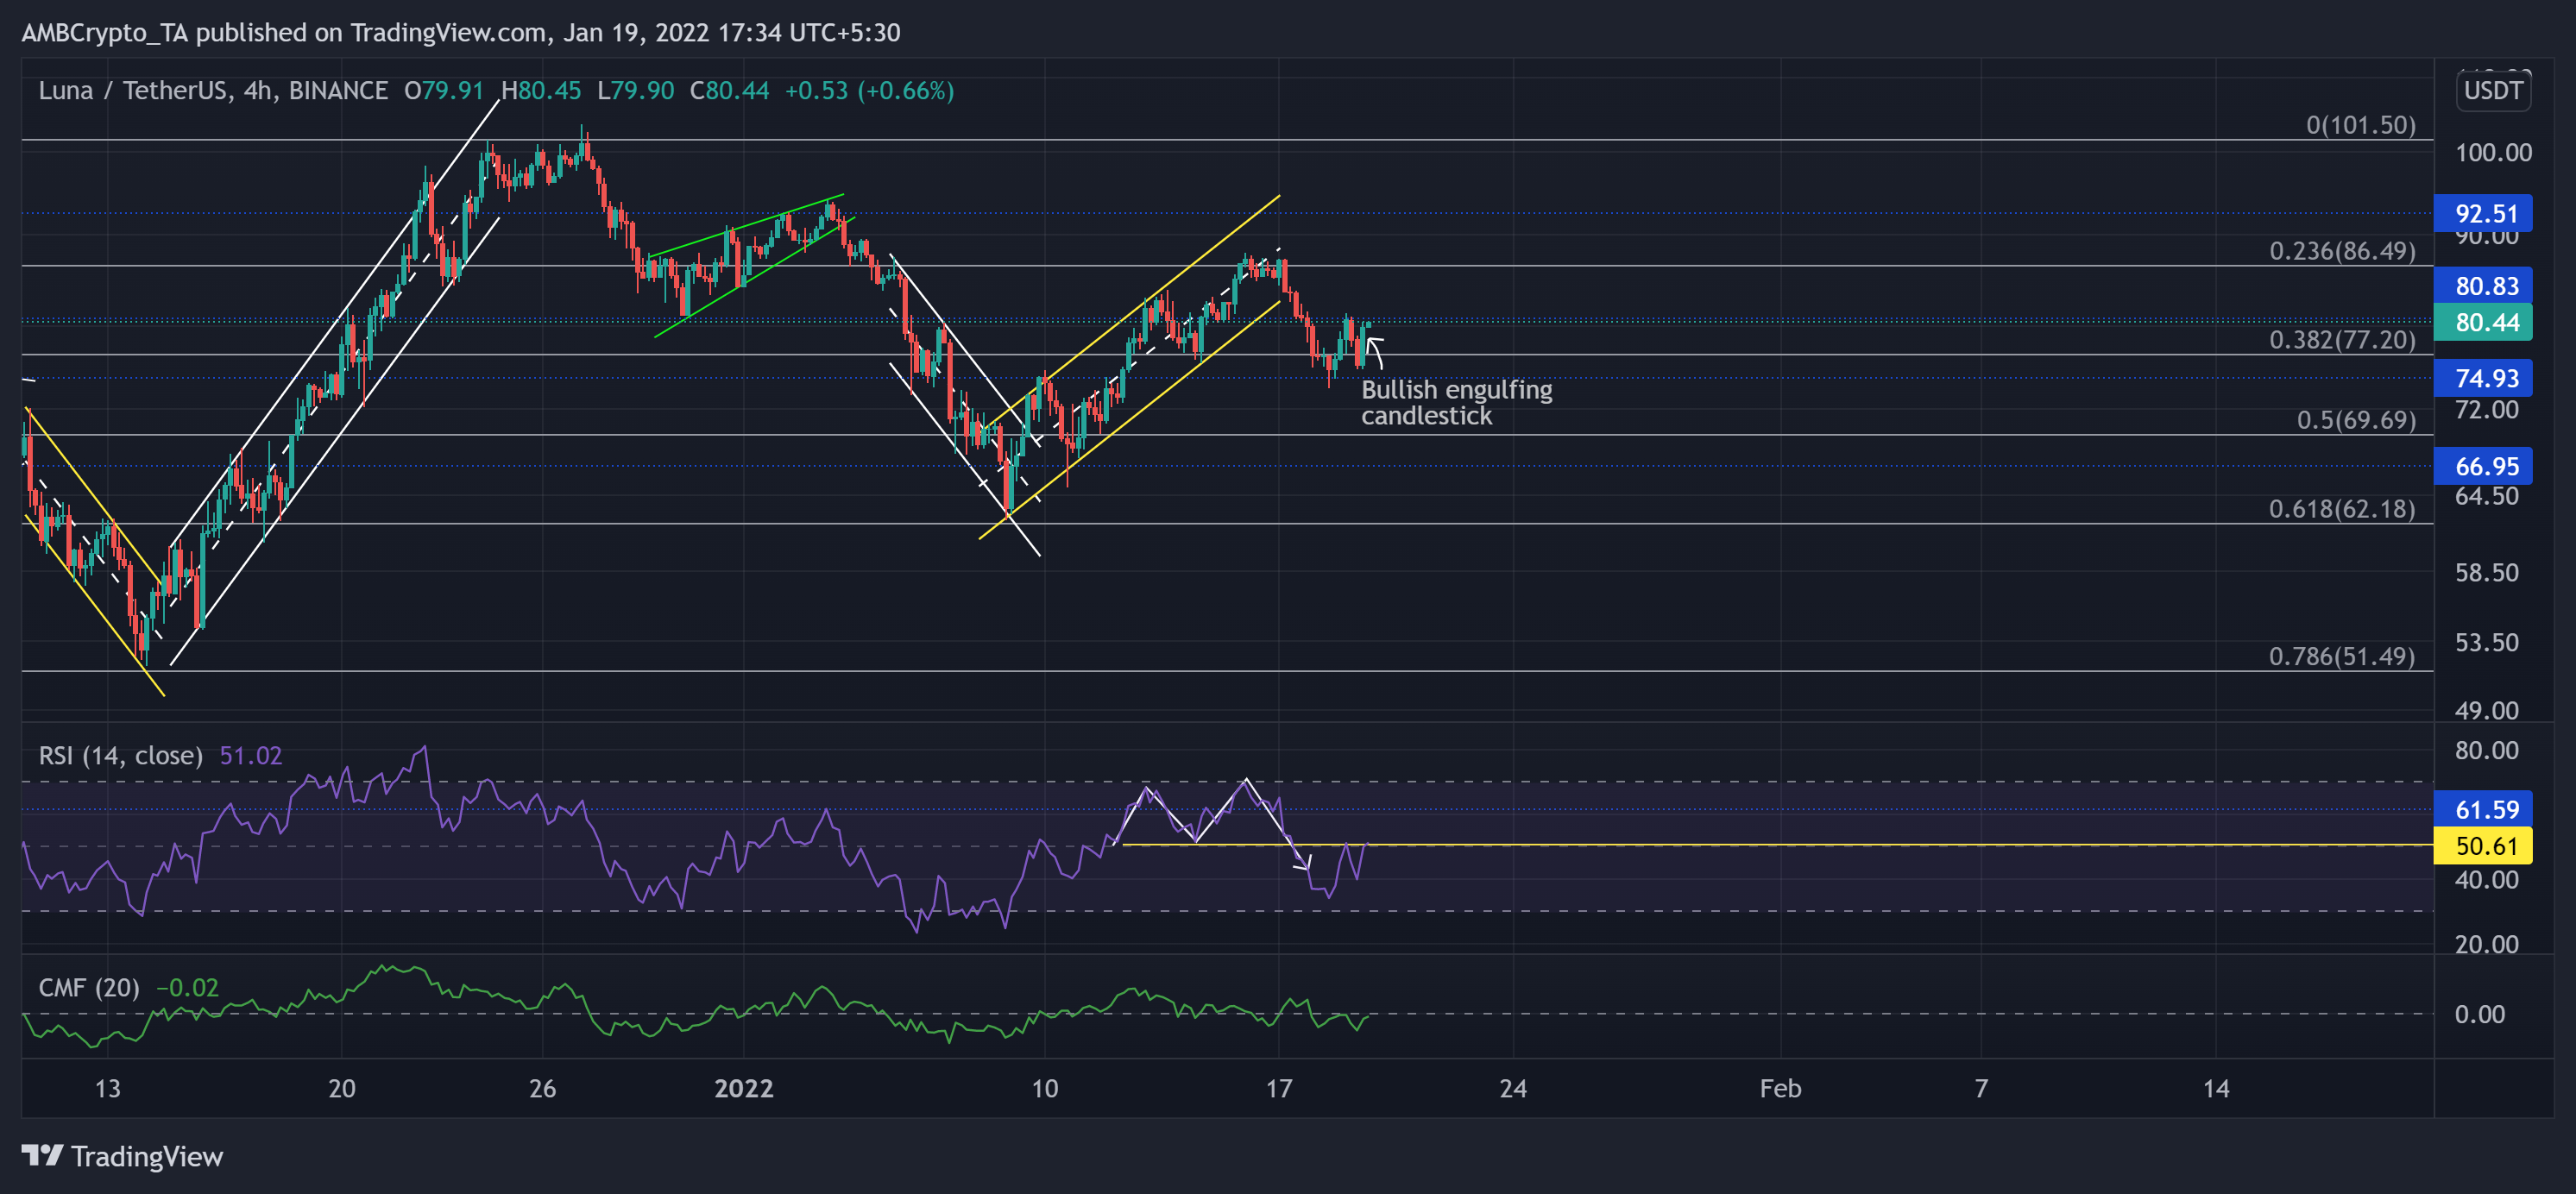
Source: TradingView, LUNA/USDT
Since breaching its three-week low on 8 January, the alt saw an aggressive up-channel (yellow) recovery from the 61.8% level. As a result, it registered over 39% gains until a steep reversal from the $86-zone.
However, the recent up-channel breakdown found strong support at the 38.2% Fibonacci level. LUNA saw a green engulfing candlestick that confirmed the increased buying influence. Now, the testing point for the bears stood at the $77-level while the bulls tried to topple the $80.83-mark.
At press time, LUNA traded at $80.44. The RSI steeply declined below the half-line after forming a double-top. Over the past 24 hours, it tested the midline twice and displayed revival signs. However, the CMF could not cross the zero-line to confirm a strong trend reversal.
VeChain (VET)
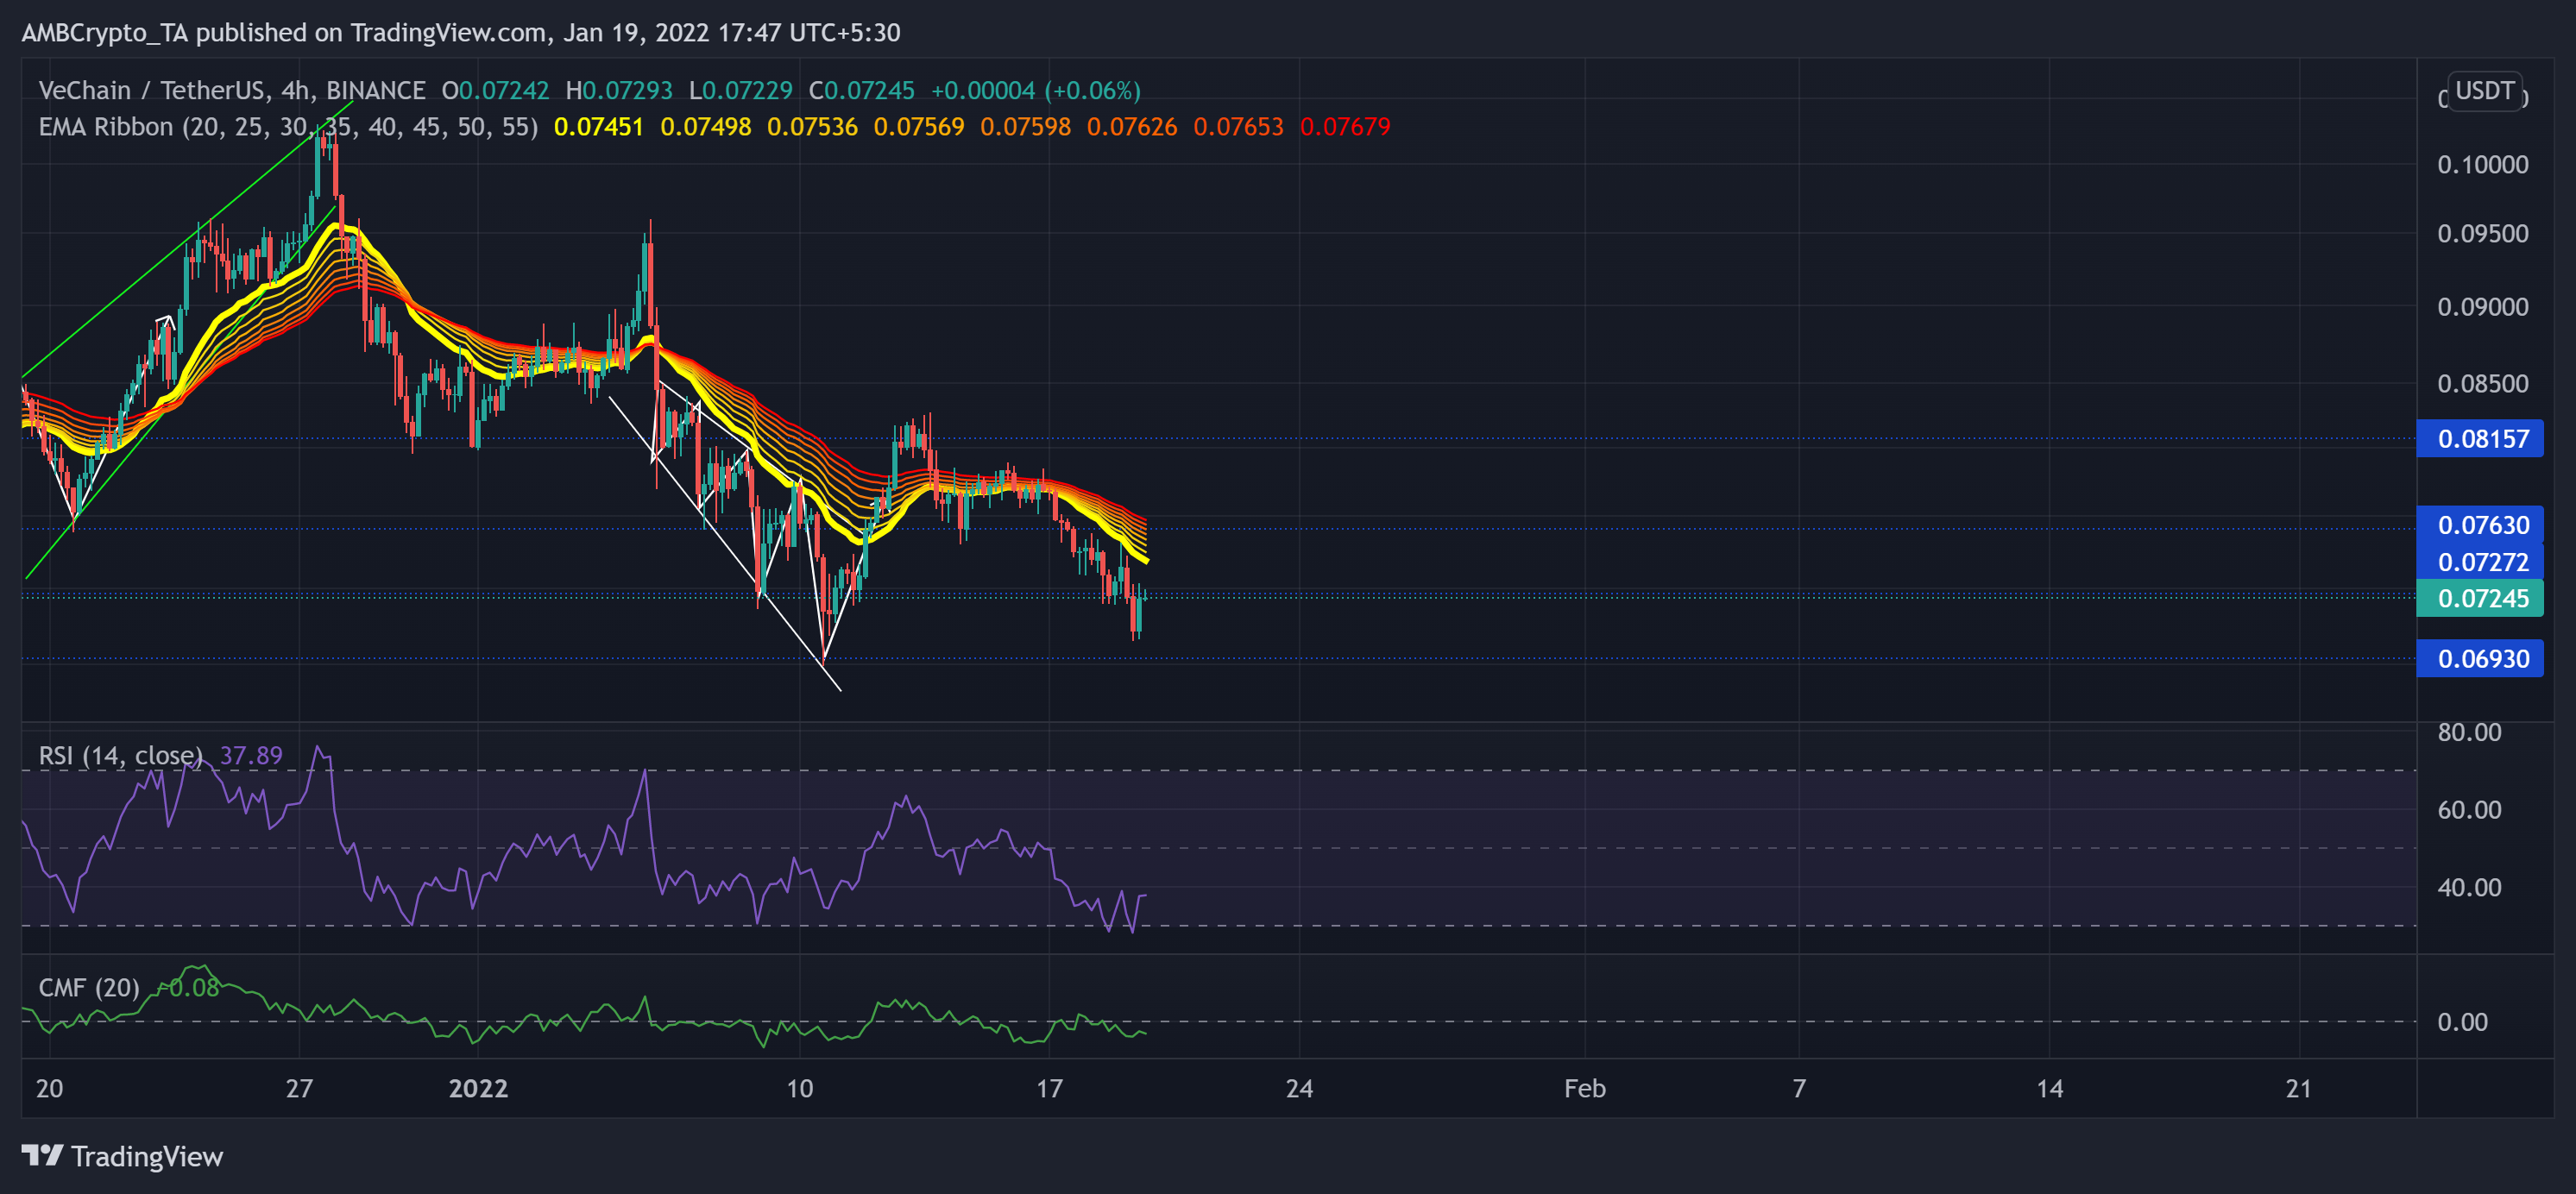
Source: TradingView, VET/USDT
After a descending broadening wedge breakout, VET reclaimed the $0.076-mark support after a 20% ROI (from 10 January low) until 13 January.
While the $0.08 resistance stood as a strong hurdle, the bulls even failed to defend the $0.7272-mark. As a result, the price fell below all its EMA ribbons. Now, as the gap between the ribbons widened, the selling power prevailed.
At press time, the alt traded at $0.07245. The RSI exhibited a bearish inclination as it moved sideways below the midline. Also, the CMF was on a downtrend and preferred the selling power.