1,836 reads
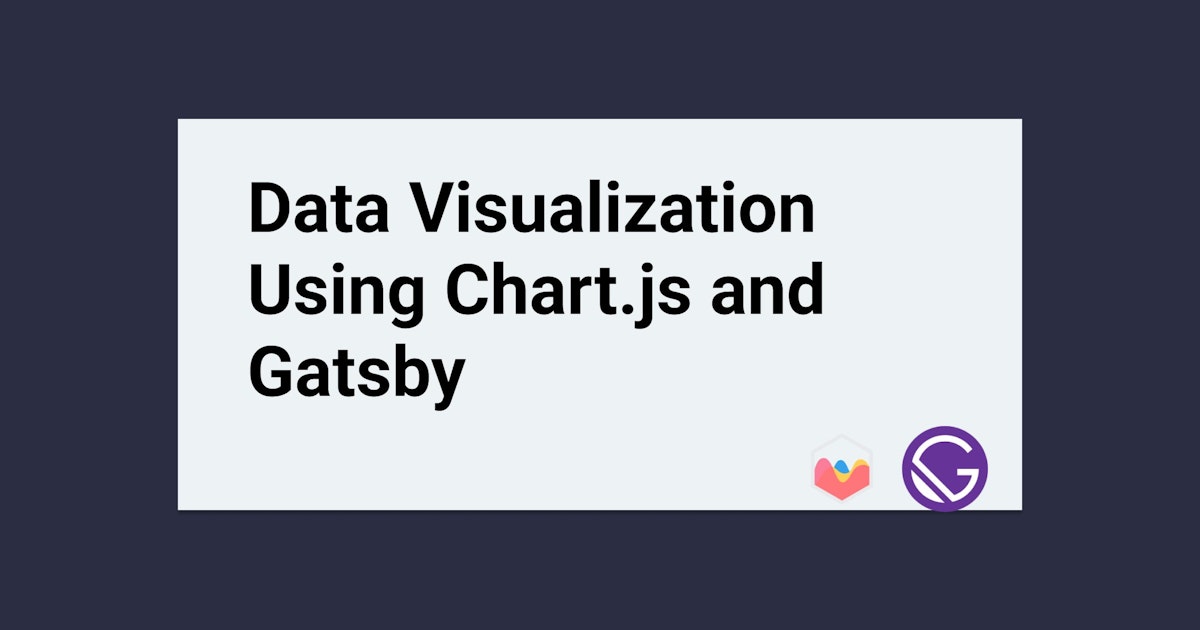
Data Visualization Using Chart.js and Gatsby


Too Long; Didn't Read
Data visualization is a way of presenting large unorganized datasets in an organized and valuable way. The value of data visualization outweighs the disadvantages, as the insights presented can help: Increase the speed of decision making* Provide access to real-time information and stats on the go. Use Gatsby to create a chart that we can all use on our websites.Company Mentioned


Teri
@terieyenike
I am a software developer focused on creating content through technical writing and documentation.
Learn More
LEARN MORE ABOUT @TERIEYENIKE'S
EXPERTISE AND PLACE ON THE INTERNET.
EXPERTISE AND PLACE ON THE INTERNET.

L O A D I N G
. . . comments & more!
. . . comments & more!