Altcoin
Solana, NEAR, EOS Price Analysis: 18 January
As the market took a 24-hour plunge to hover around the $2.10T-mark, most cryptos struggled to trade in the green zone on the last day. As a result, Solana, NEAR and EOS flashed bearish near-term technicals.
Solana (SOL)
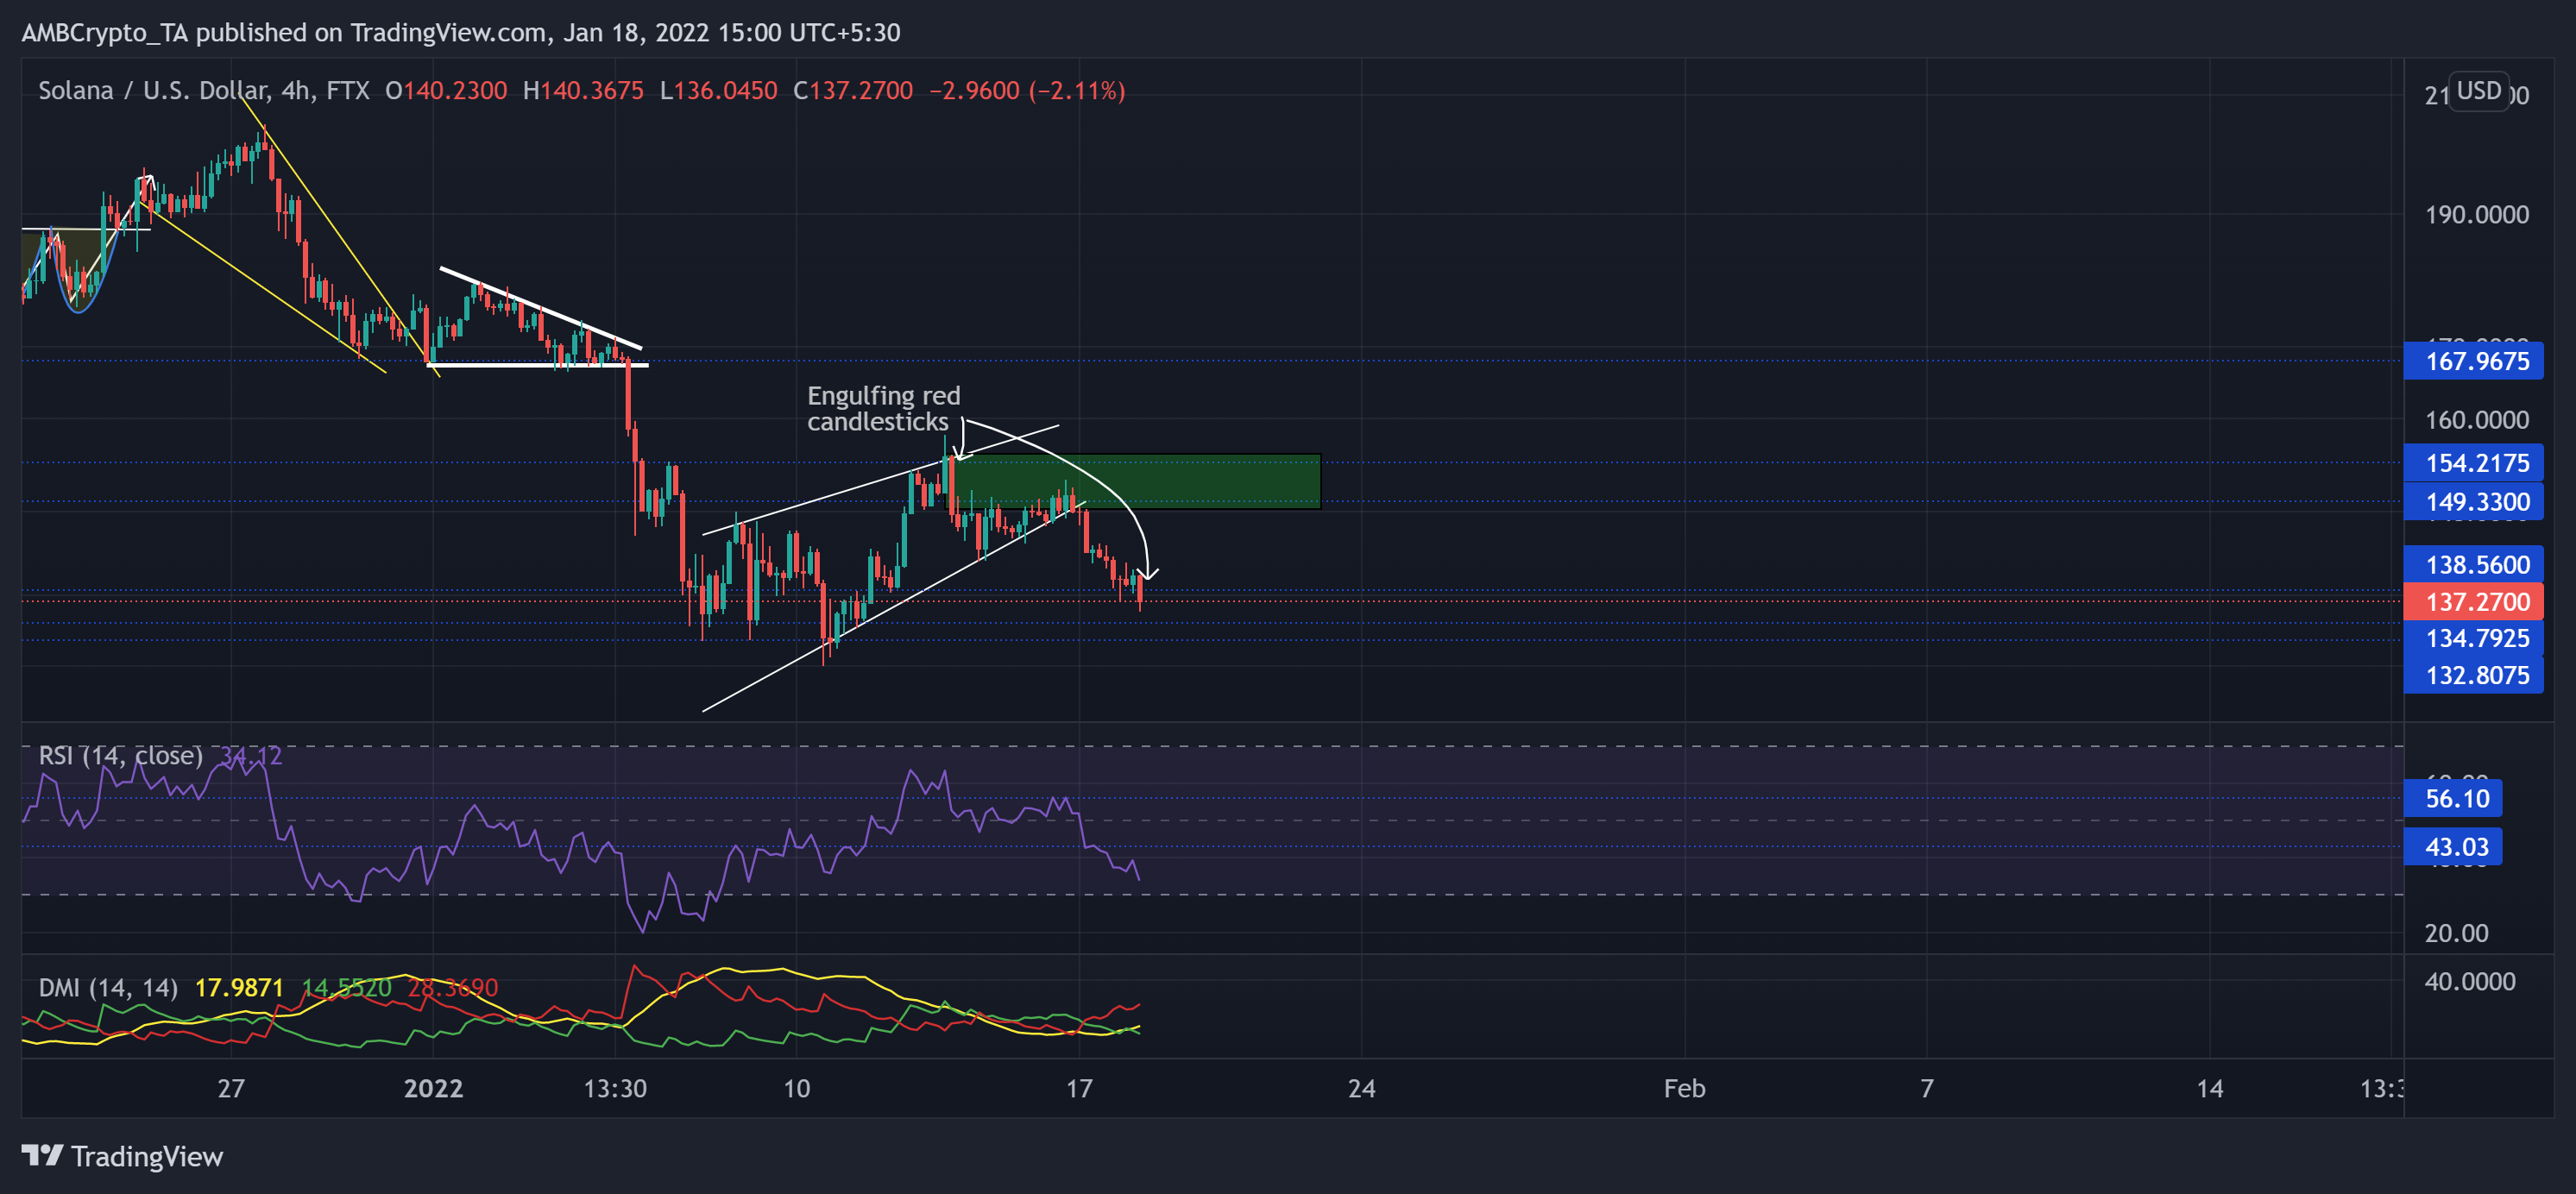
Source: TradingView, SOL/USD
Since the buyers failed to step in at the $167-level, the alt saw an over 23% retracement (from 5 January). Thus, it poked its 15-week low on 10 January. SOL formed a rising wedge (white) on its 4-hour chart and saw a breakdown over the past two days. Since it saw a red engulfing candlestick on 13 January, the bulls struggled to cross the $149-resistance.
The crypto marked another red engulfing candlestick on 18 January after losing the $138.5-level. This reading reaffirmed the increased bearish influence. While the immediate supply zone (rectangle, green) stood sturdy, any further retracements would find support at the $134.79-mark.
At press time, the alt traded at $137.27. It was vital for the buyers to uphold the 43 RSI mark. As they failed, the RSI was southbound toward the oversold region. Also, the DMI confirmed a bearish preference. Nevertheless, the ADX (directional trend) was still weak.
Near Protocol (NEAR)
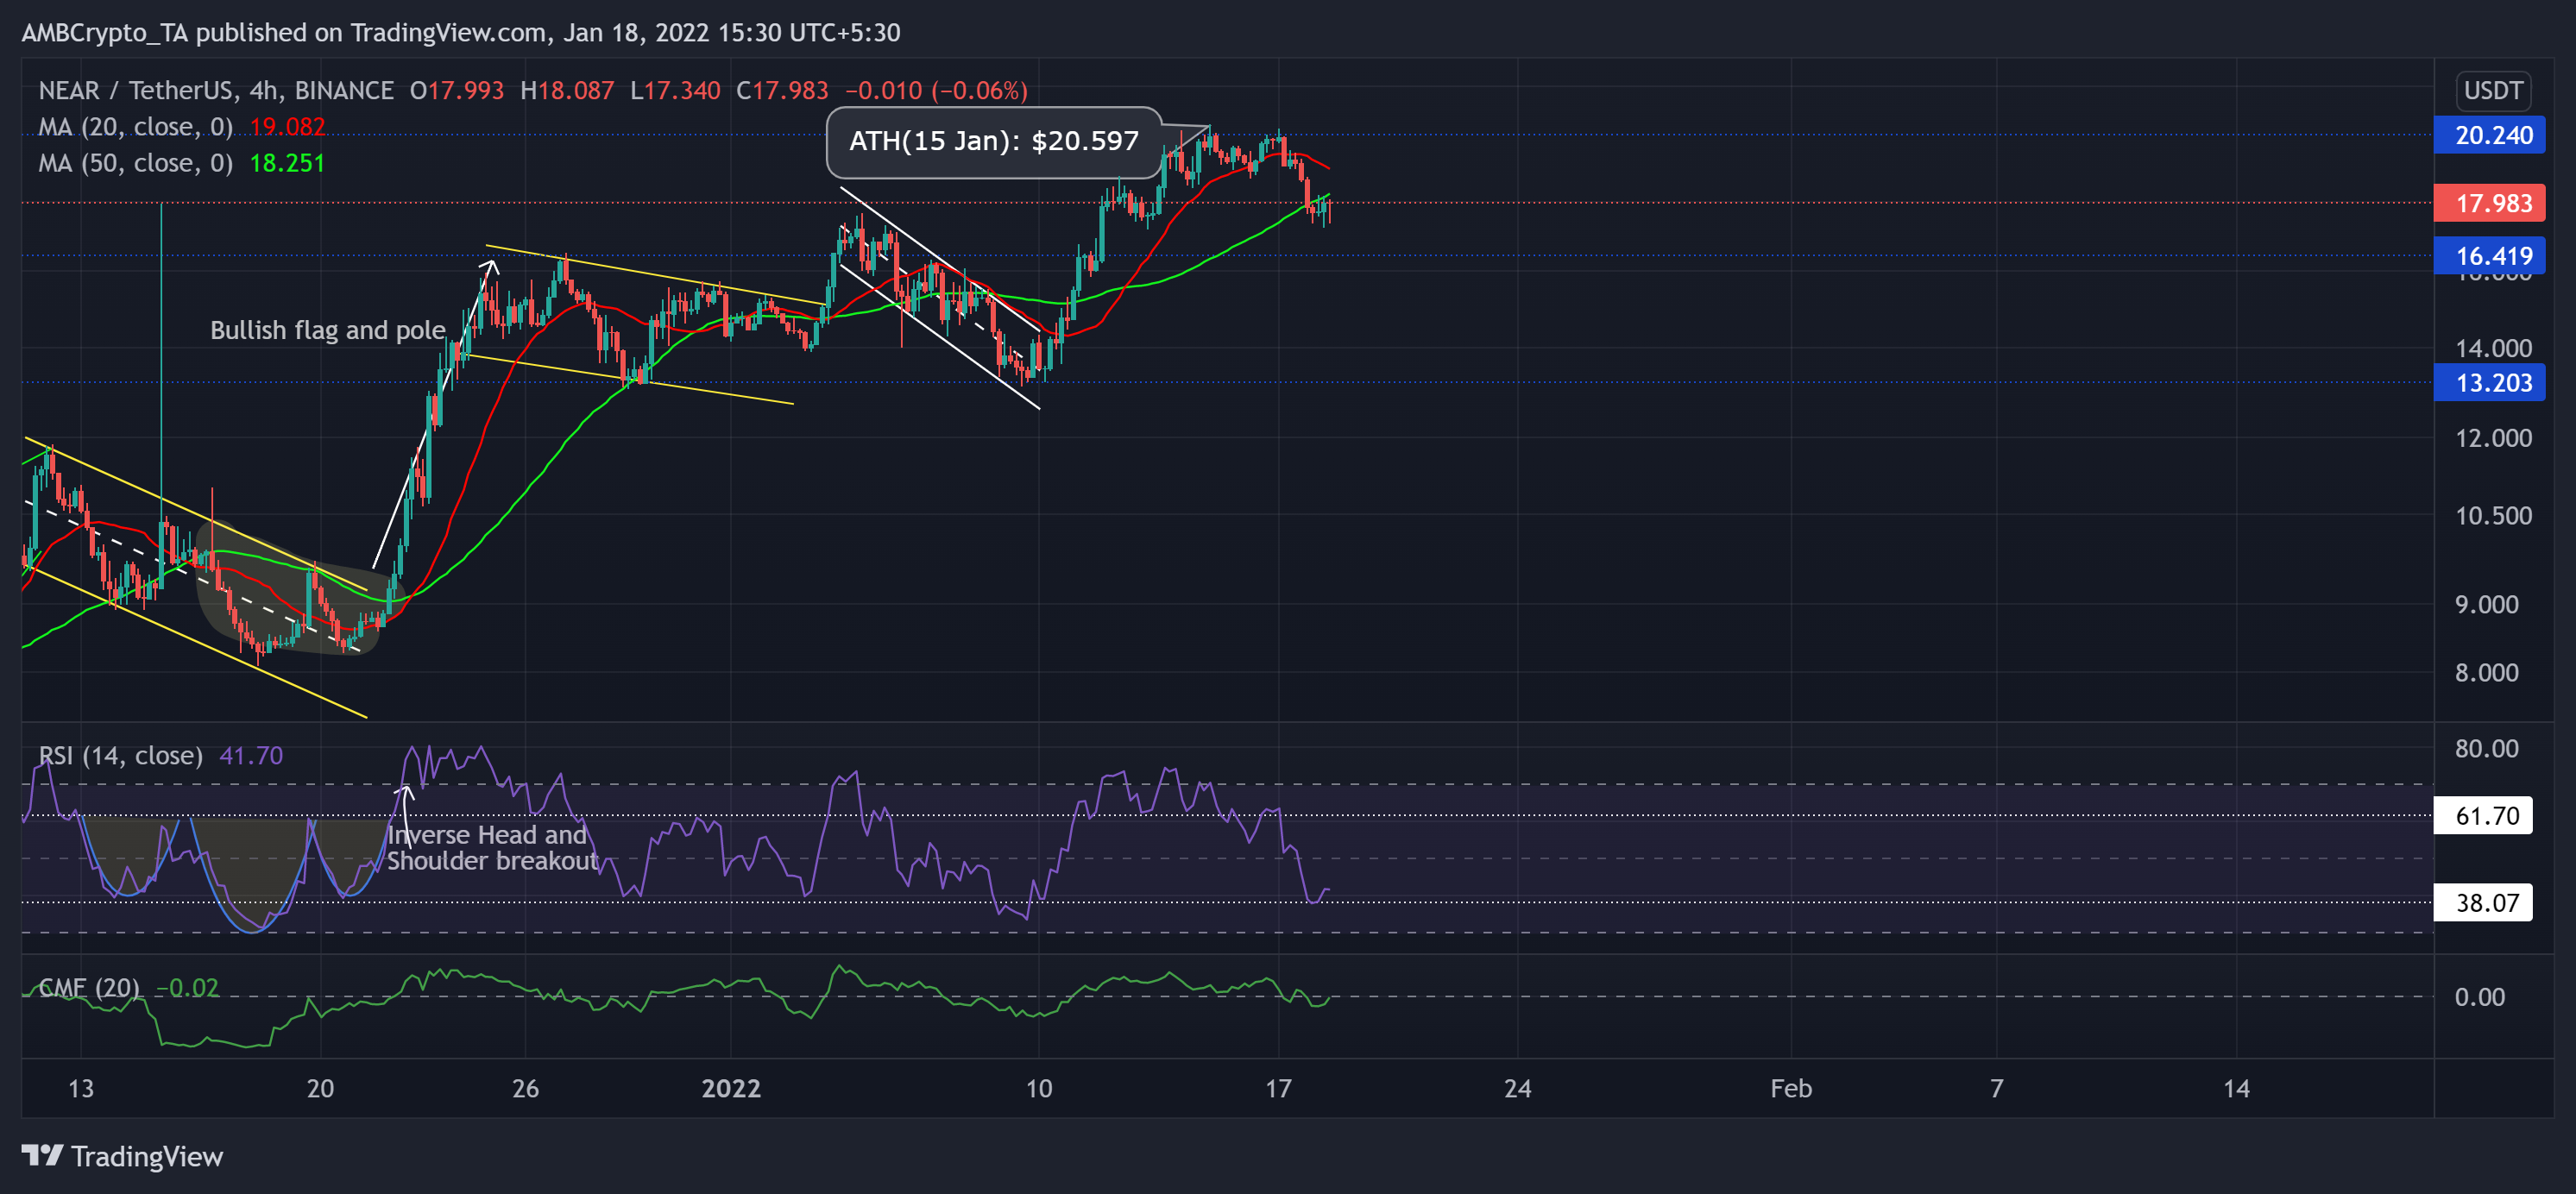
Source: TradingView, NEAR/USDT
NEAR broke out of the down-channel (yellow) after an inverse head and shoulder on its RSI. It marked exponential gains by forming a bullish flag and pole on its 4-hour chart.
Then, as the bulls ensured the $13.2-mark support, NEAR saw a patterned breakout and entered into price discovery. The alt saw an exceptional 147.57% ROI (from 20 December low) to poke its ATH at $20.597 on 15 January.
Over the past three days, the alt retraced by over 12% and dipped below its 20-50 SMA. This reading pointed at decreasing buying influence.
At press time, the alt traded at $17.983. The RSI took a 20 point plunge and confirmed the bearish vigor. Also, the CMF marked lower peaks and troughs in the last two days. This reading hinted at decreasing money volumes for the alt.
EOS
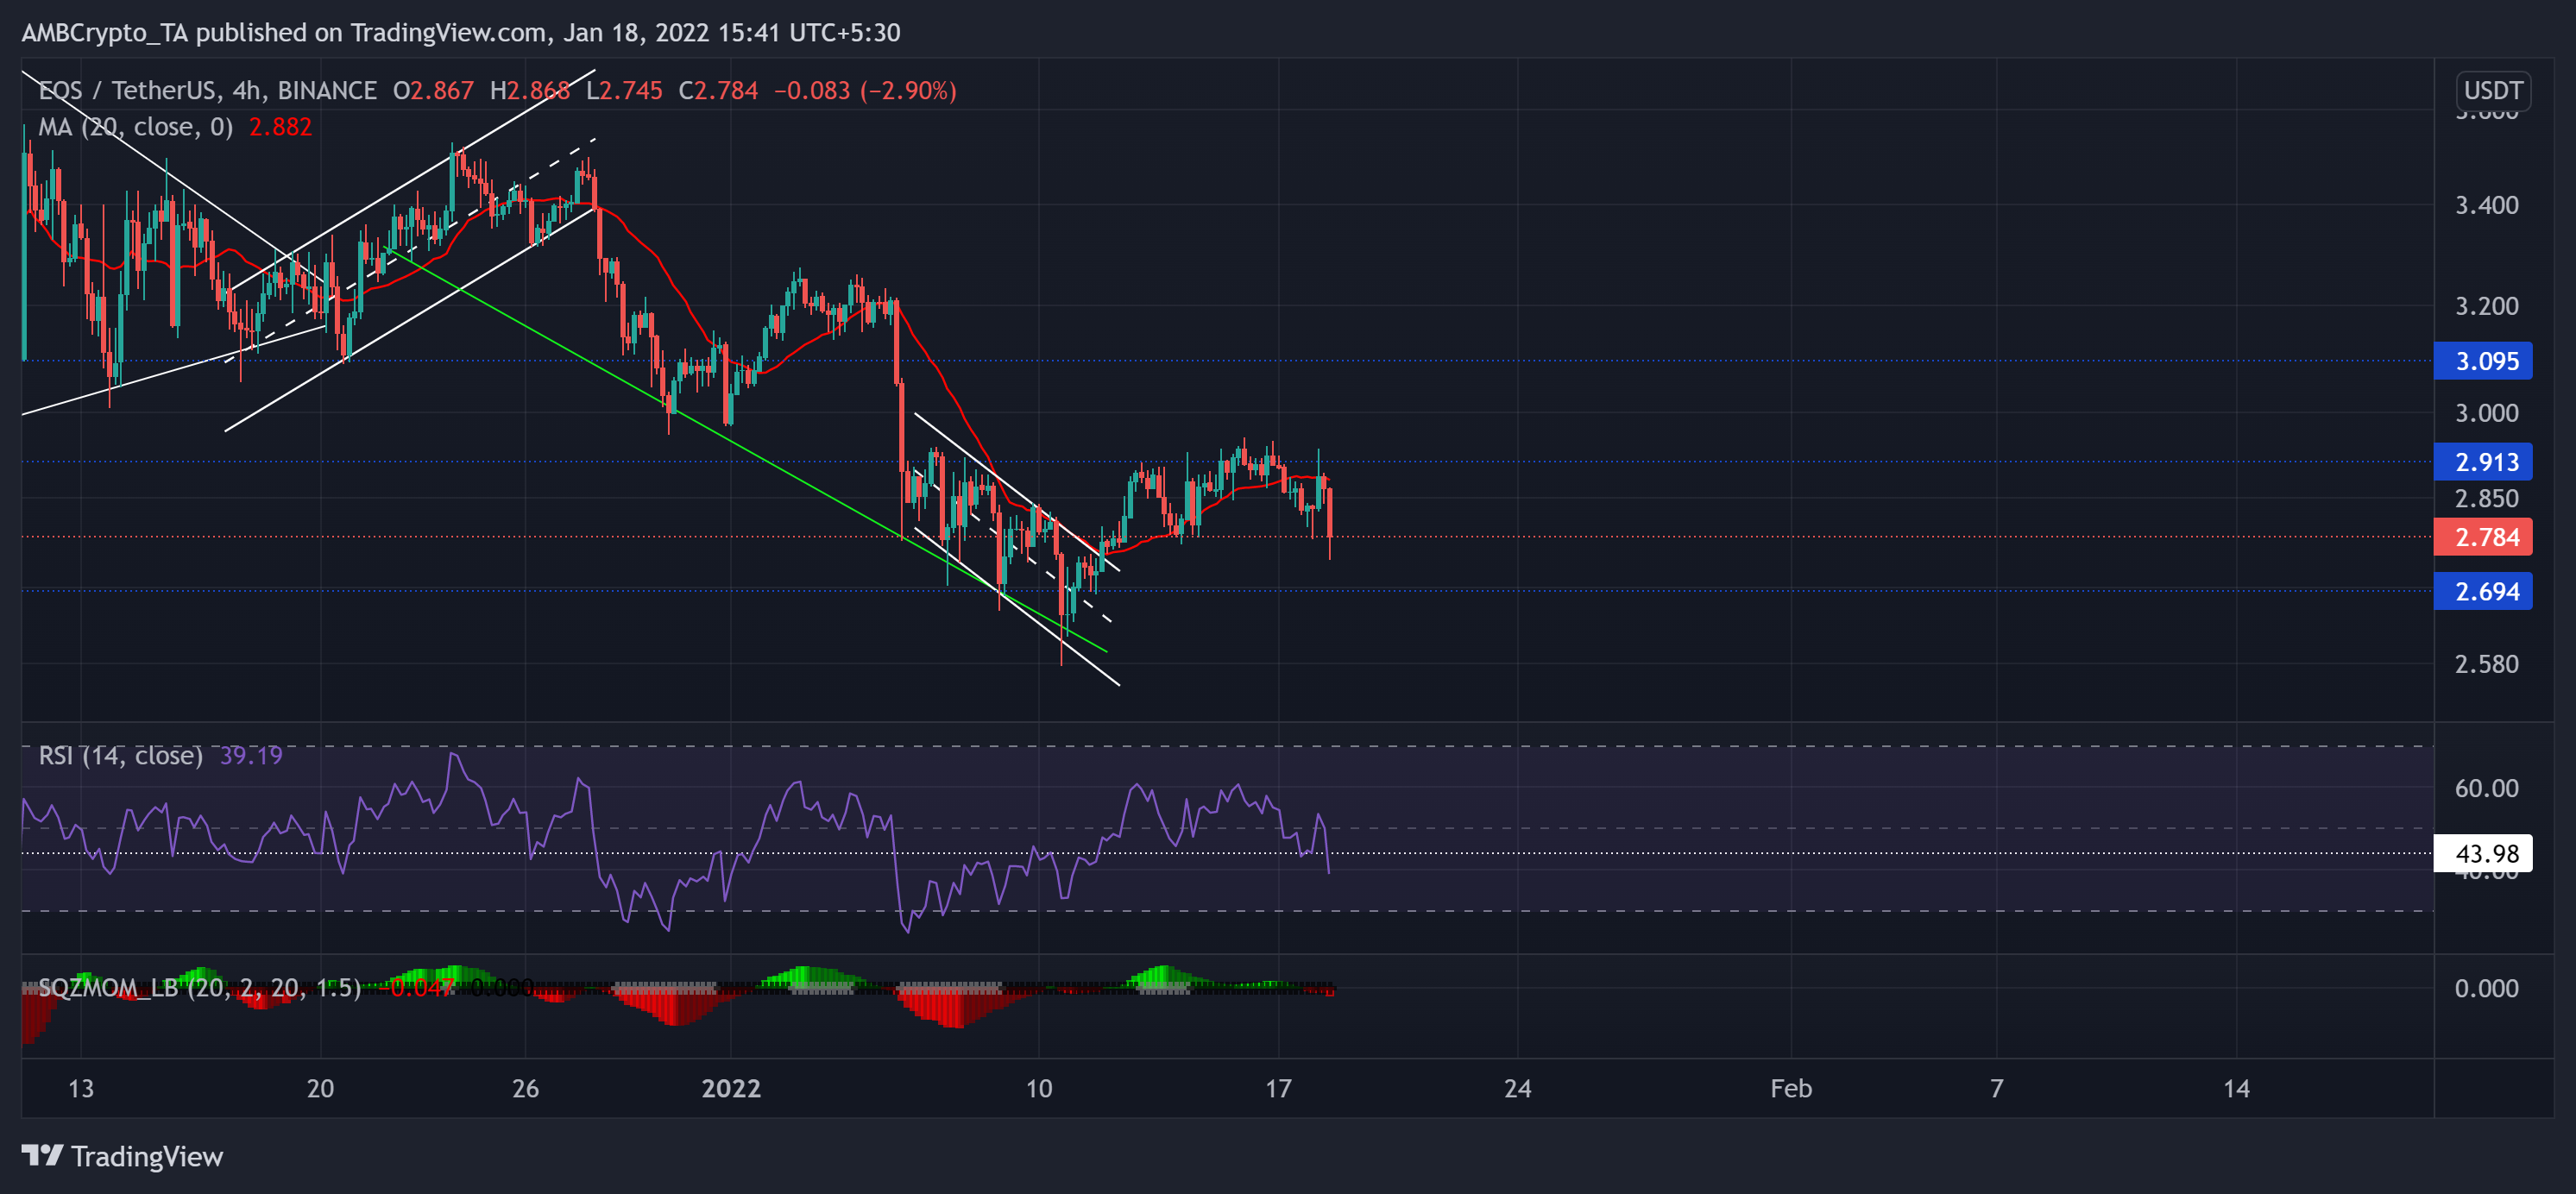
Source: TradingView, EOS/USDT
With a 19.9% retracement (from 5 January), the alt flipped the vital $2.9-mark support to resistance over the past few days. After poking its five-week low on 10 January, EOS marked an over 14% recovery but continued face resistance at the aforementioned mark.
Now, the 20-SMA (red) stood as an immediate hurdle for the bulls while the near-term technical indications preferred the sellers.
At press time, EOS was trading at $2.784. The RSI was southbound after losing the 43-level support. Unless the buyers step in to initiate a reversal, RSI eyed to retest the oversold region. Nevertheless, the Squeeze Momentum still flashed black dots, hinting at a low volatility phase.