Altcoin
Cardano, Avalanche, Algorand Price Analysis: 17 January
Cardano defied the large-cap altcoins’ trajectory by noting double-digit gains over the past day. It witnessed record-high volumes and now saw overbought readings on RSI and Bollinger Bands.
Contrarily, Avalanche and Algorand flashed bearish near-term technicals.
Cardano (ADA)
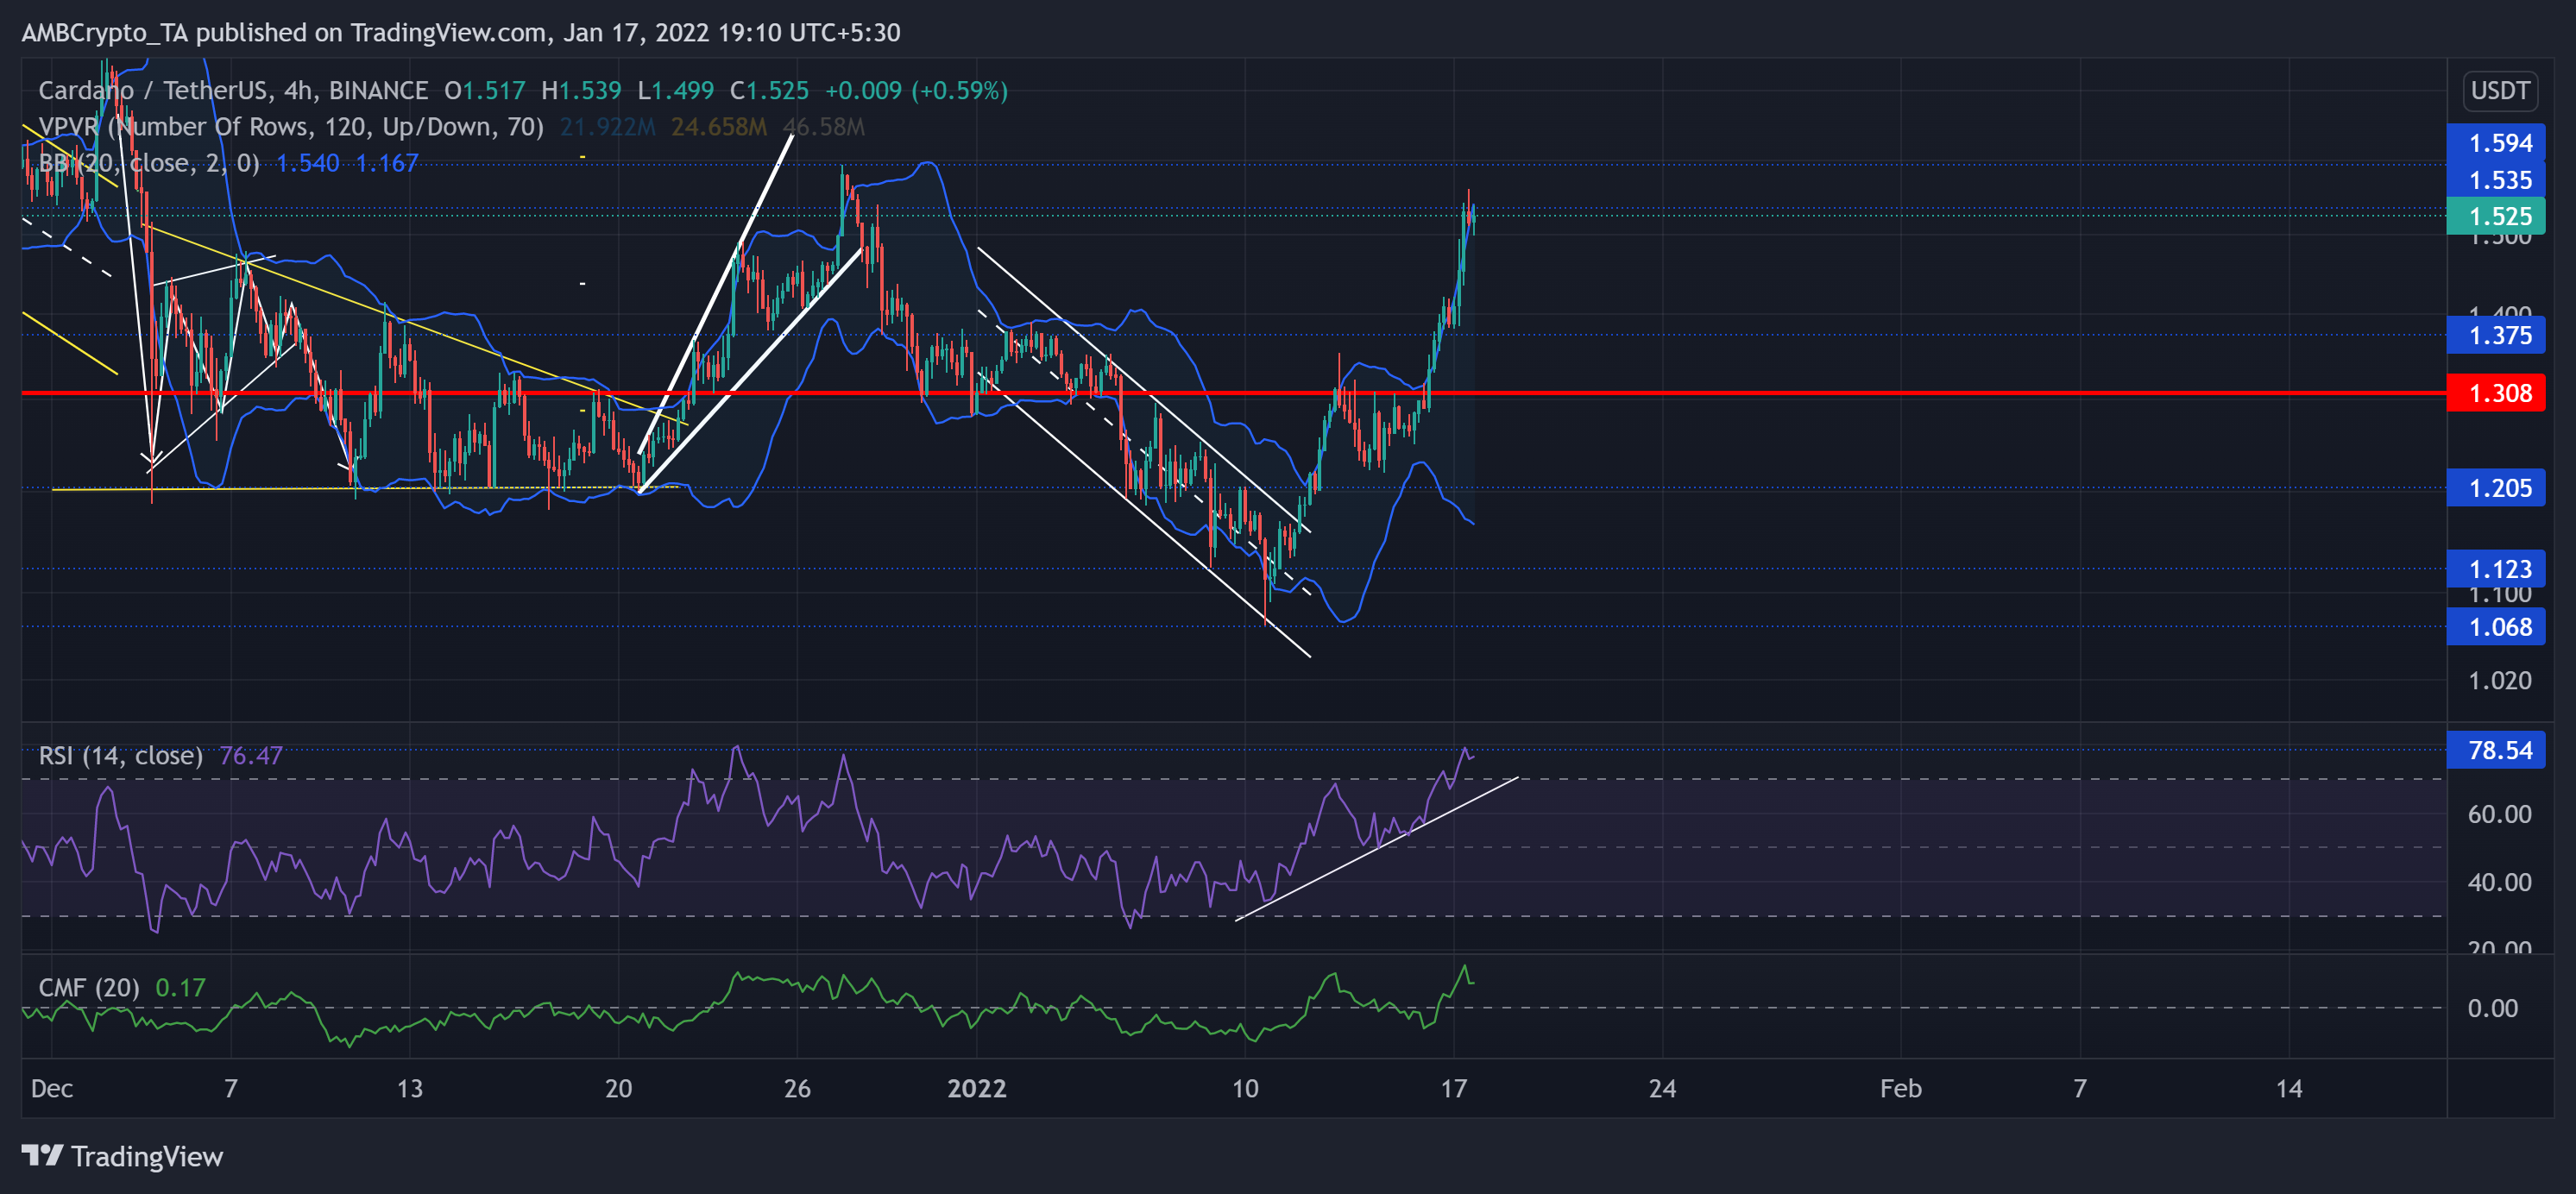
Source: TradingView, ADA/USDT
ADA managed to bag the spot of the fifth largest crypto with its recent gains after its market cap exceeded $49.4 billion over the past day. The bull rally initiated after the alt reversed from the crucial $1.12-mark support.
During the ascent, ADA tested the Point of Contol (red) that offered the highest liquidity for over three months near the $1.3-mark. After retesting it thrice, it rapidly grew by marking eight green candles out of the last 10 candlesticks. The anticipation of the launch of the DEX SundaeSwap on its platform immensely contributed to the recovery.
While the altcoin noted a 42.41% weekly ROI, it pulled back from the $1.53-resistance. At press time, ADA traded at $1.525.
The RSI was still in an uptrend and eyed to retest the 78-resistance. Also, the CMF saw an exponential spike in money flows over the past day. Any close below the upper band of the Bollinger Bands would hint at a potential slowdown in the near term.
Avalanche (AVAX)
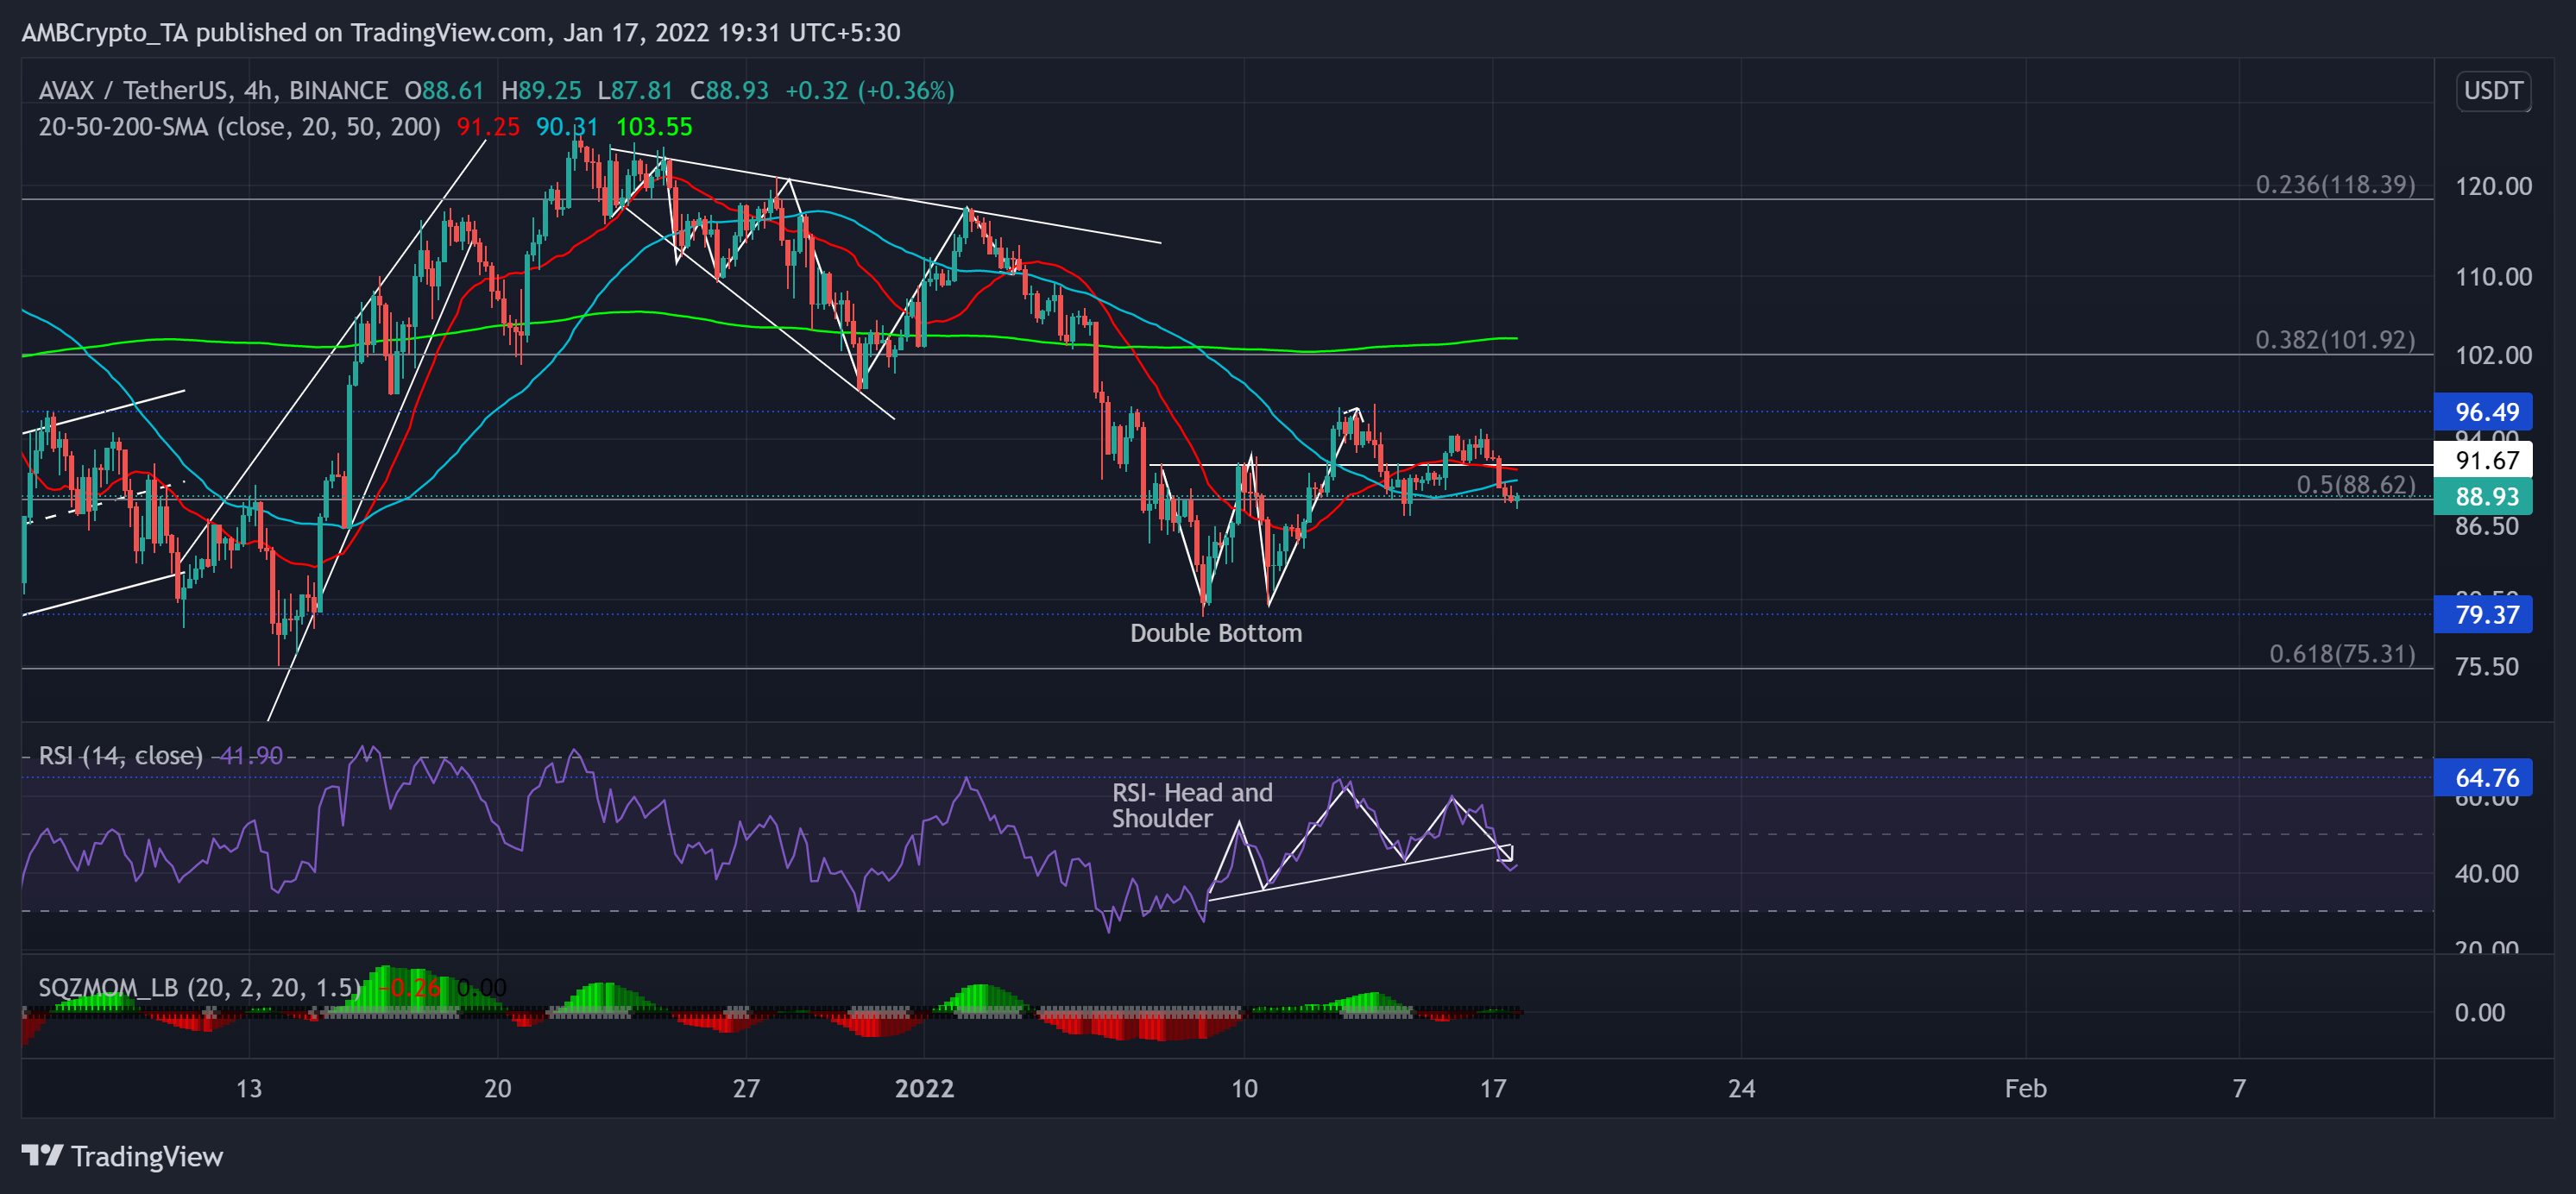
Source: TradingView, AVAX/USDT
AVAX noted a staggering 67.8% ROI (from 13 December low) to poke its three-week high on 22 December. Since then, the alt steadily lost its bullish vigor. It saw a 37.58% retracement and tested the $79.3-support.
Over the past week, the double-bottom breakout on its 4-hour chart reversed from the $96.4-level. It found support at the 50% Fibonacci level. Now, the immediate testing point for bulls stood at the 50-SMA (cyan).
At press time, the alt traded below its 20-50-200 SMA at $88.93. After falling below its trendline support, the RSI confirmed the head and shoulder (bearish) pattern on its 4-hour chart. However, the Squeeze Momentum indicator flashed a low volatility phase.
Algorand (ALGO)
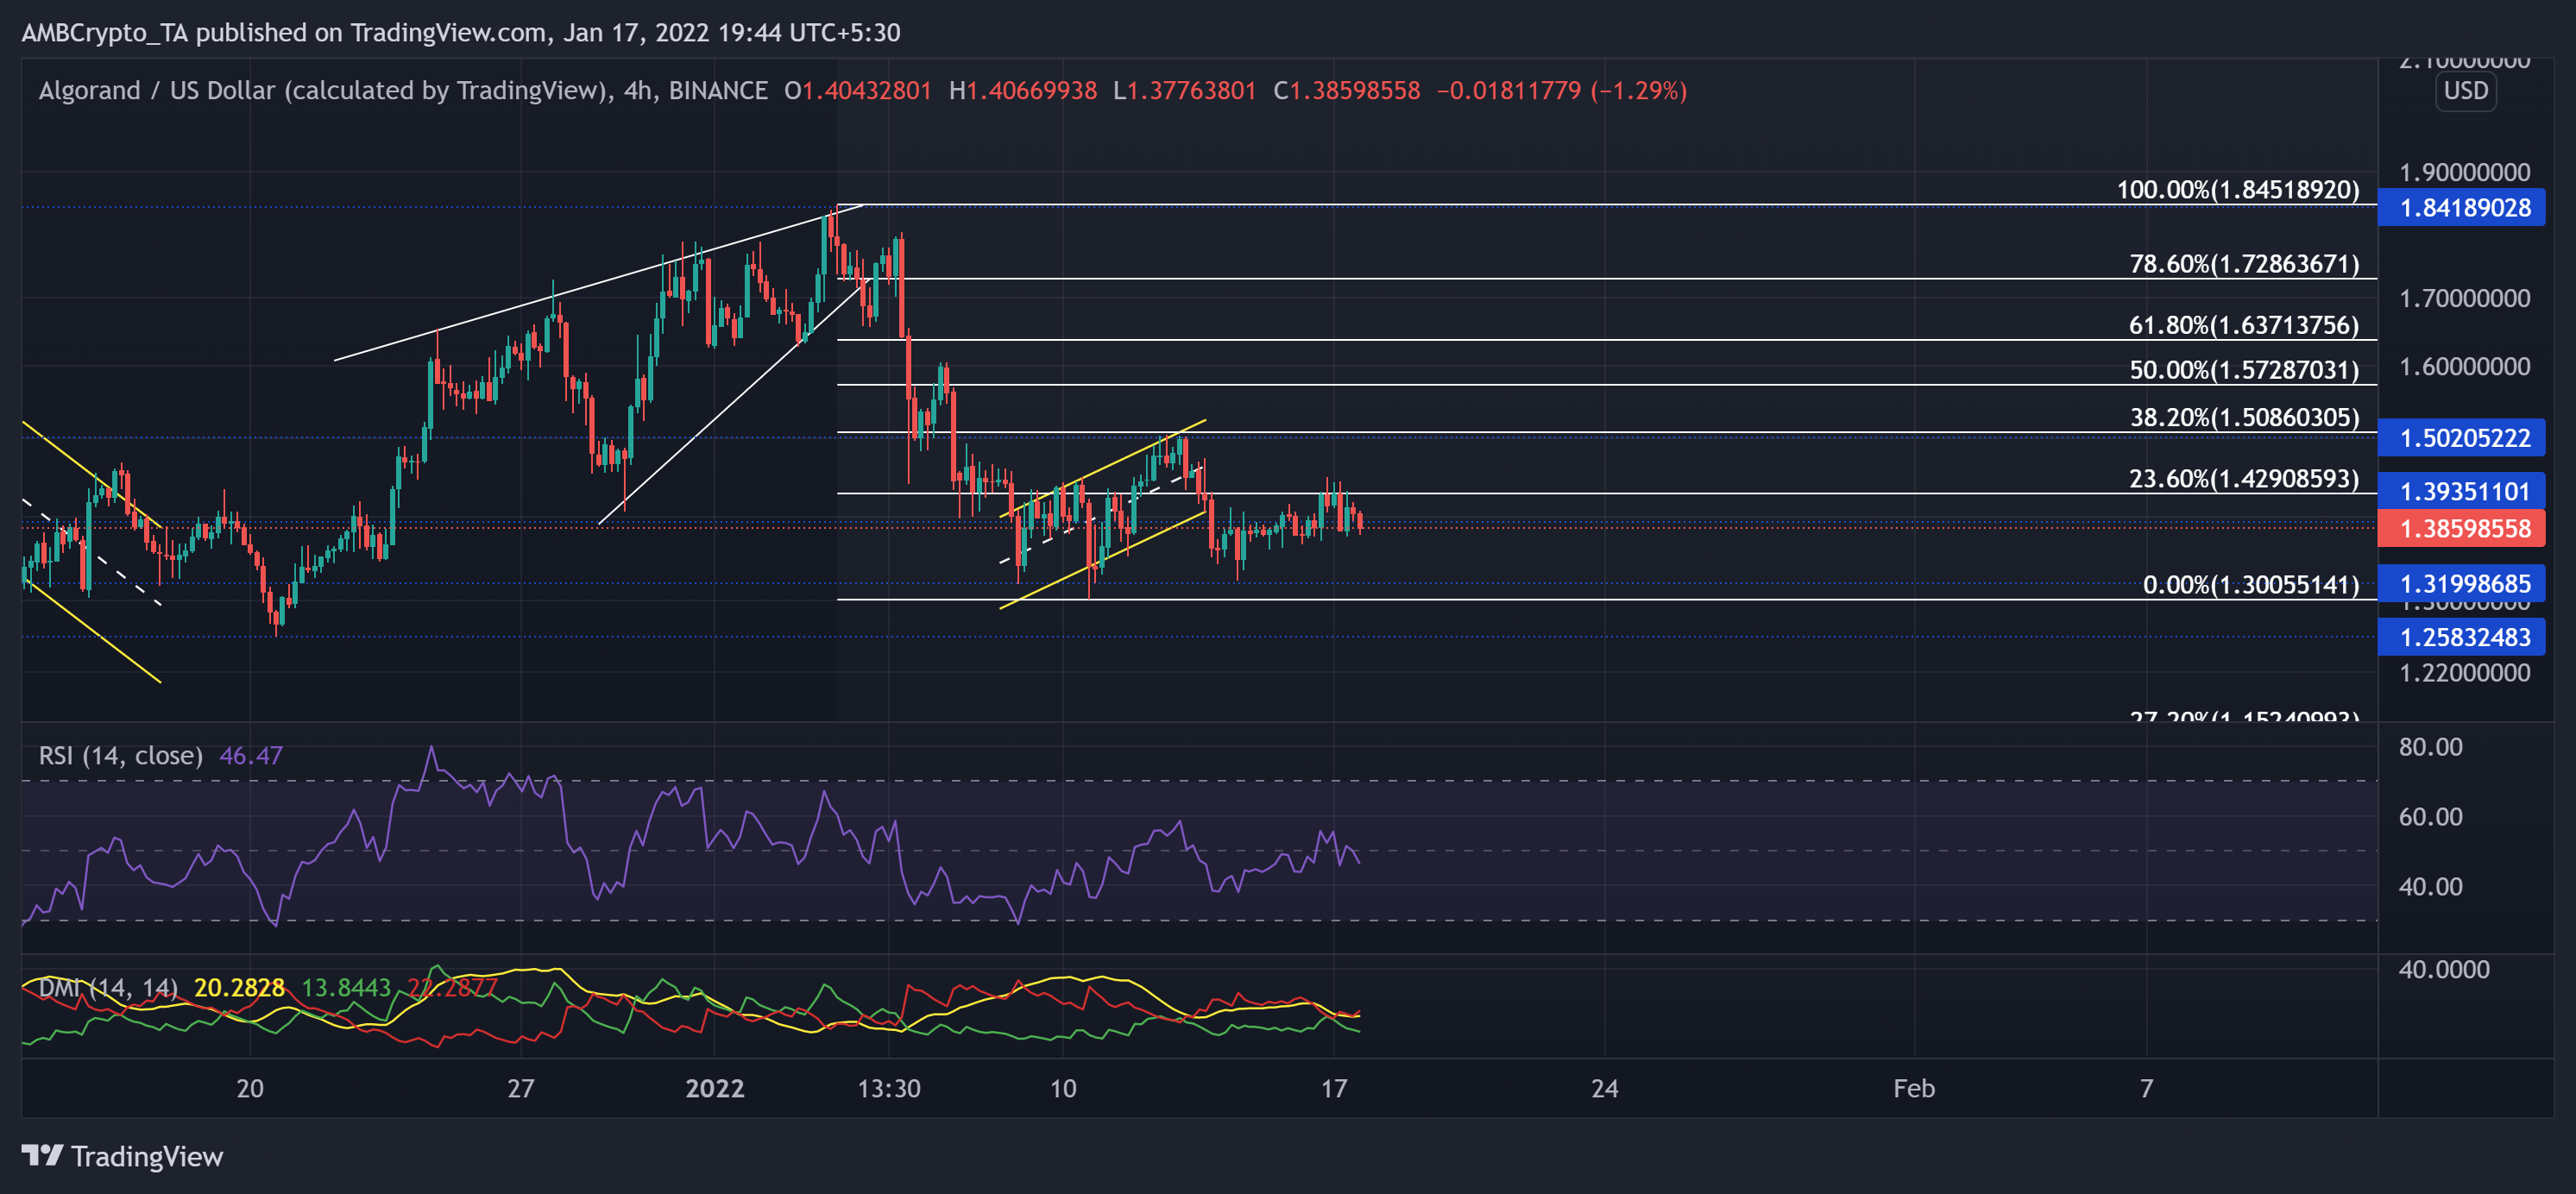
Source: TradingView, ALGO/USD
The 5 January sell-off fueled the rising wedge breakdown while the sellers exerted increased pressure. As a result, the alt lost nearly 30% of its value (from 4 January) until 10 January.
As the $1.3-mark support stood strong, the alt saw an up-channel (yellow) recovery. But it was short-lived by the 38.2% Fibonacci resistance. The up-channel breakdown lost the above level and now tested the 23.6% level over the past day.
At press time, ALGO traded at $1.386. The RSI stood at the 45-mark and still could not sustain itself above the midline. Meanwhile, the DMI supported the bears, but the ADX displayed a weak directional trend.