


Photo Credit: Trzykropy / Shutterstock
The COVID-19 pandemic dramatically increased the amount of time young people spent in front of screens. With classroom instruction shifted online and in-person social activities limited, children and teens spent more time than ever in front of computers, phones, TV, and other devices. According to one study, screen time doubled for adolescents during the pandemic, from 3.8 hours to 7.7 hours per day.
The unique conditions of the pandemic made increased screen time a practical necessity for young people. But this reality also complicated a longtime conundrum for families: the right amount of time for children to spend with television, computers, phones, and tablets. For decades, parents and caregivers have feared adverse effects of technology on students’ physical and mental health, socialization, and cognitive ability while also recognizing the need to allow students to engage with modern life.
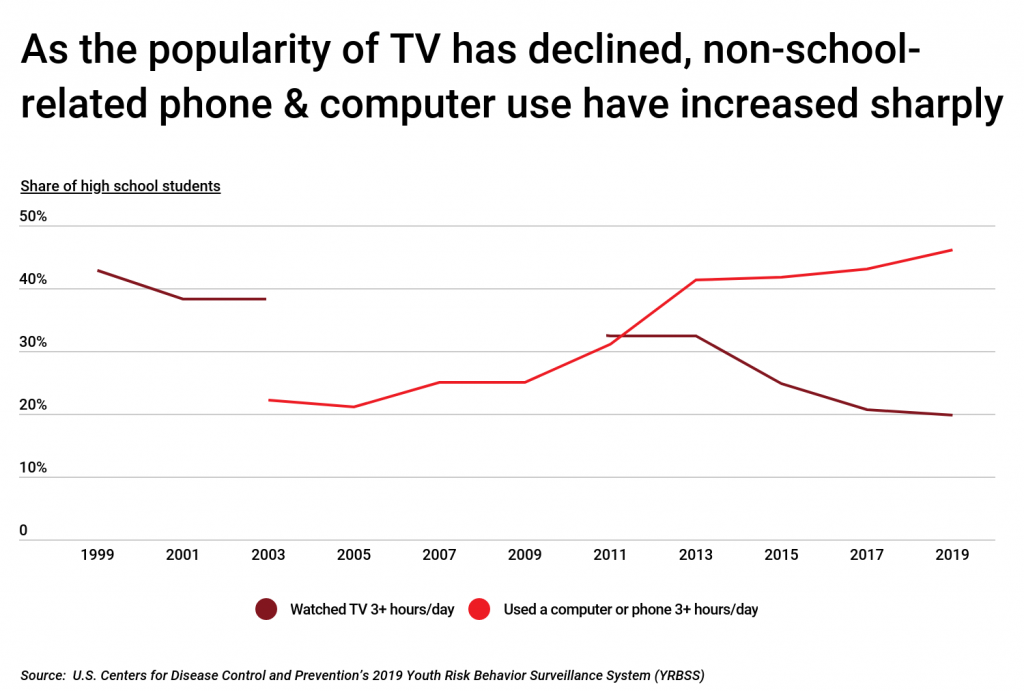
The nature of this challenge has shifted over the last generation, as time spent with television has declined and time spent with computers, phones, and tablets has risen. Computers and phones have clearly taken the place of television as a source of preoccupation for teenagers: in 1999, 42.8% of high school students reported watching television more than three hours per day, but that number is now only 19.8%. In 2003, only 22.1% of high school students used a computer or phone more than three hours per day, but that figure has more than doubled since then, to 46.1% in 2019. These numbers began to accelerate dramatically following the release of the iPhone in 2007 and the ensuing boom in the smartphone market.
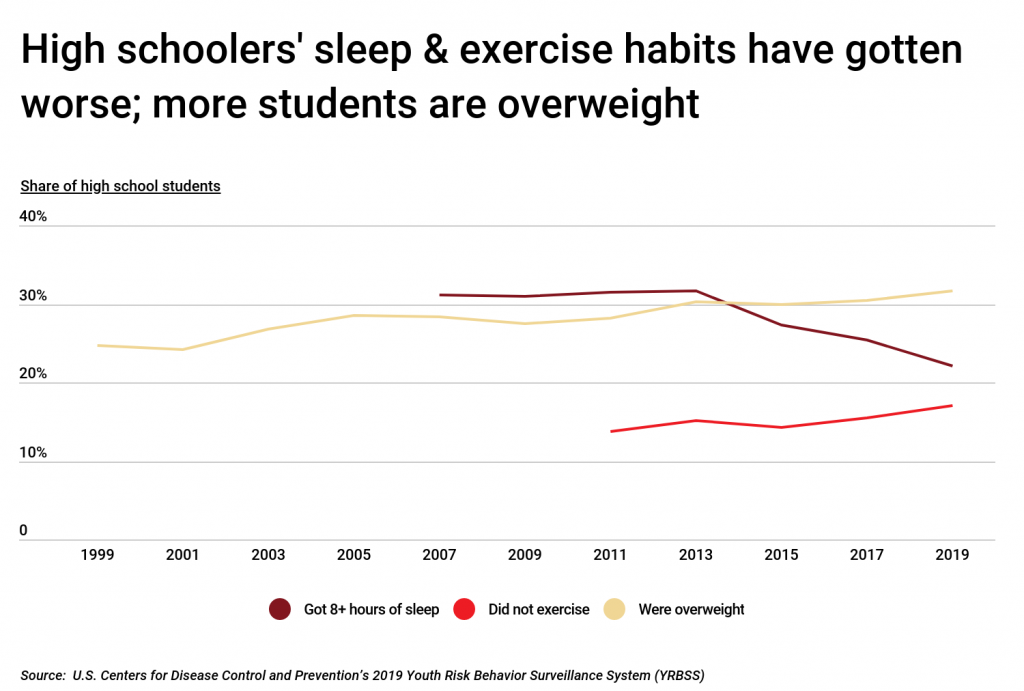
These recent trends are somewhat concerning because of simultaneous shifts in students’ health. From 1999 to 2019, the share of high school students who were considered overweight or obese rose from 24.7% to 31.6%. The share of students getting more than 8 hours of sleep a night declined from 31.1% in 2007 to 22.1% in 2019, while the percentage of students who did not exercise increased from 13.8% in 2011 to 17% in 2019. And health researchers have found evidence to suggest that these phenomena are linked with increased device usage: students who use smartphones the most are much more likely to be obese, and screen time contributes to insomnia by disrupting the body’s natural circadian rhythms.
While the decline in TV watching compared to computer and phone usage is a nationwide phenomenon, some states still have relatively high rates of television usage among high school students. Many of these states are located in the Southern U.S., led by Mississippi (27.6% of students watching more than three hours of TV per day), Louisiana (24.6%), and Tennessee (23.5%).
The data used in this analysis is from the U.S. Centers for Disease Control and Prevention’s Youth Risk Behavior Surveillance System. To determine the states where high school students watch the most television, researchers at KTCB calculated the percentage of students who reported watching three or more hours of television on an average school day. In the event of a tie, non-school computer and phone use on an average school day—including social media, video games, texting, and watching videos—was considered. Researchers also included statistics on students’ exercise, weight, and sleep habits. Only 36 states with available data from YRBSS were included in the analysis.
Here are the states where high schoolers watch the most TV.
States Where Students Watch the Most Television

Photo Credit: Sean Pavone / Shutterstock
15. Virginia
- Share of students who watched TV 3+ hours/day: 20.4%
- Share of students who used a computer/phone 3+ hours/day: 44.8%
- Share of students who did not exercise: 17.3%
- Share of students who were overweight: 30.6%
- Share of students who got 8+ hours of sleep: 25.4%

Photo Credit: Sean Pavone / Shutterstock
14. West Virginia
- Share of students who watched TV 3+ hours/day: 20.8%
- Share of students who used a computer/phone 3+ hours/day: 41.7%
- Share of students who did not exercise: 14.7%
- Share of students who were overweight: 39.4%
- Share of students who got 8+ hours of sleep: 19.2%

Photo Credit: Sean Pavone / Shutterstock
13. Maine
- Share of students who watched TV 3+ hours/day: 20.9%
- Share of students who used a computer/phone 3+ hours/day: 43.5%
- Share of students who did not exercise: 16.0%
- Share of students who were overweight: 29.7%
- Share of students who got 8+ hours of sleep: 28.7%

Photo Credit: Sean Pavone / Shutterstock
12. Texas
- Share of students who watched TV 3+ hours/day: 20.9%
- Share of students who used a computer/phone 3+ hours/day: 46.1%
- Share of students who did not exercise: 20.1%
- Share of students who were overweight: 34.7%
- Share of students who got 8+ hours of sleep: 23.1%

Photo Credit: Sean Pavone / Shutterstock
11. New Mexico
- Share of students who watched TV 3+ hours/day: 21.0%
- Share of students who used a computer/phone 3+ hours/day: 43.1%
- Share of students who did not exercise: 17.2%
- Share of students who were overweight: 31.0%
- Share of students who got 8+ hours of sleep: 27.9%

Photo Credit: Sean Pavone / Shutterstock
10. Kentucky
- Share of students who watched TV 3+ hours/day: 21.3%
- Share of students who used a computer/phone 3+ hours/day: 47.5%
- Share of students who did not exercise: 19.1%
- Share of students who were overweight: 36.2%
- Share of students who got 8+ hours of sleep: 19.4%

Photo Credit: Sean Pavone / Shutterstock
9. South Carolina
- Share of students who watched TV 3+ hours/day: 21.5%
- Share of students who used a computer/phone 3+ hours/day: 40.1%
- Share of students who did not exercise: 20.7%
- Share of students who were overweight: 32.9%
- Share of students who got 8+ hours of sleep: 19.8%

Photo Credit: Sean Pavone / Shutterstock
8. Georgia
- Share of students who watched TV 3+ hours/day: 21.6%
- Share of students who used a computer/phone 3+ hours/day: 41.2%
- Share of students who did not exercise: 20.0%
- Share of students who were overweight: 36.4%
- Share of students who got 8+ hours of sleep: N/A

Photo Credit: Sean Pavone / Shutterstock
7. Florida
- Share of students who watched TV 3+ hours/day: 22.0%
- Share of students who used a computer/phone 3+ hours/day: 47.7%
- Share of students who did not exercise: 21.8%
- Share of students who were overweight: 30.1%
- Share of students who got 8+ hours of sleep: 20.2%

Photo Credit: Sean Pavone / Shutterstock
6. Oklahoma
- Share of students who watched TV 3+ hours/day: 22.3%
- Share of students who used a computer/phone 3+ hours/day: 48.0%
- Share of students who did not exercise: 14.8%
- Share of students who were overweight: 35.7%
- Share of students who got 8+ hours of sleep: 21.1%

Photo Credit: Sean Pavone / Shutterstock
5. Connecticut
- Share of students who watched TV 3+ hours/day: 22.7%
- Share of students who used a computer/phone 3+ hours/day: 47.9%
- Share of students who did not exercise: 17.7%
- Share of students who were overweight: 29.3%
- Share of students who got 8+ hours of sleep: 21.0%

Photo Credit:Sean Pavone / Shutterstock
4. Arkansas
- Share of students who watched TV 3+ hours/day: 22.8%
- Share of students who used a computer/phone 3+ hours/day: 45.5%
- Share of students who did not exercise: 21.6%
- Share of students who were overweight: 41.9%
- Share of students who got 8+ hours of sleep: 21.7%

Photo Credit: Sean Pavone / Shutterstock
3. Tennessee
- Share of students who watched TV 3+ hours/day: 23.5%
- Share of students who used a computer/phone 3+ hours/day: 44.5%
- Share of students who did not exercise: 19.1%
- Share of students who were overweight: 39.2%
- Share of students who got 8+ hours of sleep: 18.5%

Photo Credit: Sean Pavone / Shutterstock
2. Louisiana
- Share of students who watched TV 3+ hours/day: 24.6%
- Share of students who used a computer/phone 3+ hours/day: 40.4%
- Share of students who did not exercise: 25.5%
- Share of students who were overweight: 34.3%
- Share of students who got 8+ hours of sleep: 19.4%

Photo Credit: Sean Pavone / Shutterstock
1. Mississippi
- Share of students who watched TV 3+ hours/day: 27.6%
- Share of students who used a computer/phone 3+ hours/day: 42.7%
- Share of students who did not exercise: 20.4%
- Share of students who were overweight: 41.4%
- Share of students who got 8+ hours of sleep: 25.4%
Methodology & Detailed Findings
The data used in this analysis is from the U.S. Centers for Disease Control and Prevention’s 2019 Youth Risk Behavior Surveillance System (YRBSS). All statistics shown were gathered from representative samples of 9th through 12th grade students in U.S. public and private schools. To determine the states where high school students watch the most television, researchers calculated the percentage of students who reported watching three or more hours of television per day on an average school day. In the event of a tie, non-school computer and phone use on an average school day—including social media, video games, texting, and watching videos—was considered. Researchers also included statistics on students’ exercise, weight, and sleep habits. The share of students who did not exercise represents those high schoolers who did not engage in at least 60 minutes of physical activity on at least one day in the prior week. The share of students who were overweight represents those high schoolers who were at least 85th percentile for body mass index (i.e. overweight or obese). Lastly, sleep statistics are representative of high schoolers’ sleep habits on an average school day. Only 36 states with available data from YRBSS were included in the analysis.