Altcoin
Bitcoin Cash, Cosmos, The Sandbox Price Analysis: 04 December
At a time when Bitcoin hit the $47,000-mark due to a broader market sell-off, Bitcoin Cash and Cosmos dived below their long-term supports to poke their multi-month lows.
Moreover, SAND witnessed over 20% losses but maintained its long-term uptrend.
Bitcoin Cash (BCH)

TradingView, BCH/USDT
BCH had an impressive run from 30 September until the altcoin touched its nine-week high on 10 November. Since then, it started marking lower lows in a descending channel. After a down-channel breakout on 22 November, BCH continually fell and formed a descending triangle (yellow) in its 4-hour chart.
After retesting the $544-mark support for nearly two months, bears were able to invalidate the long-term bullish trend and turn the tide in their favor. They managed to poke BCH’s 11-month low on 3 December. As a result, BCH at $448.9 after noting a 20.9% 24-hour loss.
The RSI saw a steep plunge from the equilibrium level toward the 15-mark. The bulls can bag on the possibility of a near-term push due to the oversold market condition. Further, the MACD and AO consistently lingered below the half-line for the past eight days and affirmed a bearish vigor.
Cosmos (ATOM)
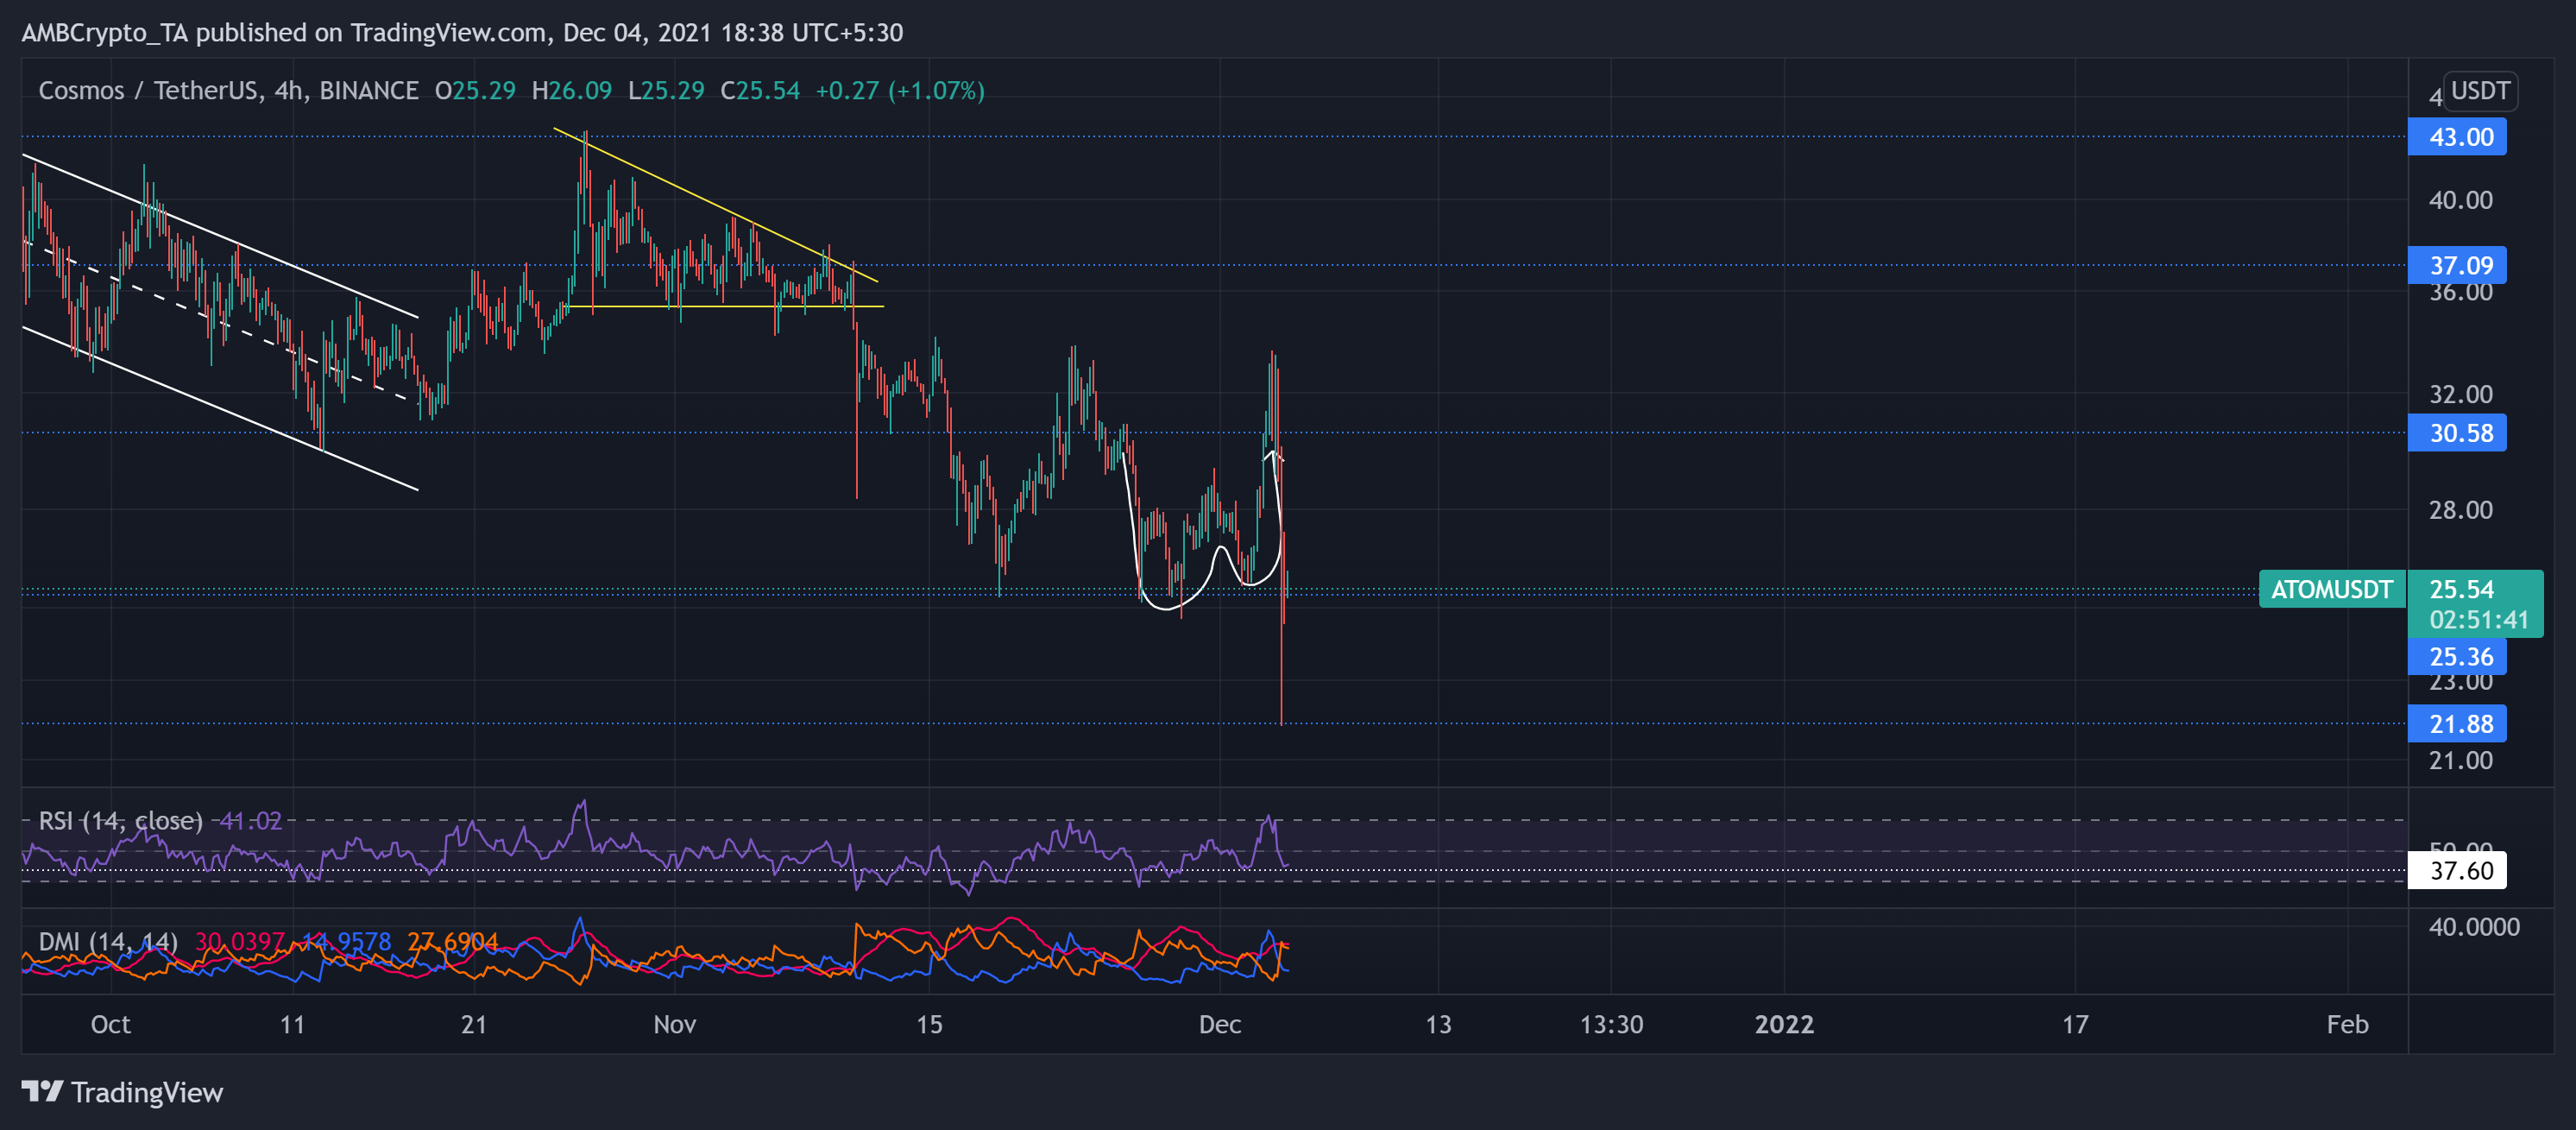
TradingView, ATOM/USDT
After striking its ATH on 20 September, ATOM has performed quite poorly by consistently marking lower troughs since then. Further, the bulls attempted a rally post a down-channel breakout, but the bears historically showed resistance at the $43-mark.
As a result, the price declined and eventually formed a descending triangle (yellow). The bulls failed to uphold the nine-week resistance at the $30.5-mark post a descending triangle breakdown.
Over the past two weeks, ATOM retested the 12-week support at $25.36 thrice. Finally, after a massive sell-off, the bears invalidated the double-bottom (white) and fueled the downtrend.
At press time, ATOM traded at $25.54 after noting a 16.8% 24-hour loss. The RSI undeniably skewed in favor of the sellers, but the bulls maintained the 37.6 near-term RSI support. Also, the DMI displayed slackening signs for the bulls. Now, ATOM would most likely consolidate between the $30.5 and the $25.3-mark for a while.
The Sandbox (SAND)
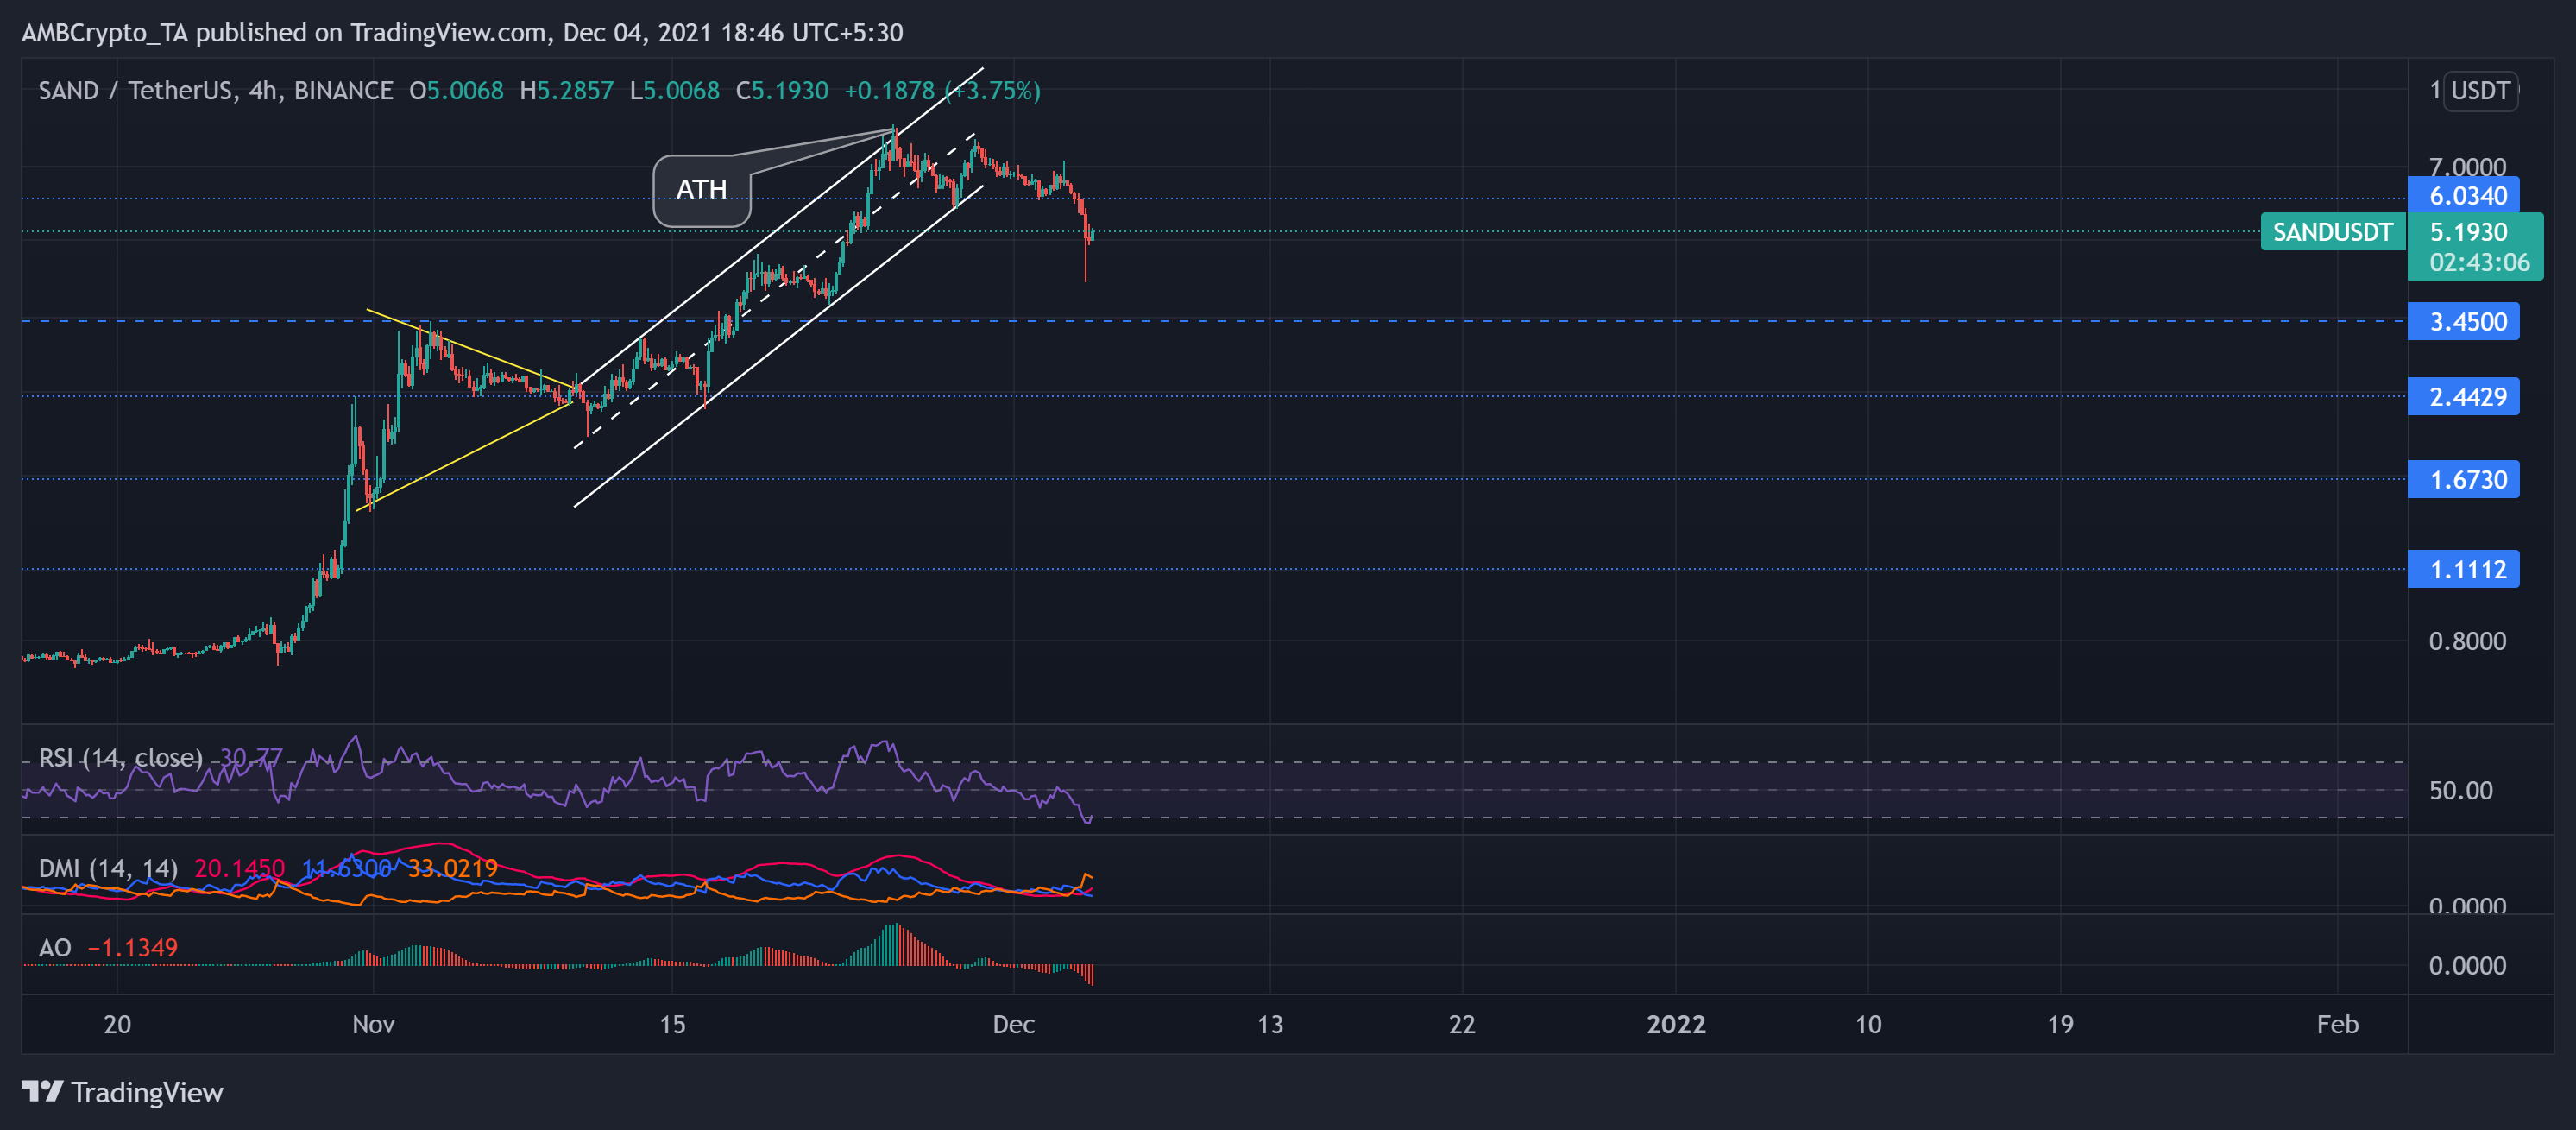
TradingView, SAND/USDT
SAND rallied in an ascending channel post a symmetrical triangle breakout. Then, the alt saw a 315% ROI from 11 November to 25 November. As a result, the price action touched its ATH on 25 November.
However, since then, the bears retested the $6.03-mark twice before a significant slump. This decline led to an up-channel breakdown for the first time in 19 days. At press time, the alt traded at $5.193 after noting a 20.1% 24-hour loss.
This downturn finally correlated with the market trend, unlike its previous rallies. The RSI dipped into the oversold region while showing some revival signs. Further, the DMI and AO displayed a bearish bias. But the ADX depicted a weak directional trend.