Altcoin
Bitcoin Cash, The Sandbox, IOTA Price Analysis: 2 December
As the bulls endeavored to halt the increased bearish control, they struggled to transform their edge into a sustained upswing. Thus, Bitcoin Cash and The Sandbox, after a bullish rally, flashed bearish near-term technicals.
Conversely, IOTA continued its October upturn in an ascending channel and displayed a bullish preference.
Bitcoin Cash (BCH)
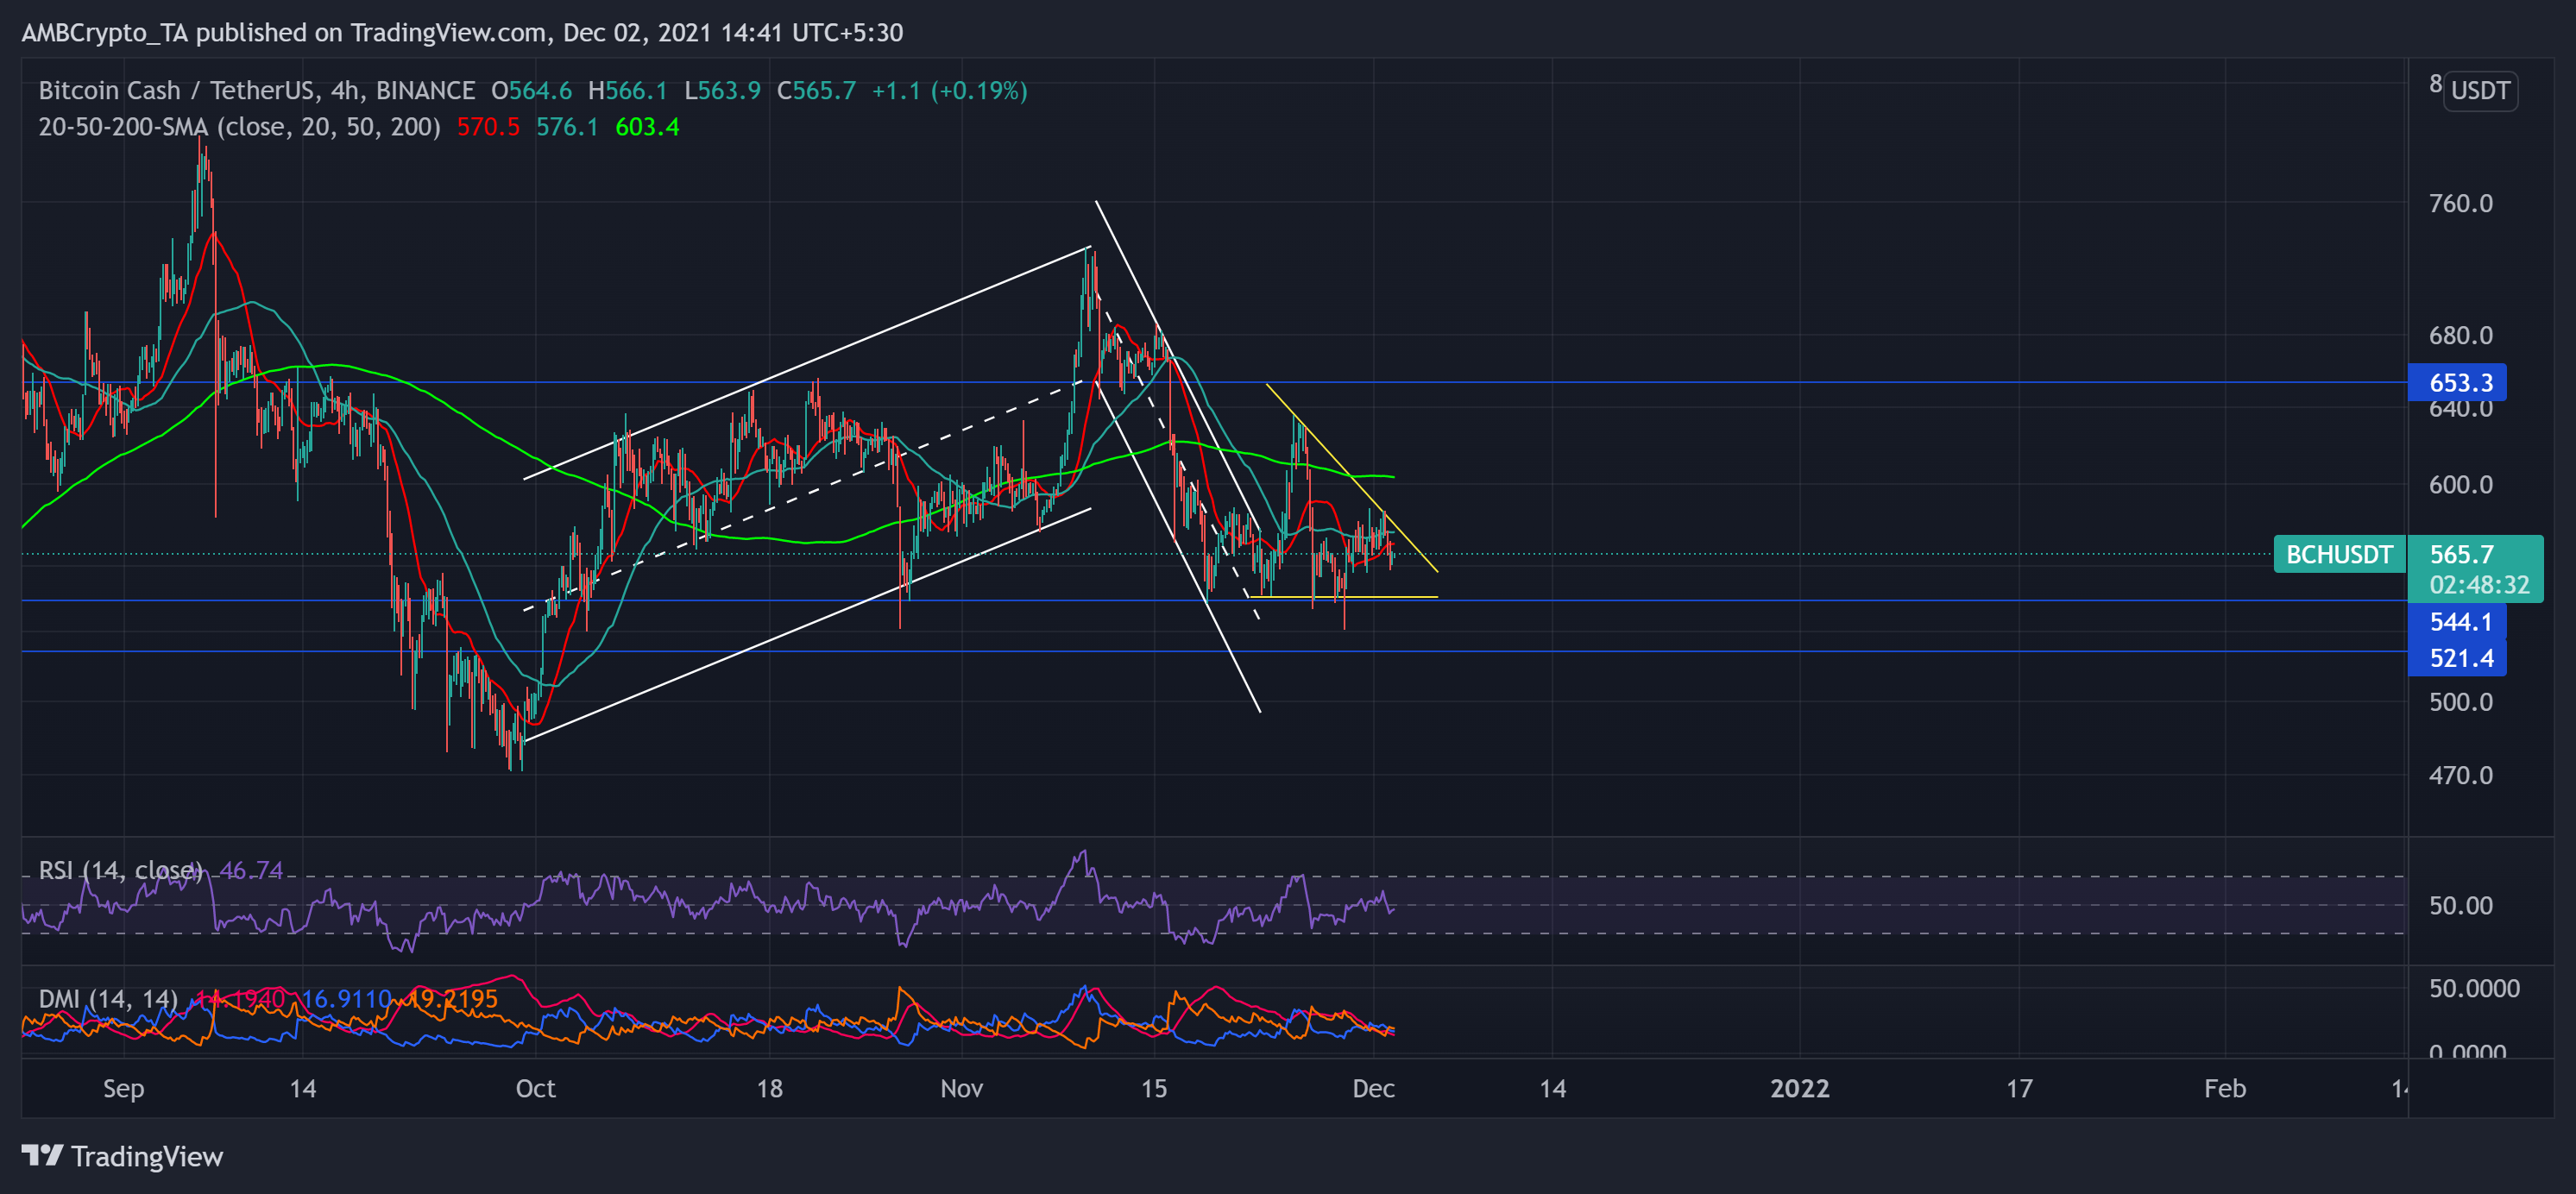
Source: TradingView, BCH/USDT
BCH witnessed a classic ascending channel breakdown as it failed to sustain its October rally. After a 46.9% October and early November ascent, the altcoin touched its nine-week high on 10 November.
However, the bears ensured a pullout at the upper channel. They initiated a 27.2% retracement as BCH hit its one-month low on 28 November. Post a down-channel breakout, BCH bulls could not sustain the upturn as the price slumped after forming a descending triangle (yellow).
For the past two months, bears have been retesting the support at the $544-mark. At press time, BCH traded below its 4-hour 20-50-200 SMA at $565.7, depicting an increased bearish vigor.
The RSI showed revival signs over the past few days but stayed below the midline. Further, the DMI confirmed the bearish vigor, but the ADX displayed a weak directional trend.
The Sandbox (SAND)
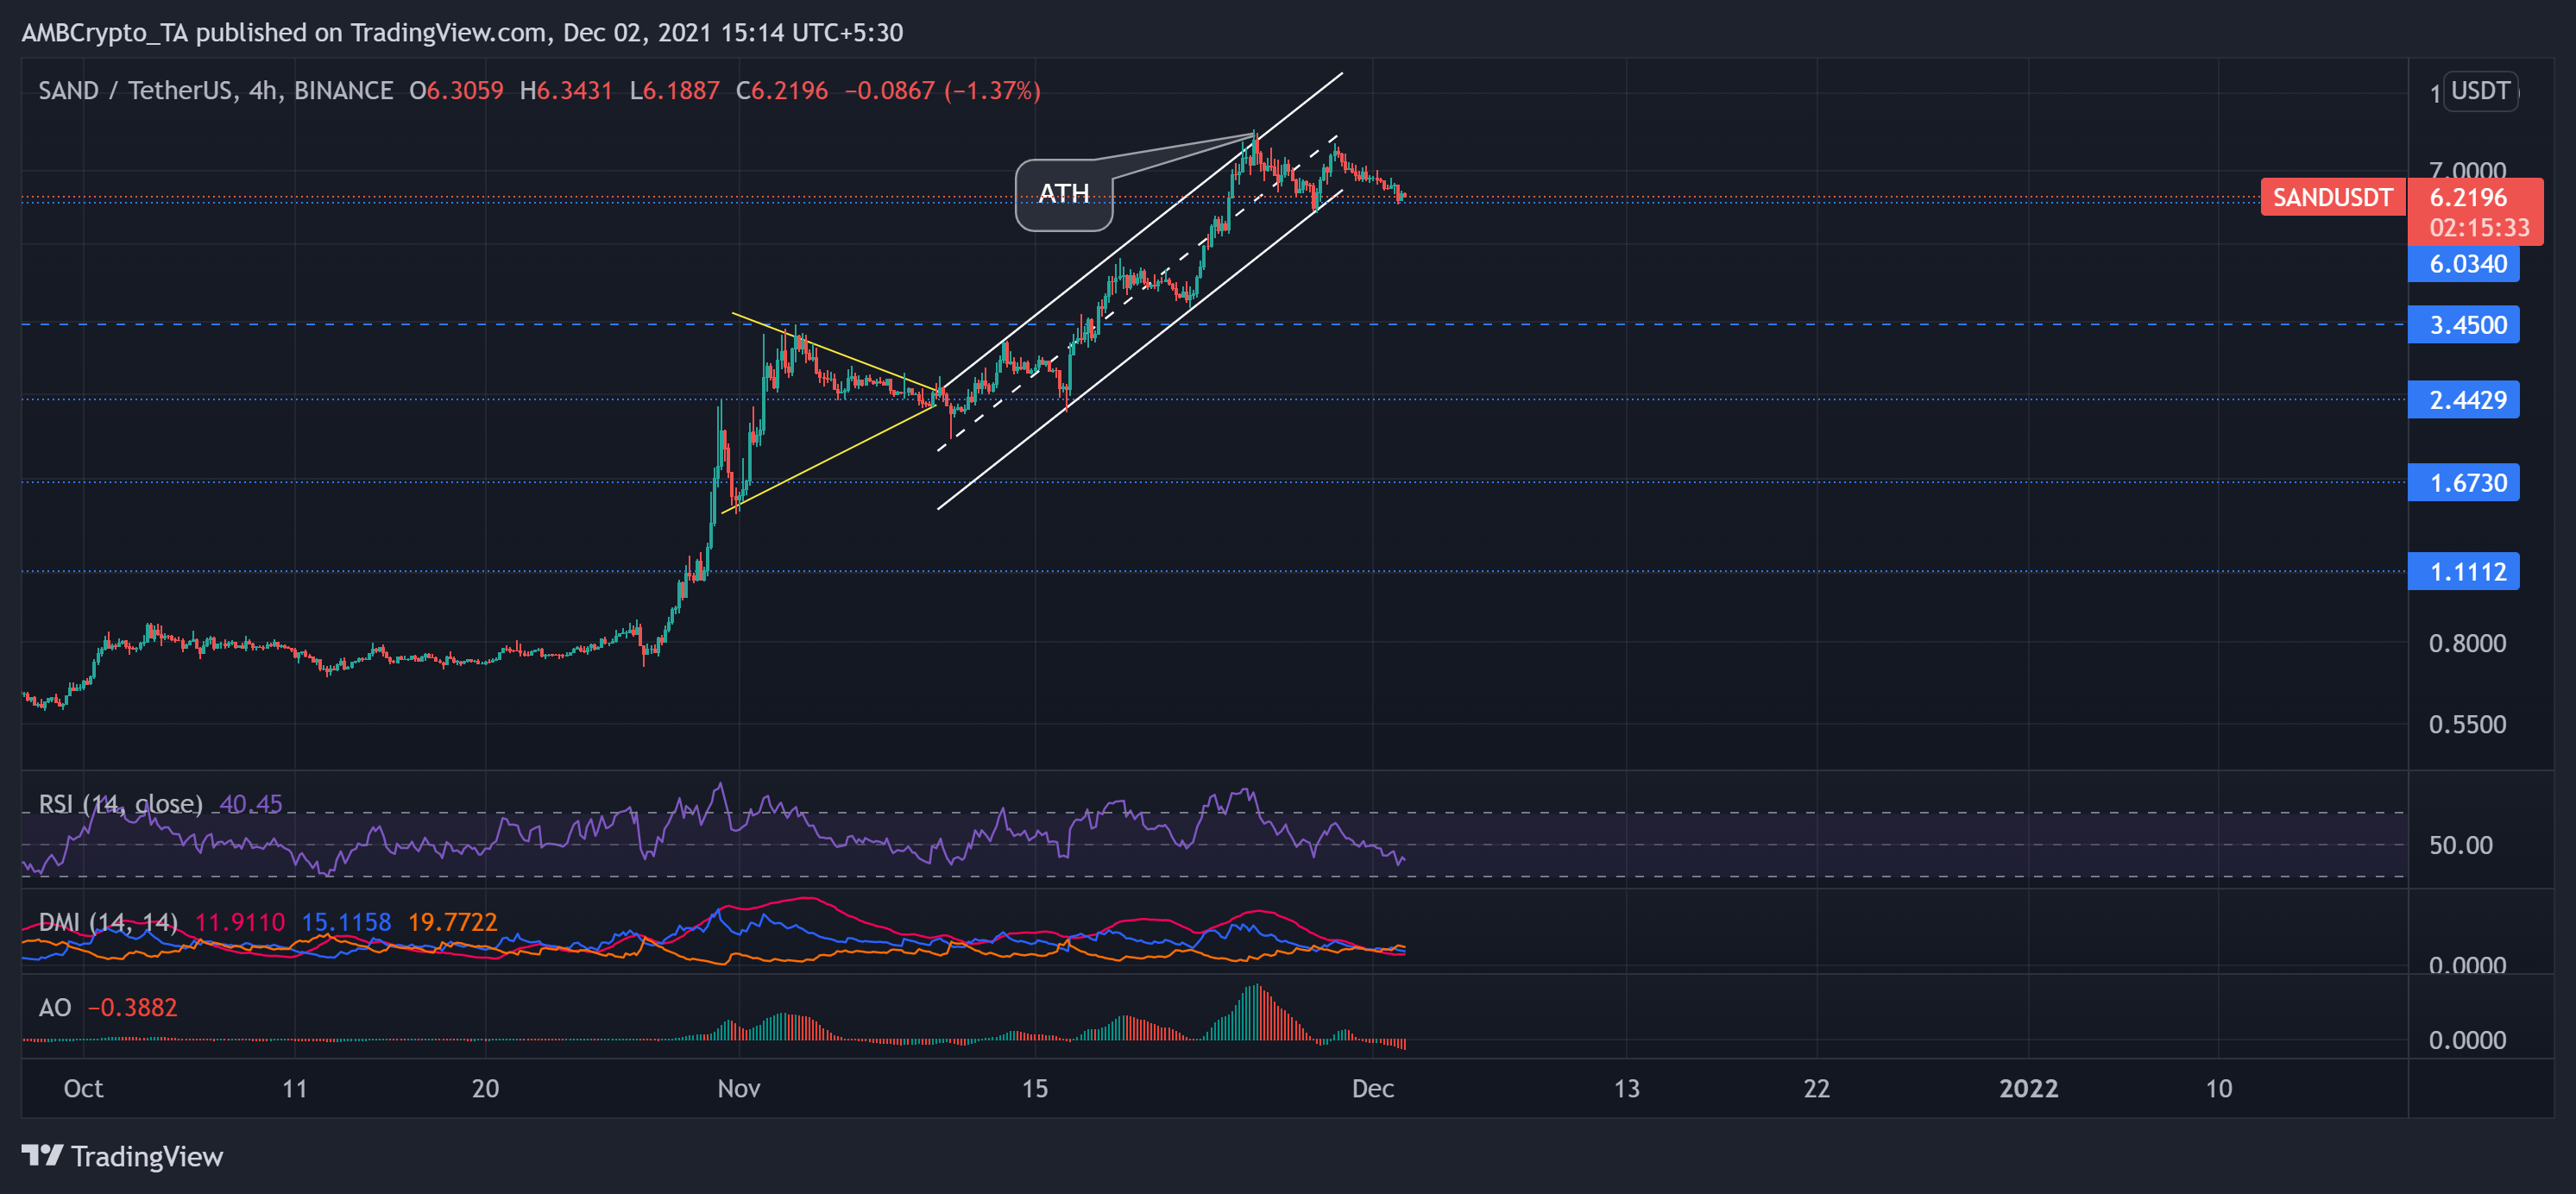
Source: TradingView, SAND/USDT
Like most metaverse tokens, SAND witnessed staggering gains since 28 October. The altcoin saw a soaring 350% ROI from 28 October to 3 November. Then, it rallied in an ascending channel post a symmetrical triangle breakout. Further, the recent tie-up with Adidas and developments in the metaverse strengthened the bullish force. As a result, the price action touched its ATH on 25 November.
However, at press time, the alt traded at $6.2196 after noting a 15.5% seven-day loss. This decline led to an up-channel breakdown for the first time in 22 days.
The RSI plunged from midline to the 40-mark. Further, the DMI and AO displayed a bearish bias. But the ADX depicted a substantially weak directional trend. Now, the bulls will have to uphold the $6.03-mark to prevent a further breakdown.
IOTA
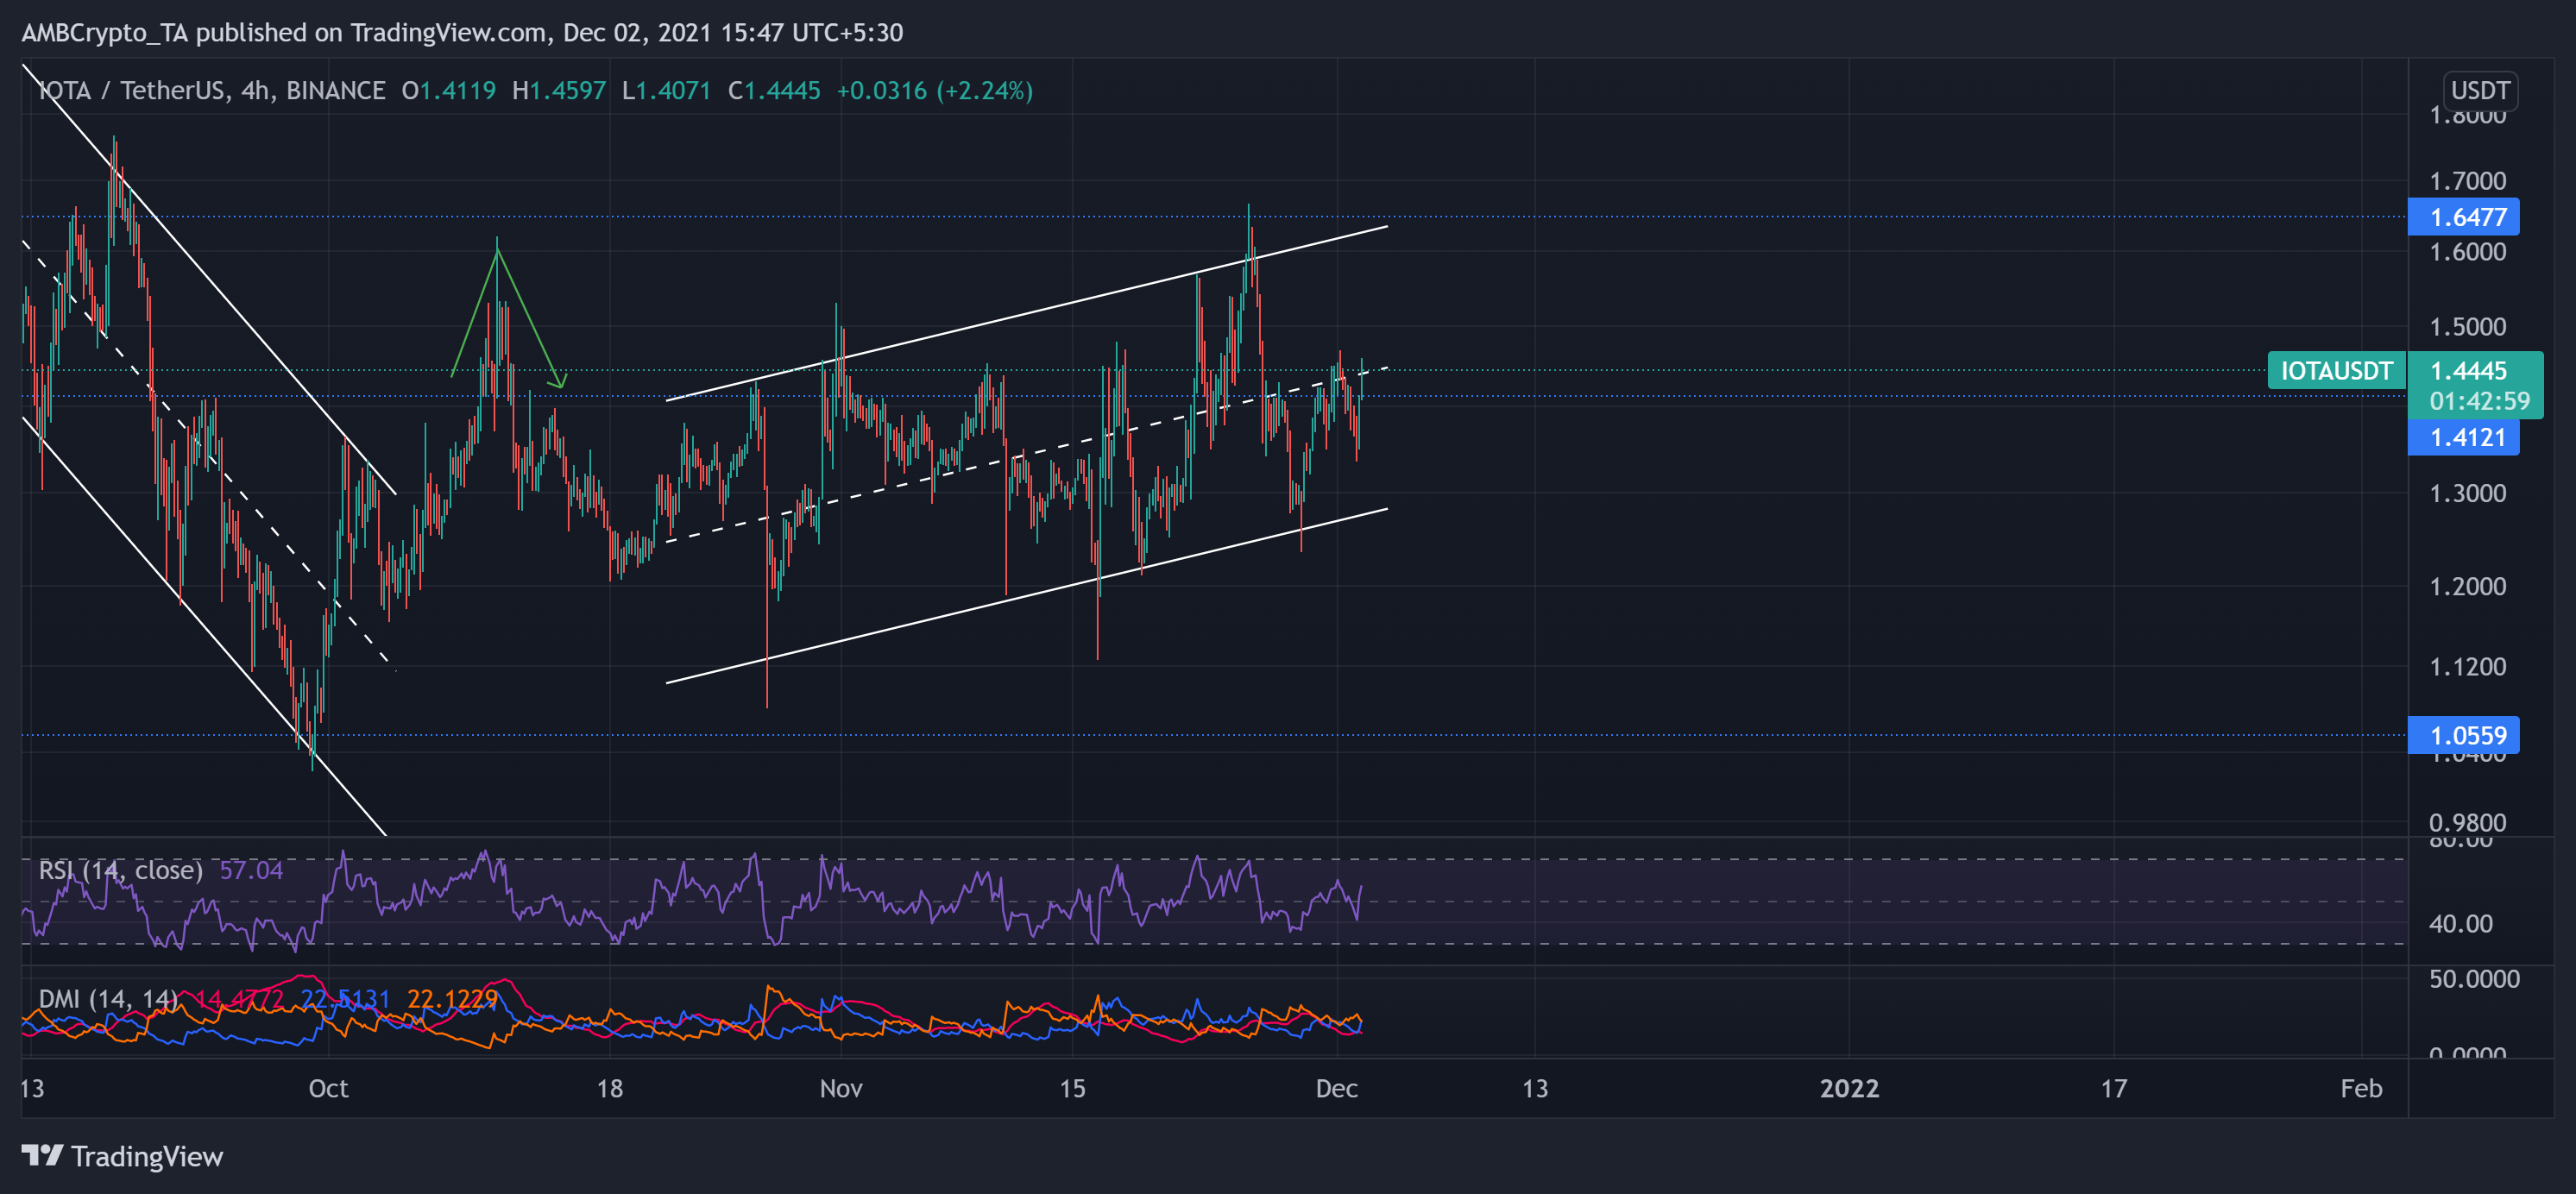
Source: TradingView, IOTA/USDT
After a mid-October V-top reversal(green), IOTA undertook a bullish trajectory as the price bounced between the ascending channel. The digital currency noted a nearly 33% ROI from 20 October to 25 November. Consequently, IOTA hit its two-month high at $1.66 on 25 November.
However, bears ensured resistance at the $1.6-mark for the past ten weeks. Thus, the price retraced and stepped back into the trend.
At press time, IOTA traded at $1.4445. The near-term technicals hinted at increasing bullish power. The RSI visibly chose the bulls after a sharp surge looking to head north. Additionally, the DMI lines were on the verge of a bullish crossover. Nevertheless, the ADX displayed a weak directional trend.