Altcoin
Cardano, XRP, Ethereum Classic Price Analysis: 1 December
The past three days witnessed a bull attempt to revive from the steady pulldown since last month.
Accordingly, after hitting their multi-month lows on 28 November, Cardano, XRP, and Ethereum Classic have bounced from their long-term support levels.
Cardano (ADA)
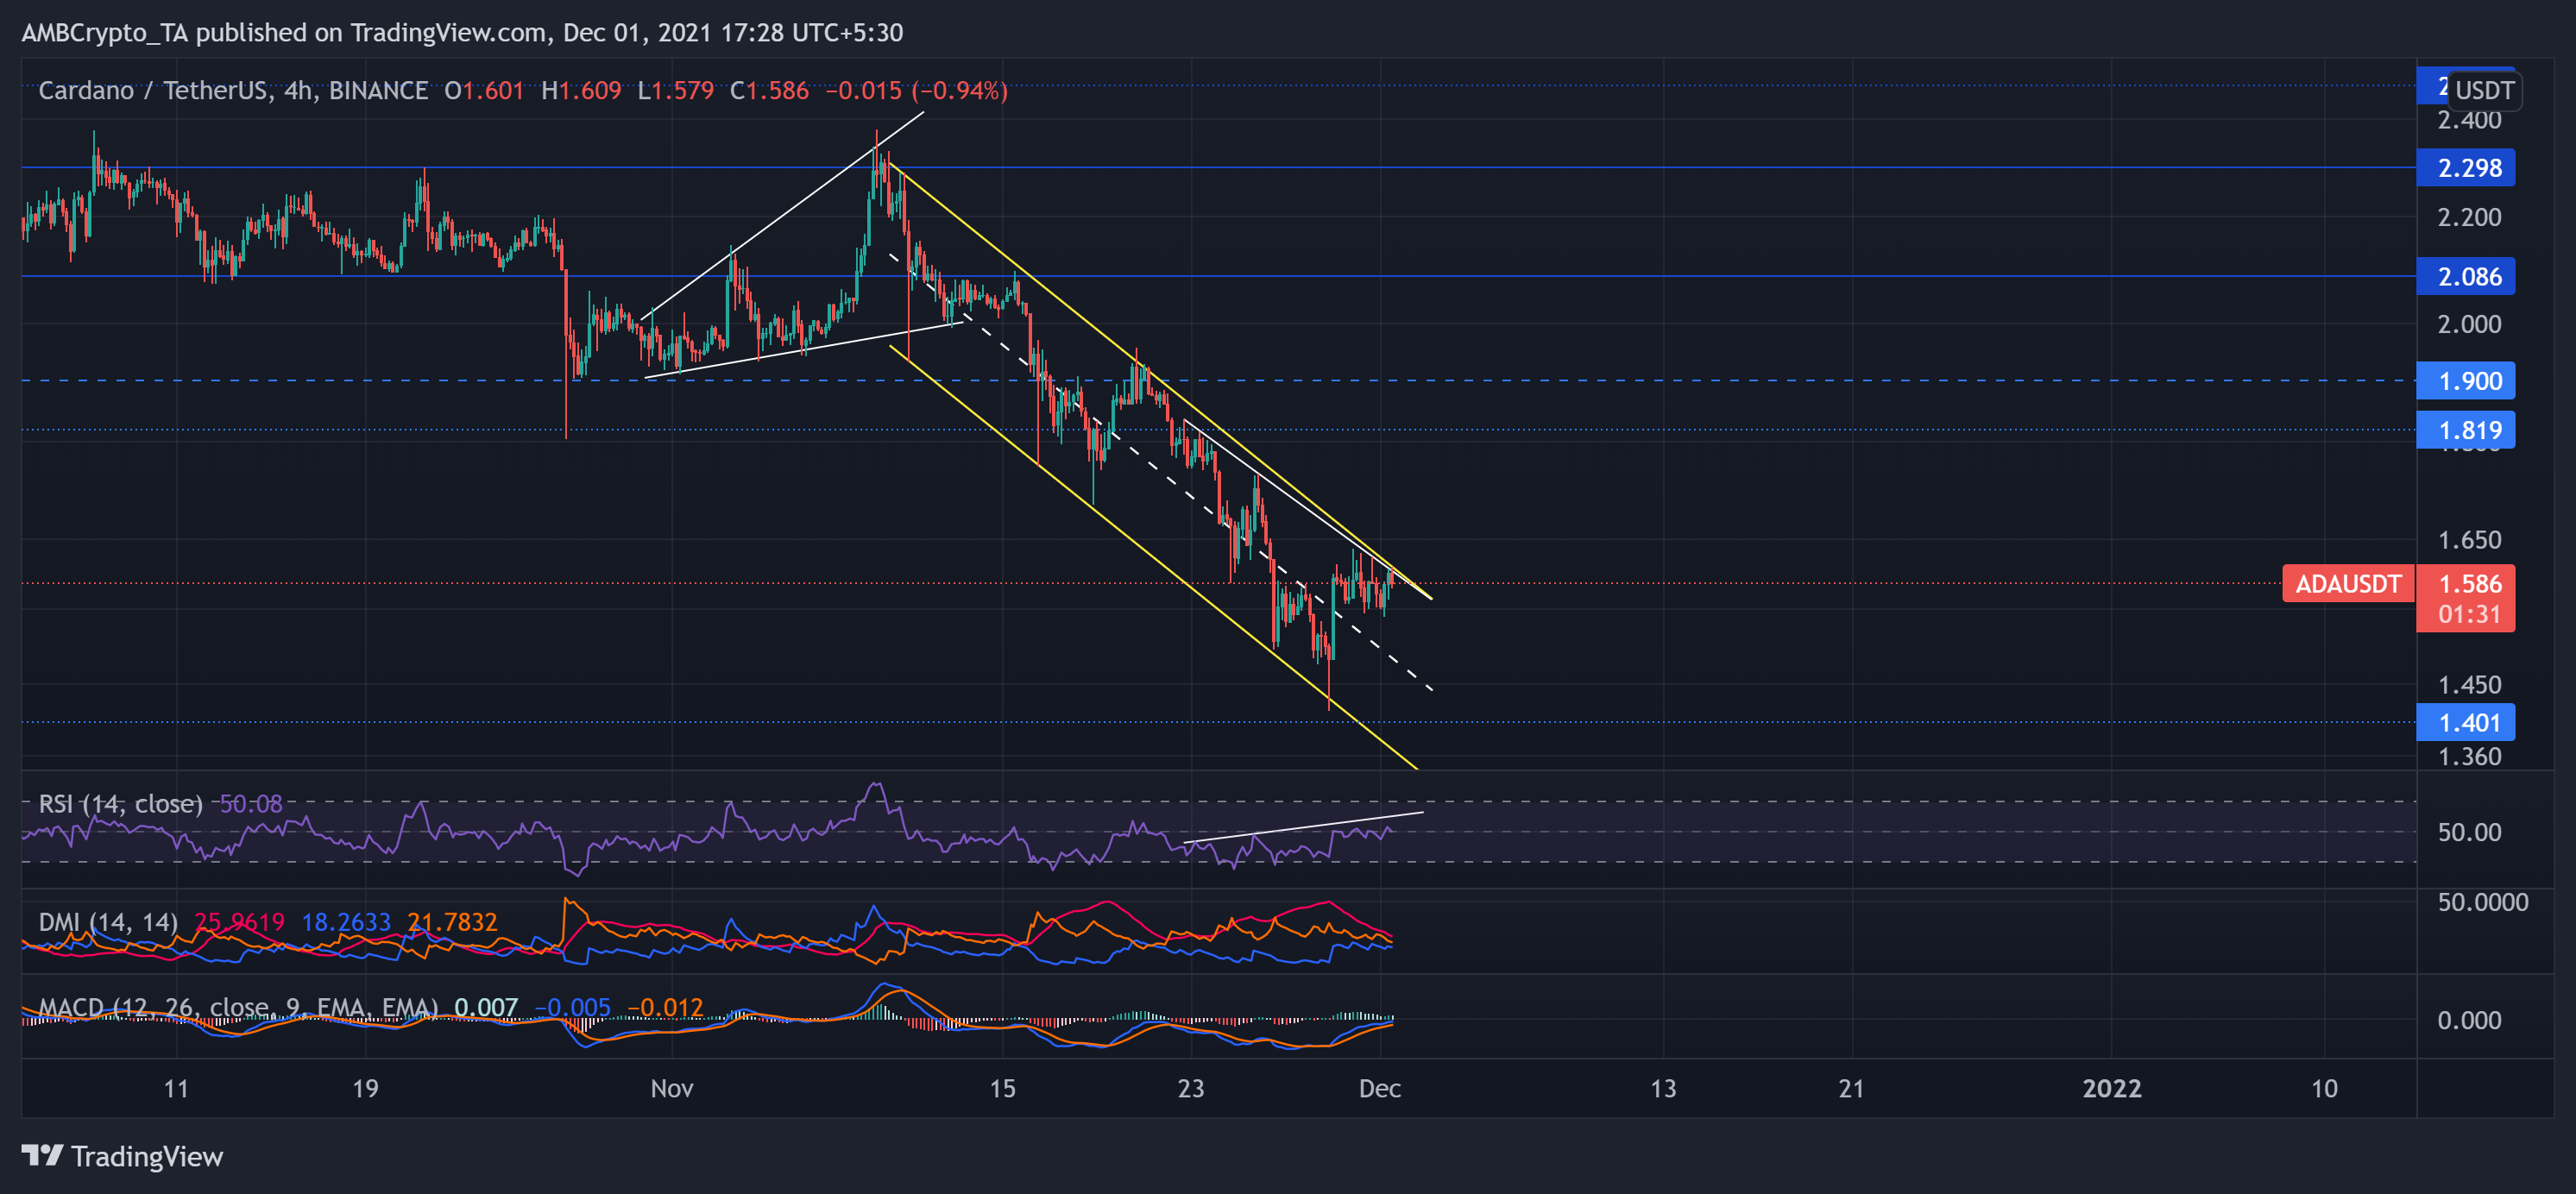
Source: TradingView, ADA/USDT
ADA has been firmly declining for over four months now. After poking its 11-week low on 27 October, the bulls triggered an uptrend as the price inclined in a rising wedge to hit its one-month high on 9 November.
However, as the bulls failed to uphold ADA’s value, the ascending wedge breakdown transposed in a down-channel (yellow). This sell-off led to a price dip of over 40% (from 9 November) as the price poked its 16-week low on 28 November. After which, the price action obliged the trend by stepping back into it.
After retesting the upper channel, ADA traded at $1.586 at press time. The RSI flashed neutral signs as it swayed near the midline.
However, a bearish divergence between the price action and the RSI affirmed the probability of a continued downturn. Further, DMI was skewed in favor of sellers, while the MACD showed a slight bullish bias.
XRP

Source: TradingView, XRP/USDT
XRP persistently declined after striking its two-month high on 10 November. Since then, the bulls visibly failed to counter the sell-off as the trend flipped in favor of bears. With this downfall, XRP withdrew by marking a falling wedge pattern. As a result, a 34.4% correction (from 10 November) led the price to touch its two-month low on 28 November.
Then, the bulls ensured the 16-week-long support at the $0.896-mark. Also, in correlation with the broader trend, they managed to push the price above the 4-hour 20-50 (red, green) SMA over the past three days.
At press time, XRP was trading at $1.0022. The RSI wavered near the midline after slightly favoring the bulls. Additionally, the MACD readings exhibit a slight bullish preference. Nevertheless, the ADX displayed a weak directional trend. Now, to trigger a descending wedge breakout, bulls have to accelerate their recently gained momentum.
Ethereum Classic (ETC)
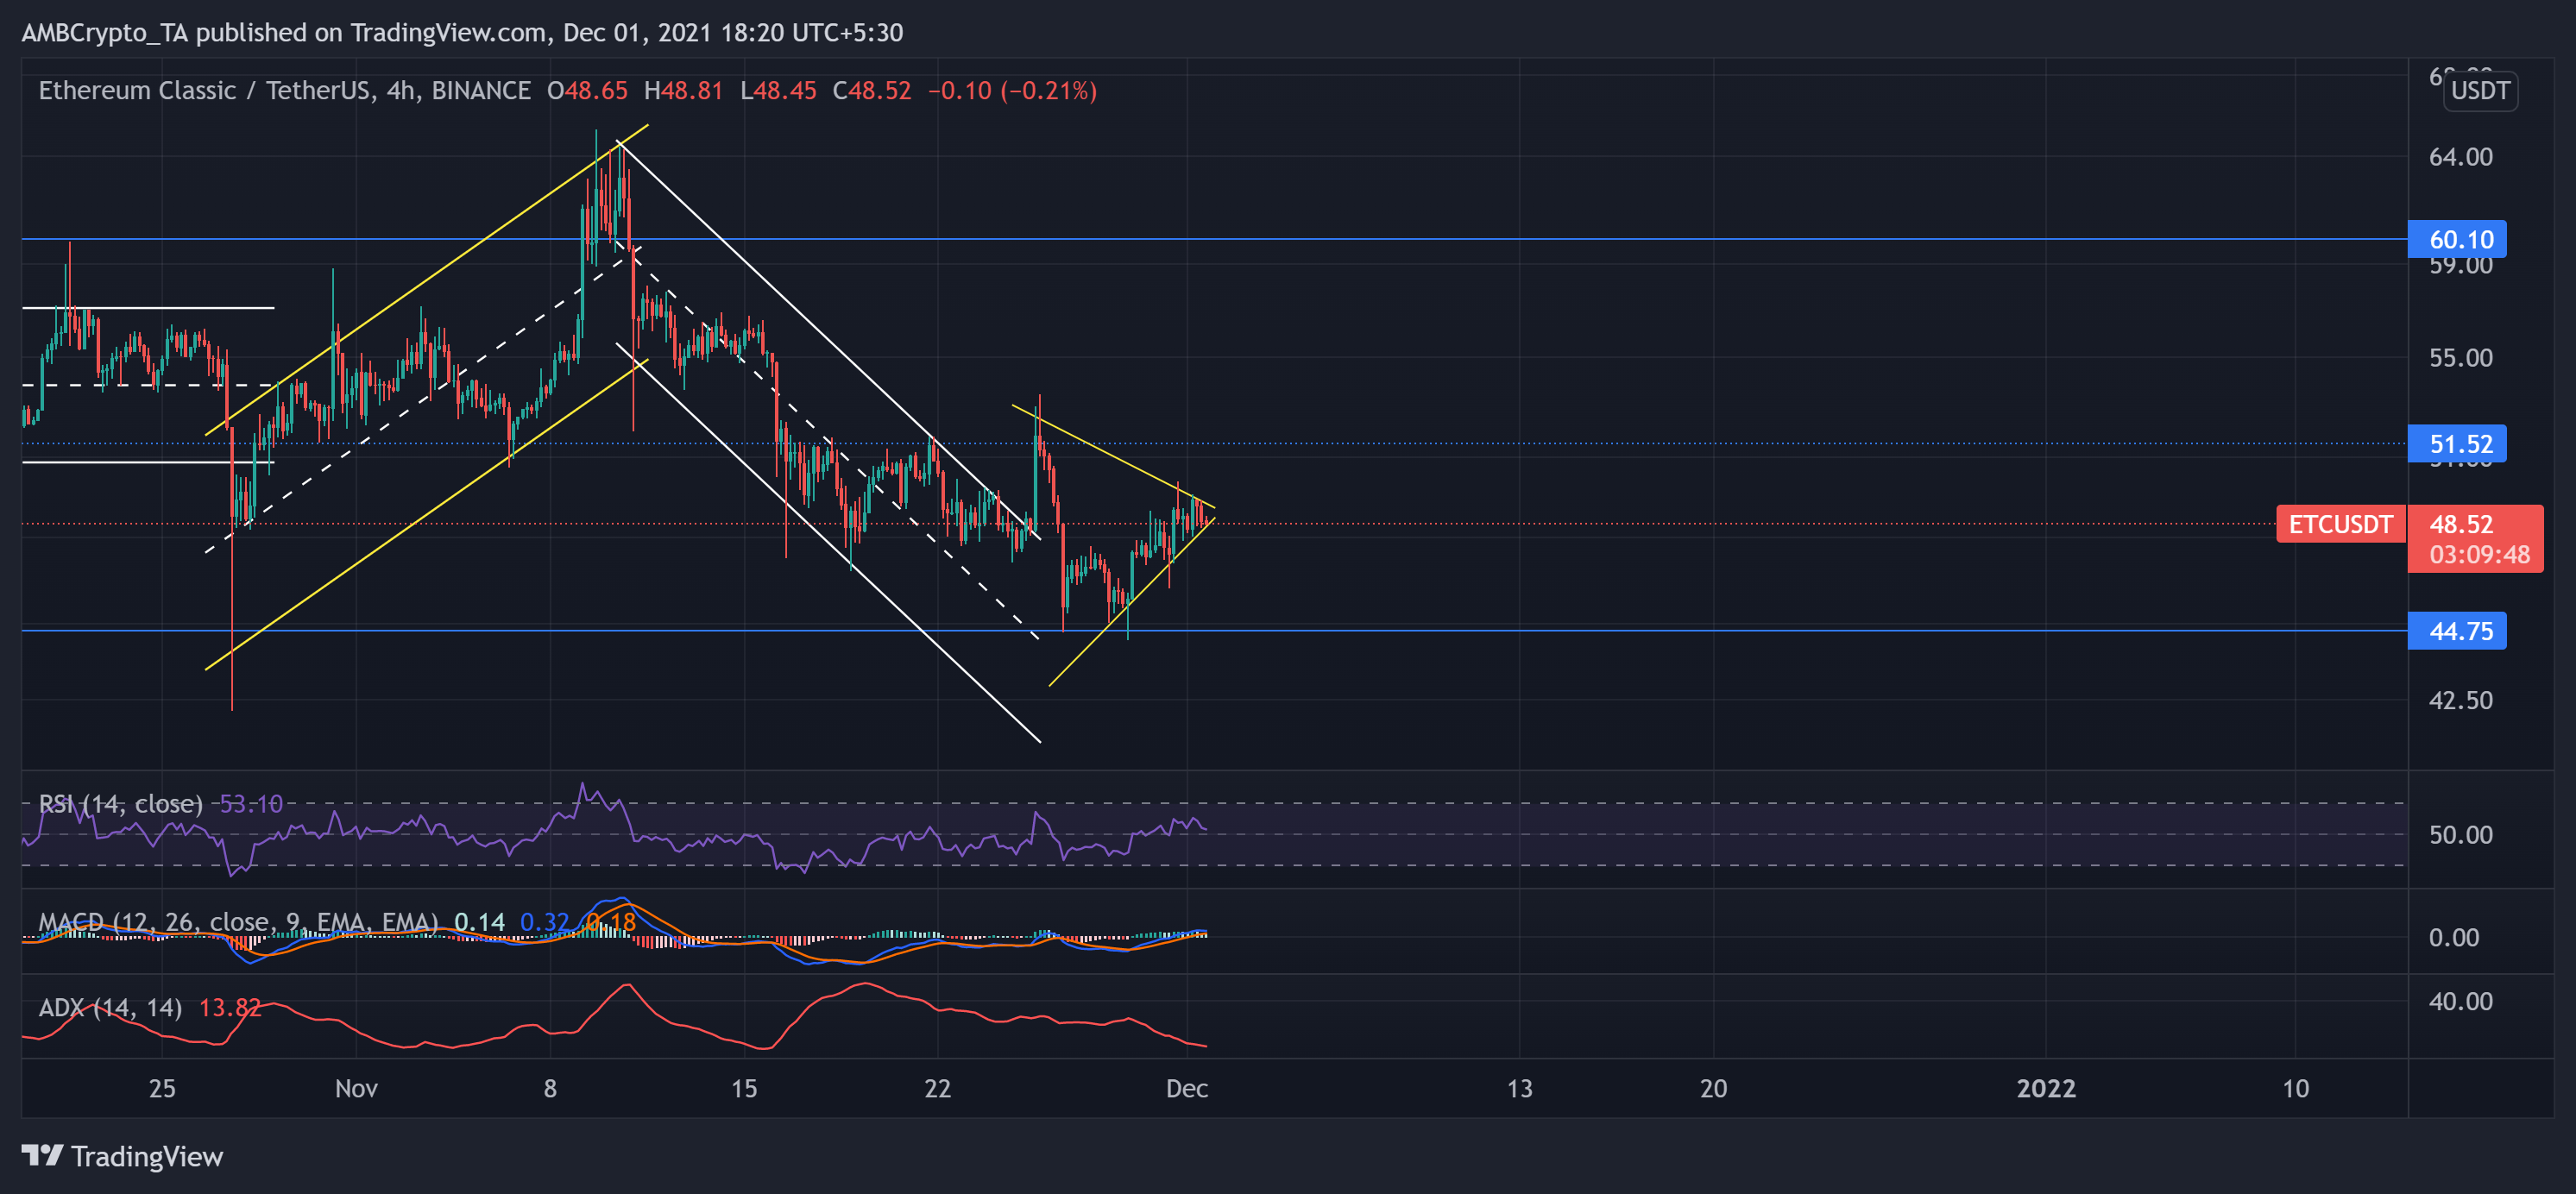
Source: TradingView, ETC/USDT
The alt grew in an ascending channel by nearly 39.6% (from 27 October) to poke its ten-week high on 9 November. As the trend flipped, the bulls lost their edge as the price declined in a down channel (white).
After a 10.42% up-channel breakout on 25 November, the bulls failed to sustain the advantage. Thus, the price fell by over 15% over the next few days to touch its one-month low on 28 November. After which, ETC saw an 8.8% revival in the past three days and formed a symmetrical triangle.
At press time, ETC traded at $48.52. The RSI stood slightly above the half-line and displayed neutral signs. Further, MACD depicted a marginal advantage for the bulls. However, the ADX hinted at a highly weak directional trend.