Altcoin
Dogecoin, VeChain, EOS Price Analysis: 1 December
After a roller coaster-like incline and fall, the crypto market flashed recovery signs. Consequently, Dogecoin, VeChain and EOS showed revival signs after the prices hit their multi-month support levels.
While VeChain and EOS registered daily gains and depicted bullish near-term technicals, Dogecoin displayed neutral signs.
Dogecoin (DOGE)

Source: TradingView, DOGE/USD
After an exceptional month-long rally to its 11-week milestone on 28 October, DOGE persistently slackened over the last month. The price action transposed into a down channel (yellow) post a descending triangle (white) breakout. It lost over 44% of its value (from 28 October) to poke its four-month low on 26 November.
DOGE bulls have found strong support at the $0.197- mark for over four months. Thus, over the past five days, the price bounced from the aforestated level. Consequently, the alt saw a down-channel breakout.
At press time, DOGE traded at $0.2147. The RSI depicted a bullish preference but seemed to head towards the midline. Although the DMI had a bullish bias, AO hinted at increasing bearish influence in the near term. Considering the bearish divergence (white trendline) between the price action and RSI, DOGE bulls will need increased momentum to turn the tide in their favor.
VeChain (VET)
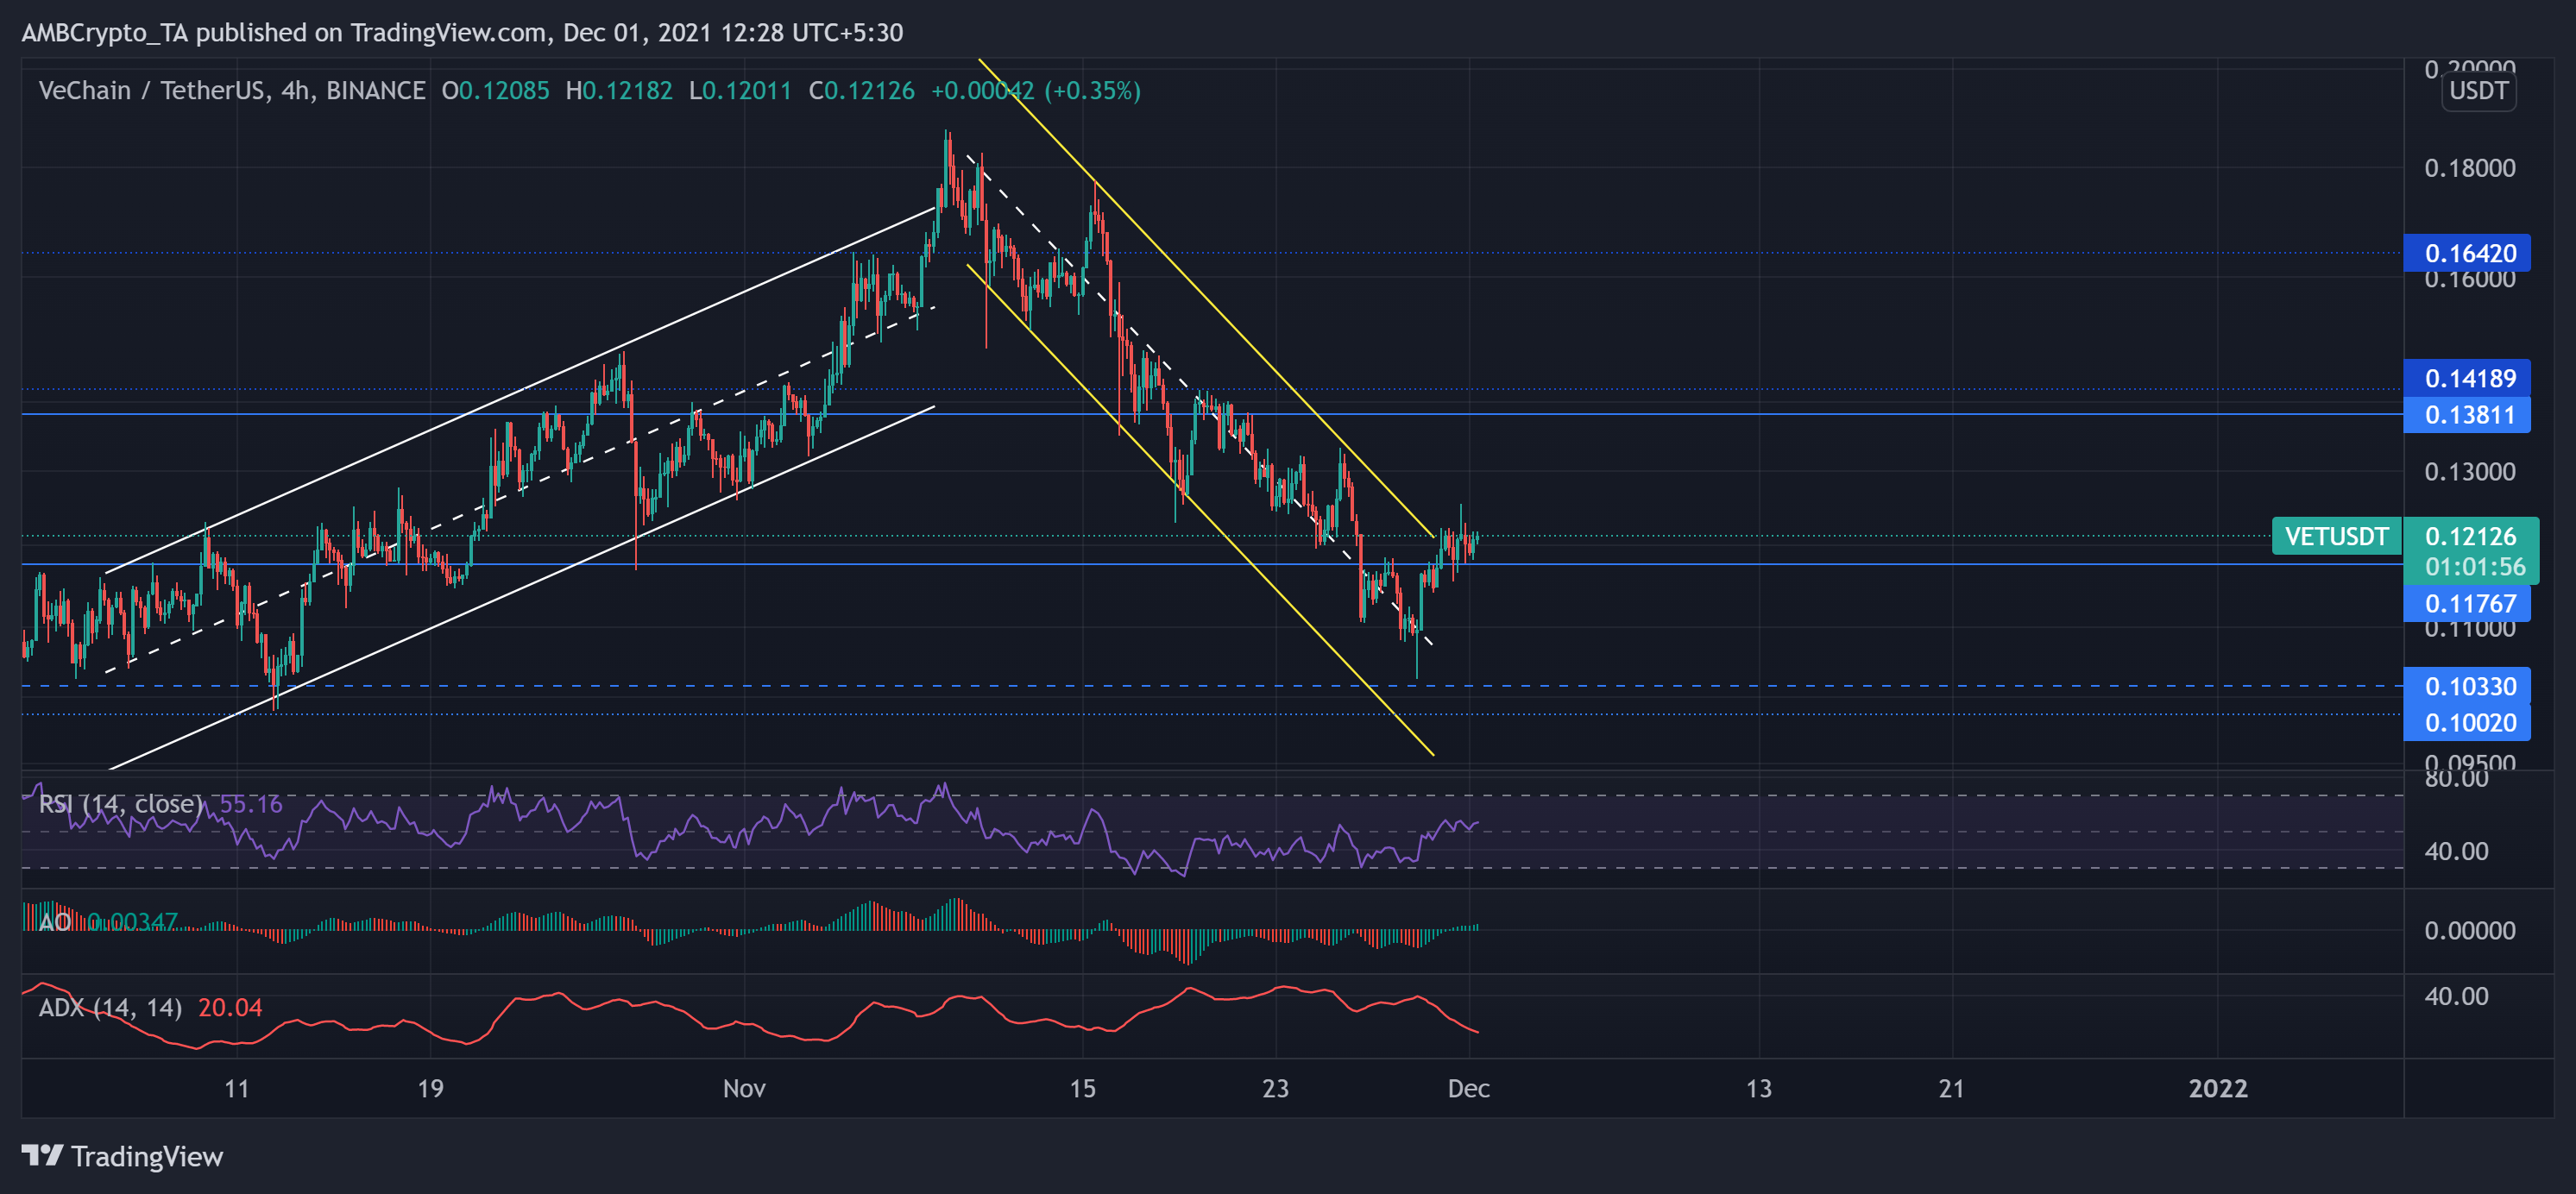
Source: TradingView, VET/USDT
After more than doubling its value during October and touching its six-month high on 9 November, VET performed poorly during the last month. The alt witnessed a strong pullout as the price noted a 41.17% decline since then.
While prices fell in a down channel (yellow), VET poked its six-week low on 28 November. Then, the price action obliged its two-month-long support at the $0.103-mark. Consequently, VET saw a bearish down-channel breakout over the last three days.
At press time, VET traded at $0.12126 after noting a 3.5% increase in 24 hours. The RSI displayed positive signs for the bulls by swaying above the midline. Further, the AO confirmed the increasing bullish vigor. However, the ADX flashed a weak directional trend.
EOS
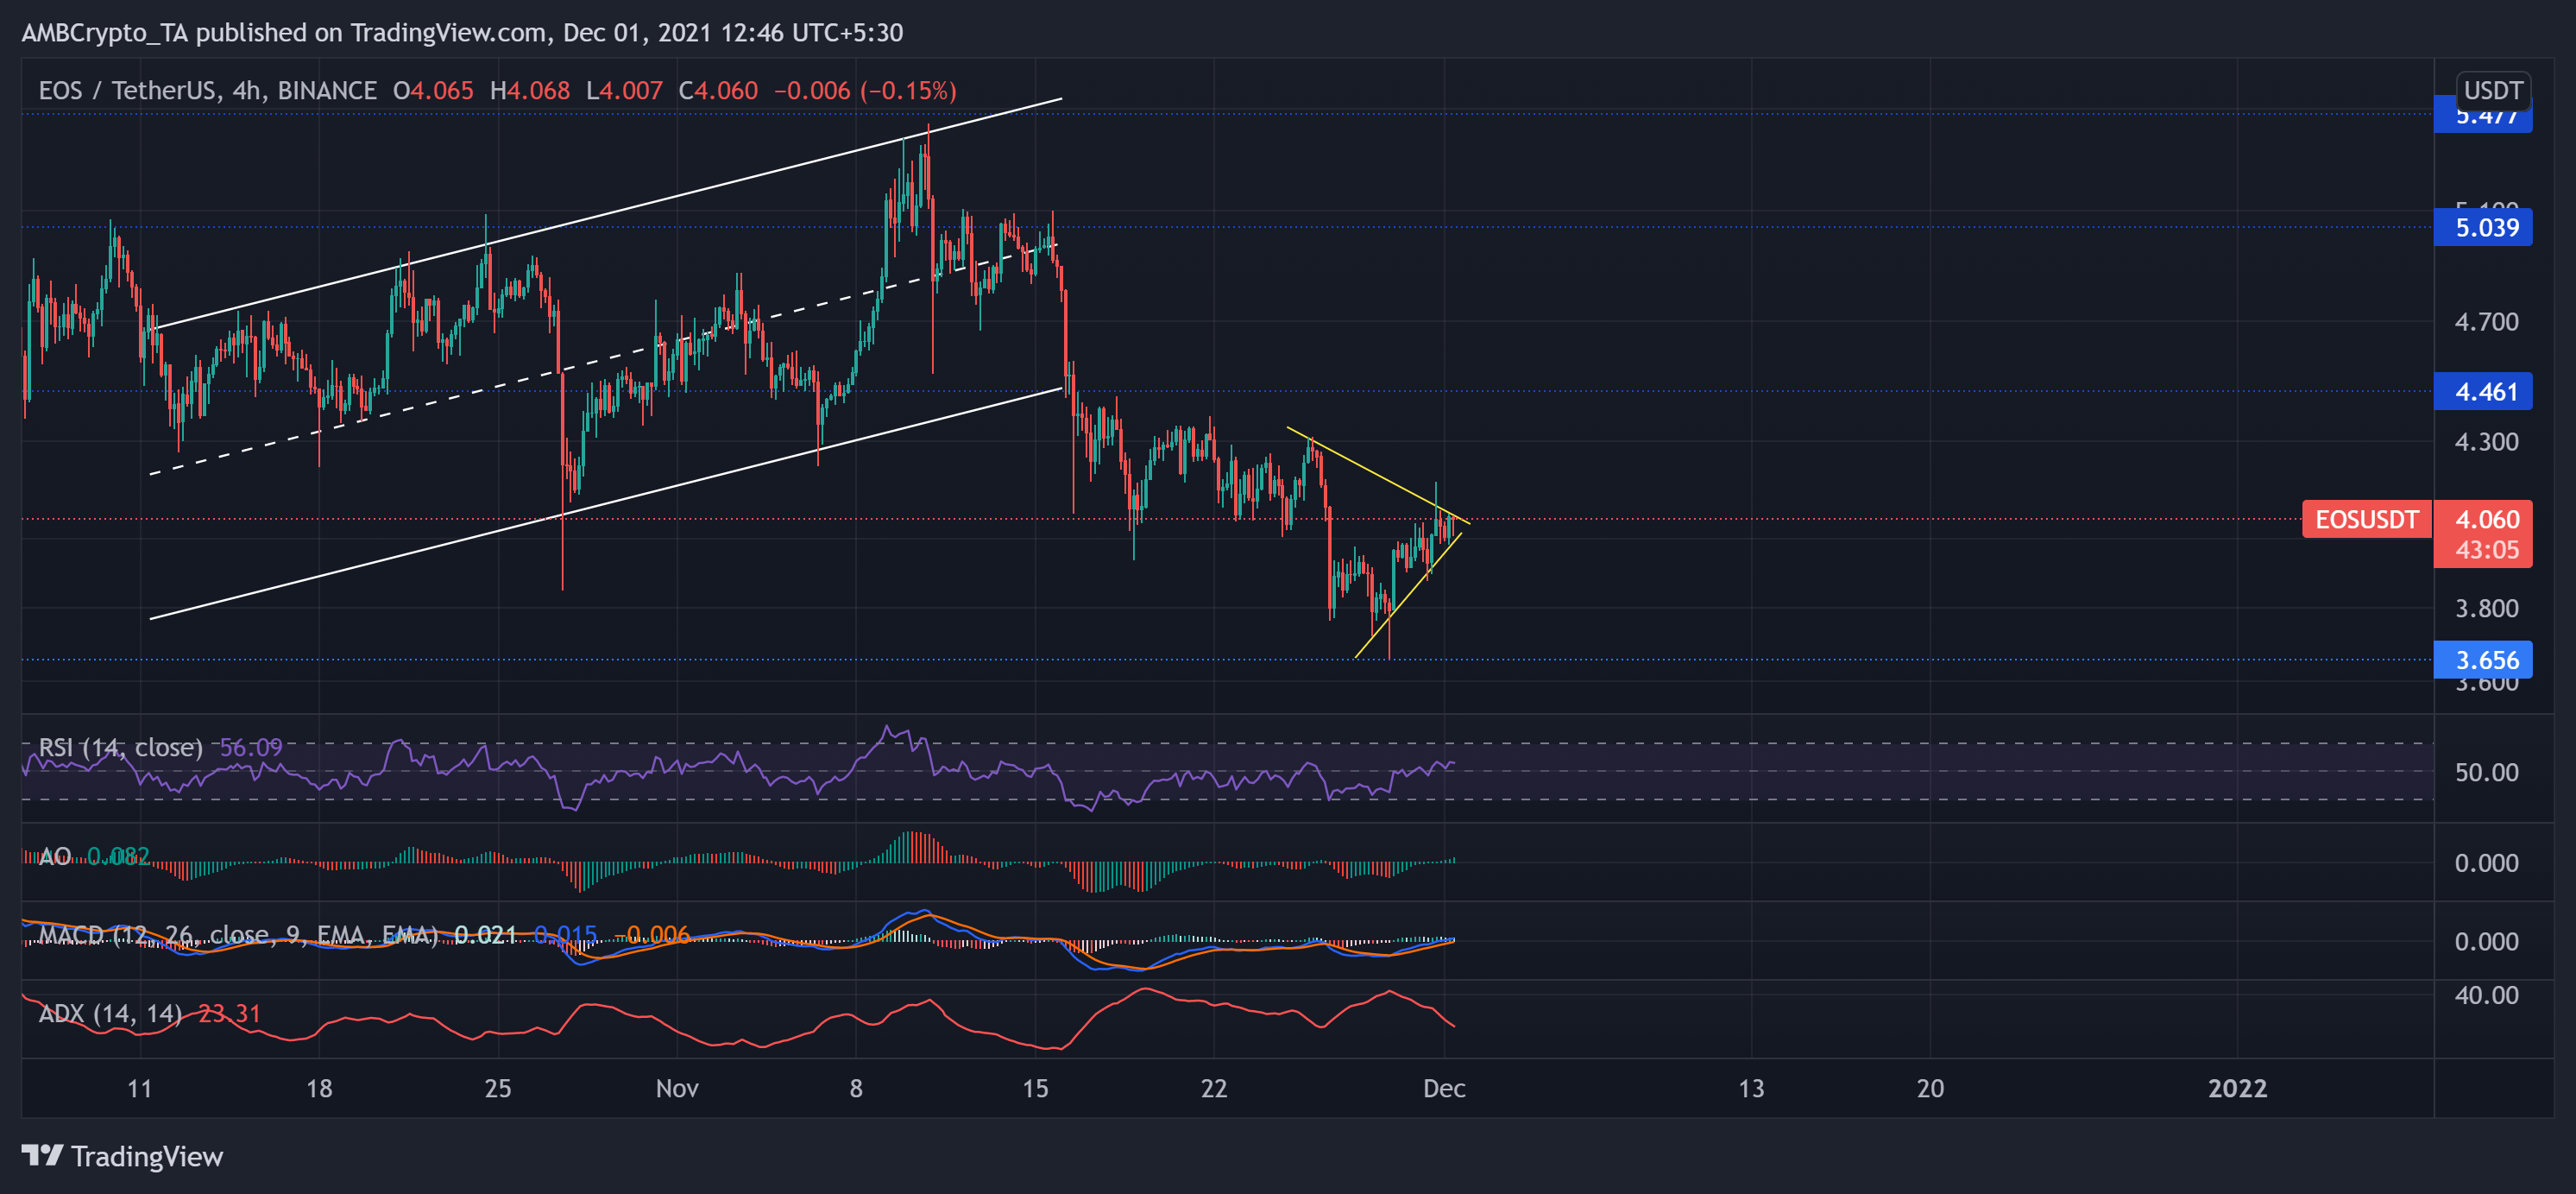
Source: TradingView, EOS/USDT
After a staggering 47% rally (from 30 September), EOS hit its seven-week high on 10 November. Correlating with market tendencies and obliging the 12-week-long resistance (at the $5.4 mark), the price action saw a pullback.
As the correction phase kicked in, EOS witnessed an up-channel breakdown and formed a descending triangle pattern (yellow). The alt lost over one-third of its value until it hit its two-month low on 28 November.
After a revival from four-month-long support at the $3.6-mark, the price action rose to form a symmetrical triangle (yellow). At press time, EOS was trading at $4.06. RSI displayed recovery signs as it headed north and stood above the midline. Additionally, MACD and AO depicted a bullish inclination. However, ADX showed a slightly weak directional trend.