
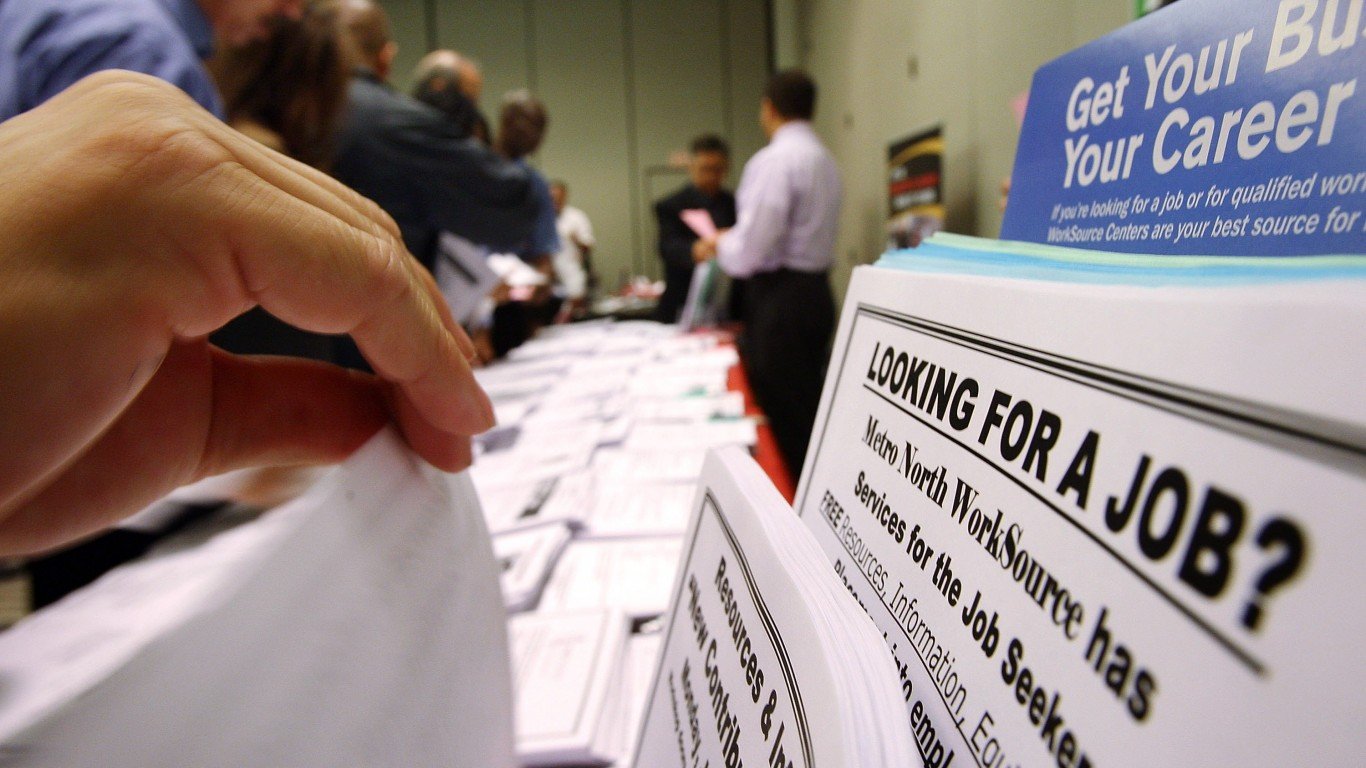
Systemic racism and historical inequality have ingrained racial disparities into daily life in America. Black Americans are much more likely than white Americans to face serious financial hardship, be incarcerated, or have poor health outcomes.
While no area is free from discrimination or racial disparities, there are a number of U.S. metro areas where the differences are much more stark. In these areas, there are significant gaps in income, poverty, educational attainment, unemployment, and other measures between Black and white residents.
To determine the worst cities for Black Americans, 24/7 Wall St. created an index of eight variables measuring racial socioeconomic gaps in each of the nation’s 383 metropolitan areas. For each city we evaluated the gap between white and Black residents in poverty, high school and college education, income, homeownership, unemployment, mortality, and incarceration. Data came from the U.S. Census Bureau’s American Community Survey, the Centers for Disease Control and Prevention, and the Bureau of Justice Statistics.
Of the 20 worst cities for Black Americans, 13 are located in the Midwest. Six are in the Northeast, and just one metro area is in the West. In each of these cities, white median household incomes are tens of thousands of dollars higher than Black median household incomes, and poverty rates are also much higher.
Black residents in these metro areas are much less likely to hold a high school diploma or college degree than white residents. Lower levels of high school attainment can drive down wages and make it more difficult to find a job. Unemployment rates are also far higher among the Black labor force than among the area’s white labor force. These are the states with the highest Black unemployment rates.
Click here to see the worst cities for Black Americans.
Click here to see our methodology.
Source: gnagel / Getty Images
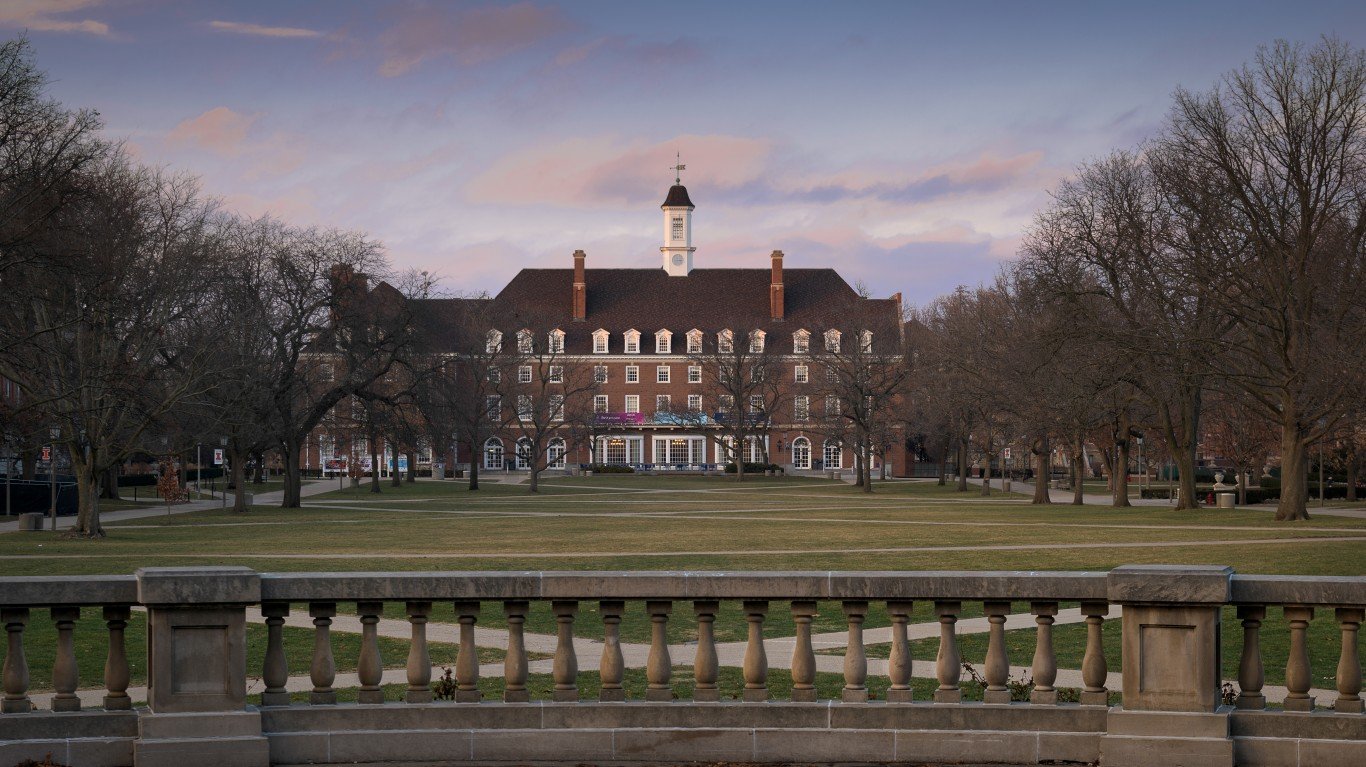
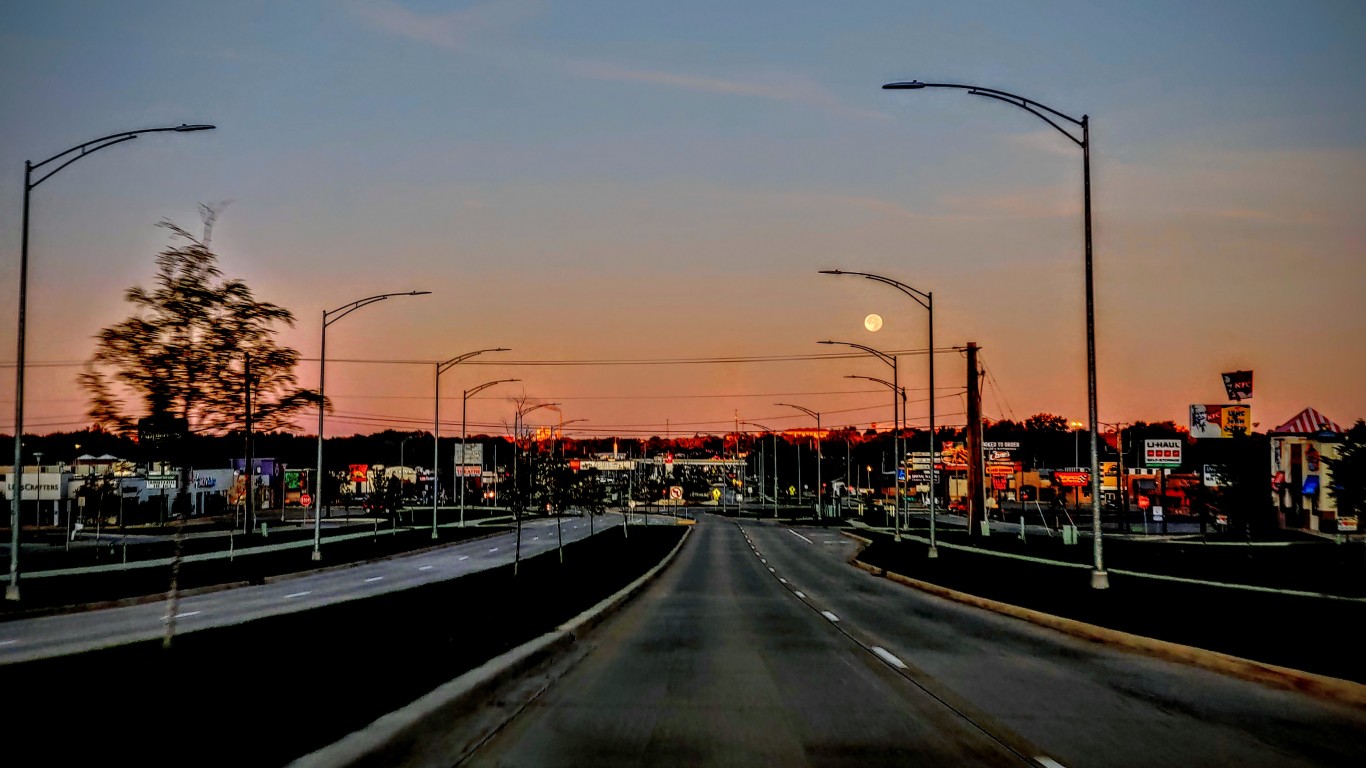
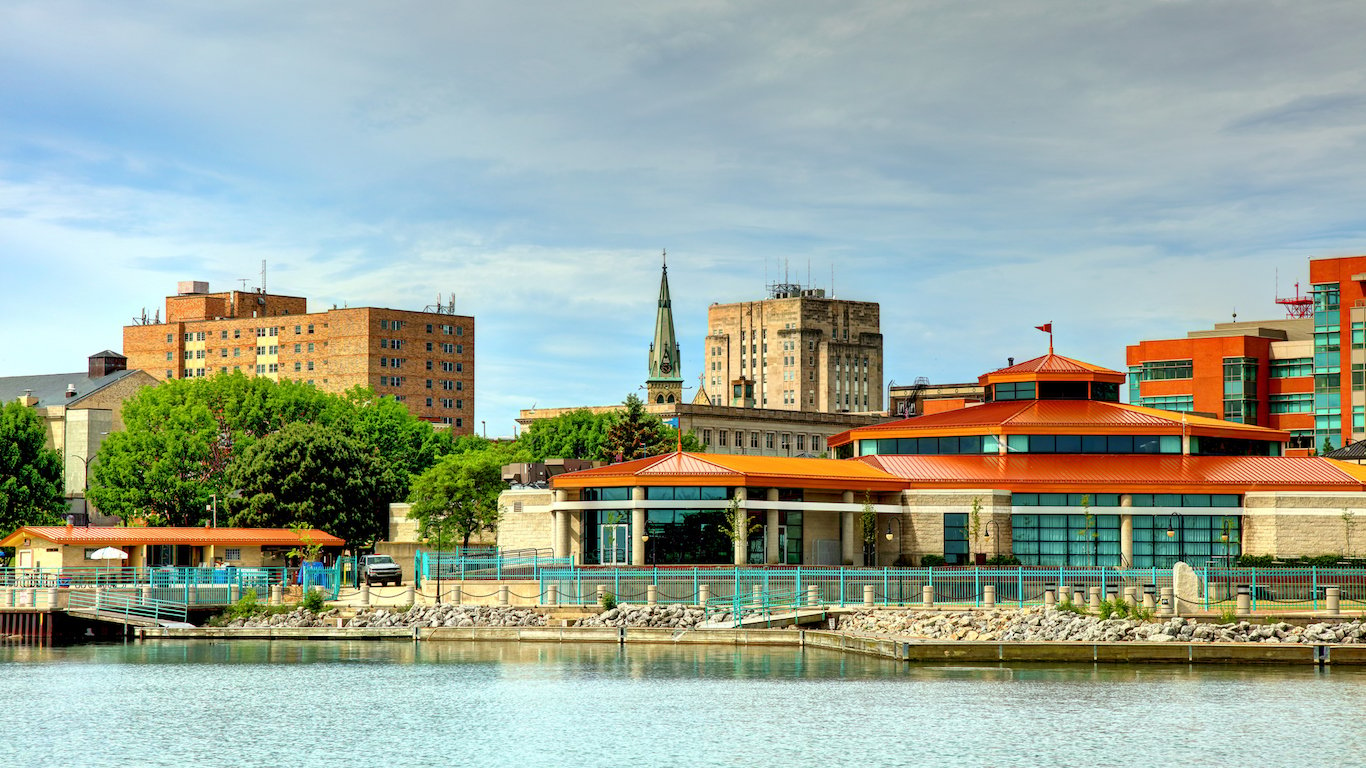
20. Champaign-Urbana, IL
> Black population: 28,107 (12.4% of total)
> Black median income: $31,406 (50.7% of white income)
> Unemployment: 10.9% (Black); 3.7% (white)
> Homeownership rate: 24.4% (Black); 63.7% (white)
The Champaign-Urbana metro area of Illinois ranks as one of the worst places for Black Americans. This is in large part because of the economic disparities between Black and white residents. The area’s Black unemployment rate of 10.9% is nearly three times higher than the white unemployment rate of 3.7%.
White area residents also earn nearly twice as much as Black residents — the median household income for Black residents is $31,406, compared to the $61,910 for white households.
[in-text-ad]
Source: DenisTangneyJr / Getty Images
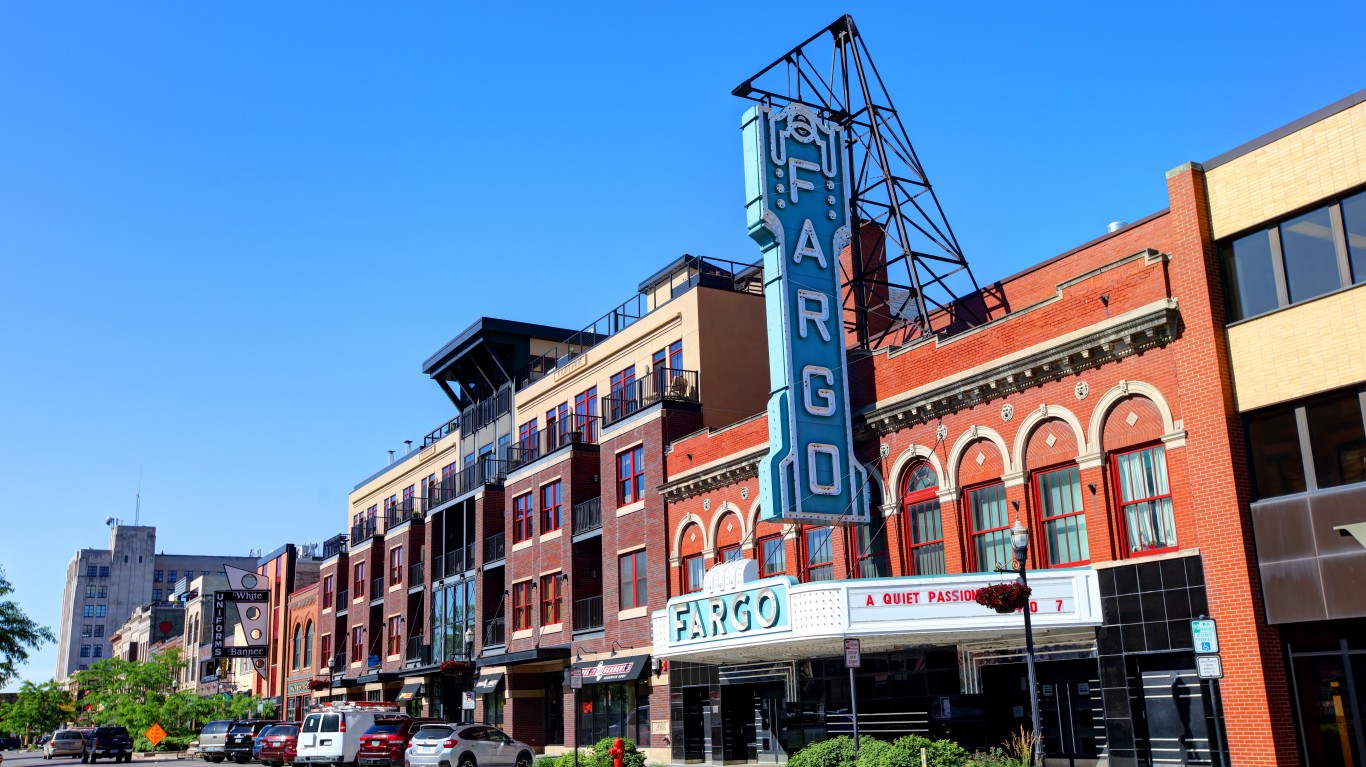
19. Fargo, ND-MN
> Black population: 12,124 (5.0% of total)
> Black median income: $32,707 (47.4% of white income)
> Unemployment: 12.3% (Black); 2.2% (white)
> Homeownership rate: 8.4% (Black); 59.9% (white)
About one in nine Fargo residents, or 11.1%, live in poverty. Just 8.8% of white area residents live below the poverty line, compared to 37.5% of Black area residents who do — one of the largest disparities among all U.S. metro areas.
The homeownership rate among white Fargo residents is nearly 60%. The homeownership rate among Black area residents is one of the lowest of all cities, at 8.4%. For context, the overall U.S. homeownership rate is 64% — 69.5% for white Americans and 41.8% for Black Americans.

Source: SeanPavonePhoto / Getty Images
18. Albany-Schenectady-Troy, NY
> Black population: 63,372 (7.2% of total)
> Black median income: $32,599 (43.2% of white income)
> Unemployment: 11.5% (Black); 3.8% (white)
> Homeownership rate: 24.6% (Black); 68.9% (white)
The Albany metro area of New York has one of the largest income disparities between white and Black residents. The median income for Black households is $32,599, less than half of the median for white households of $75,473.
Black Albany residents are more than three times as likely to be unemployed as white residents. The metro area’s Black unemployment rate is 11.5%, compared to the area’s white unemployment rate of 3.8%. This may be one of the reasons why the white poverty rate is relatively low, at 7.7%, while the Black poverty rate is high, at 27.9%.
Source: ibsky / Getty Images
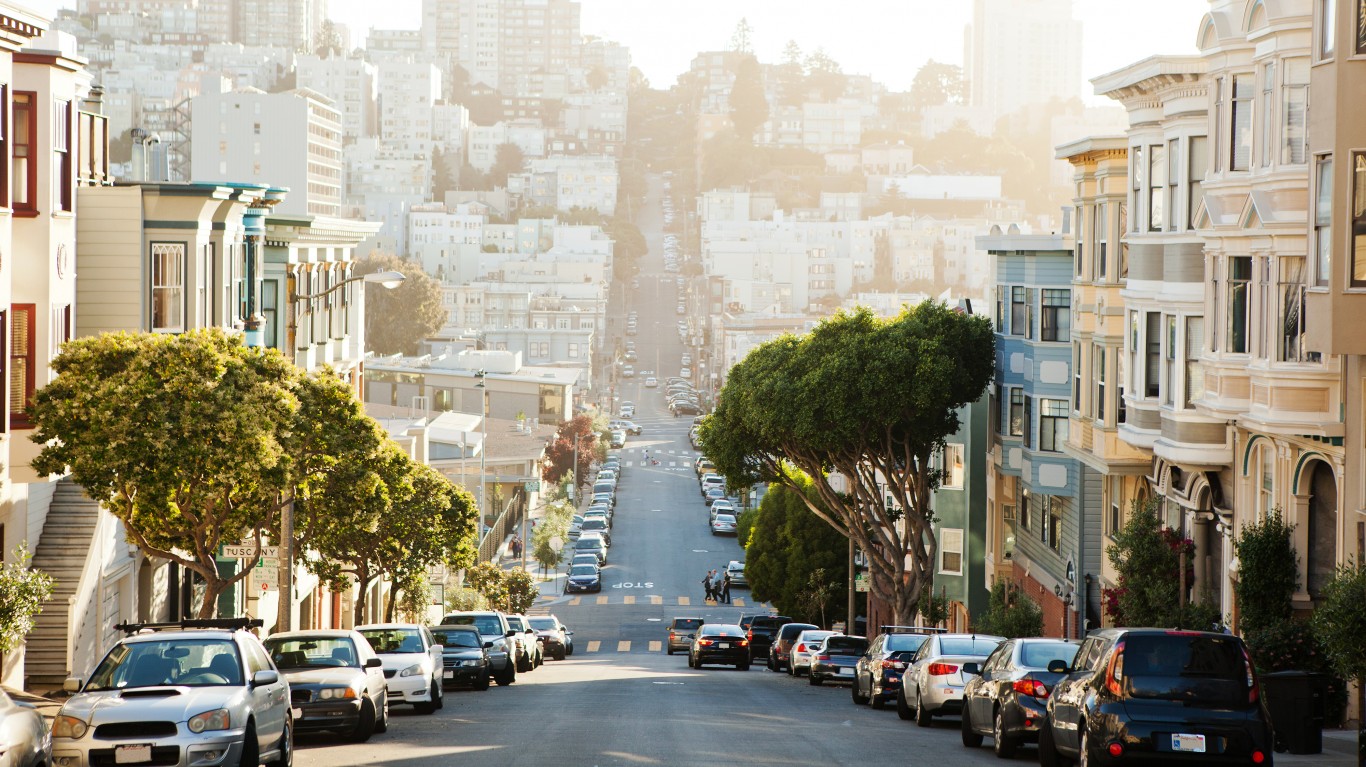
17. San Francisco-Oakland-Berkeley, CA
> Black population: 333,087 (7.1% of total)
> Black median income: $53,710 (43.3% of white income)
> Unemployment: 9.3% (Black); 3.8% (white)
> Homeownership rate: 33.7% (Black); 59.2% (white)
The San Francisco metro area is the one place in the Western U.S. to rank among the worst cities for Black Americans. The area is relatively affluent and healthy, but there are significant gaps in income and health measures between white and Black residents.
In the Bay Area, as it is commonly known, the age-adjusted mortality rate for white residents is among the best at just 571 deaths per 100,000 residents. The rate is more than 50% higher for Black residents, at 860 deaths per 100,000. The Black median household income in the area, at $53,710, is relatively high when compared to the national median for Black households. Still, the median income for white households is more than $70,000 higher, at $124,066.
[in-text-ad-2]
Source: DenisTangneyJr / Getty Images
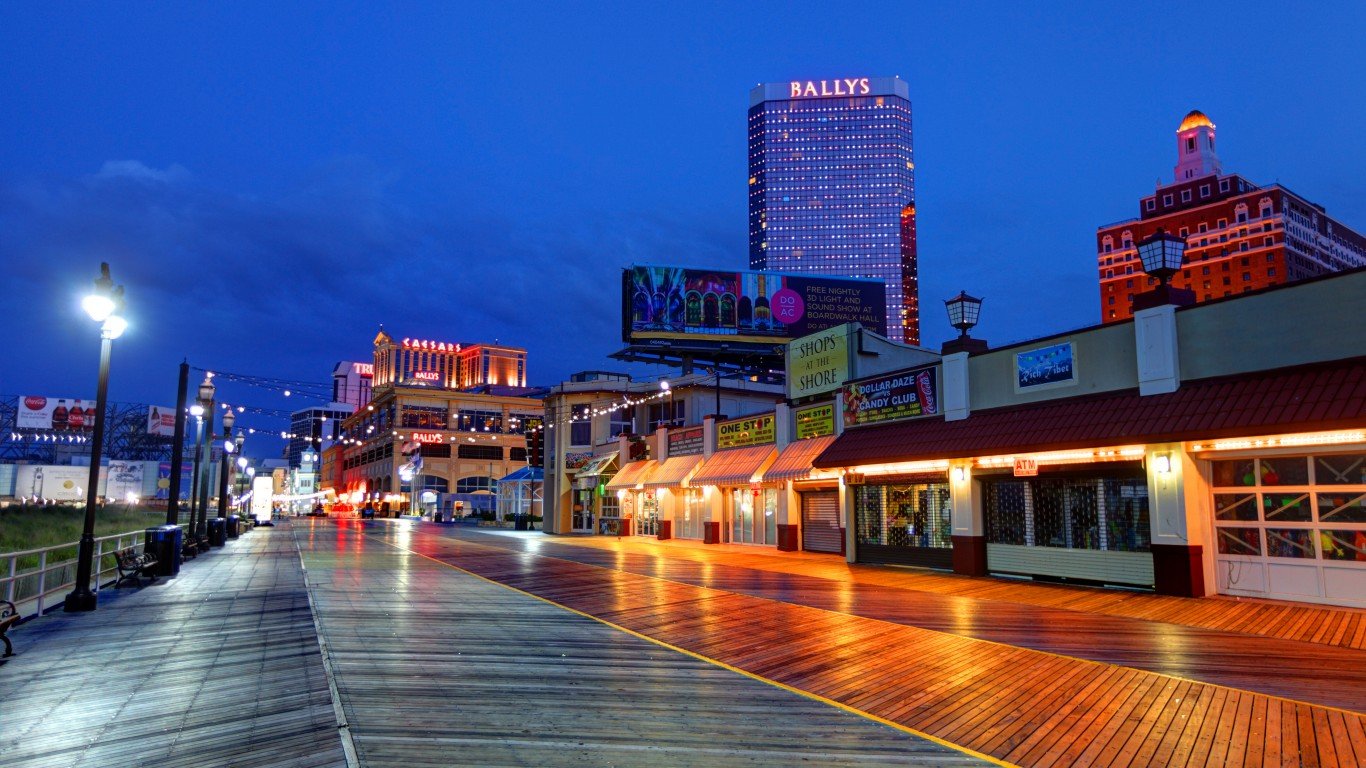
16. Atlantic City-Hammonton, NJ
> Black population: 37,289 (14.0% of total)
> Black median income: $35,759 (47.0% of white income)
> Unemployment: 13.0% (Black); 6.4% (white)
> Homeownership rate: 38.5% (Black); 76.4% (white)
Black residents of the Atlantic City metro area are much more likely to struggle economically than white residents. The area’s Black unemployment rate of 13.0% is more than double the white unemployment rate of 6.4%. The median annual median income among Black households of $35,759 is also less than half the median of white households, which is just over $76,000.
The Atlantic City metro area is in New Jersey, a state with the largest incarceration disparity between white and Black residents. For every 100,000 white New Jersey residents, 80 are incarcerated. For every 100,000 Black residents, 1,007 are incarcerated — a 12.6 times higher incarceration rate. Nationwide, Black Americans are 4.7 times as likely to be incarcerated as white Americans.
Source: zrfphoto / Getty Images
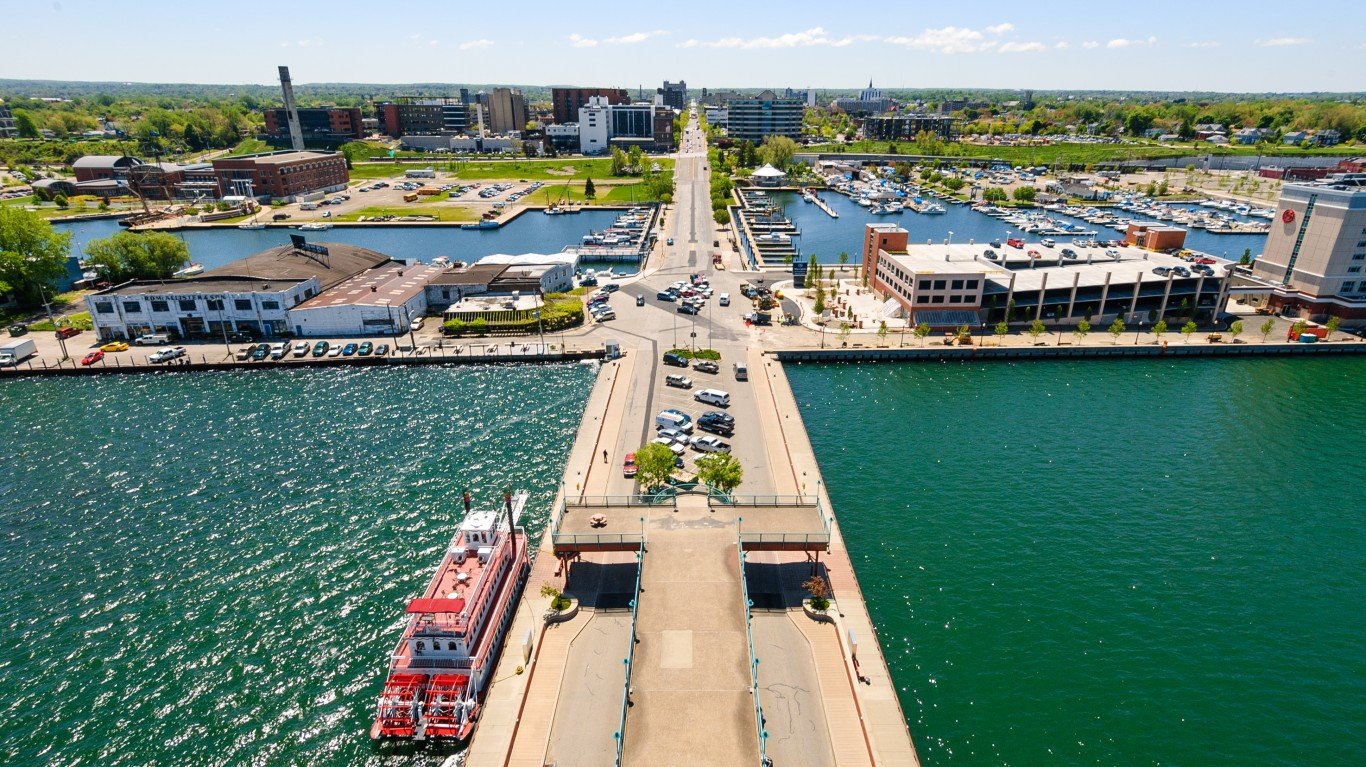
15. Erie, PA
> Black population: 18,700 (6.8% of total)
> Black median income: $24,180 (43.8% of white income)
> Unemployment: 12.1% (Black); 4.6% (white)
> Homeownership rate: 29.5% (Black); 69.8% (white)
The Erie, Pennsylvania, metro area has one of the lowest median household incomes for Black residents, at $24,180. White households earn more than twice as much, with a median of $55,202 — one of the largest gaps in the country.
The Erie metro area has one of the highest Black poverty rates in the country at 41.0%. The national Black poverty rate is 23.0%. The area’s white poverty rate of 13.2% is slightly higher than the U.S. white poverty rate of 11.1%.
[in-text-ad]
Source: DebraMillet / Getty Images
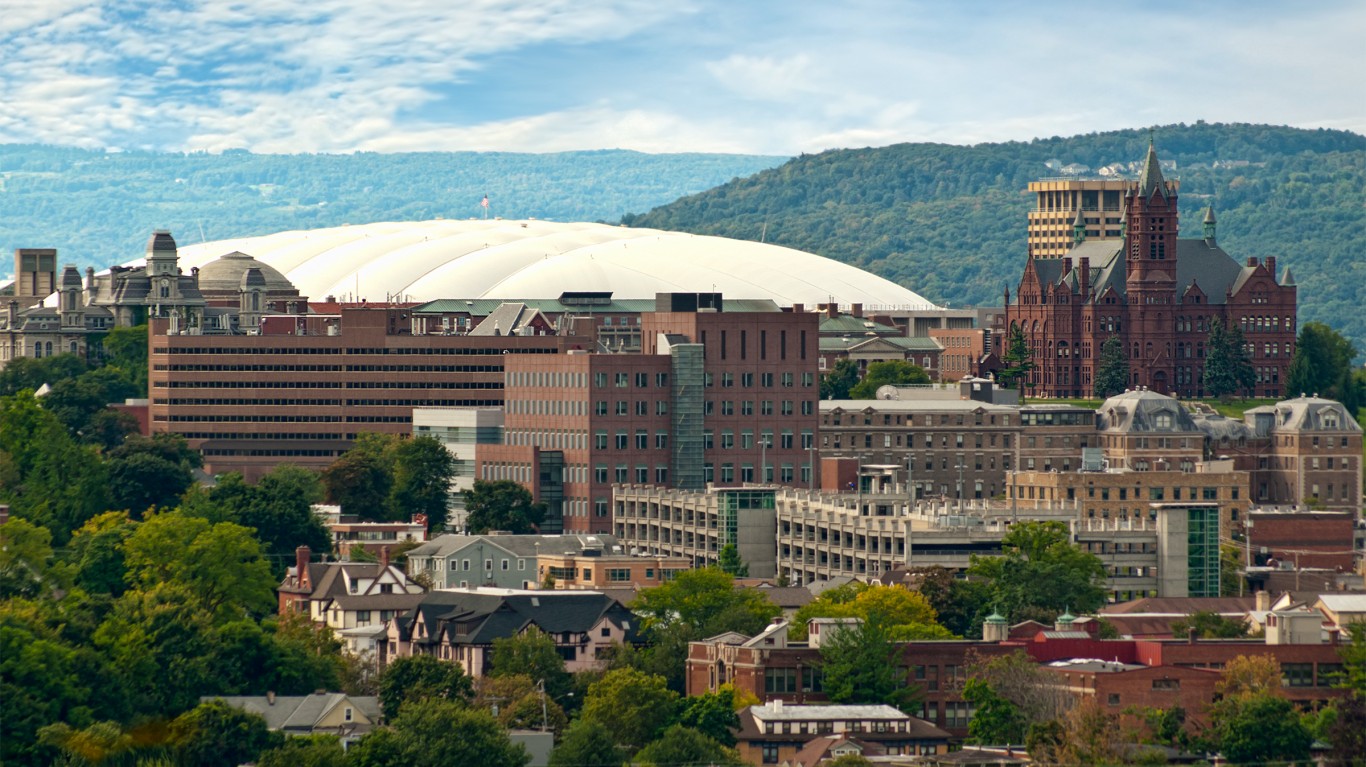
14. Syracuse, NY
> Black population: 52,515 (8.0% of total)
> Black median income: $33,256 (51.4% of white income)
> Unemployment: 13.1% (Black); 4.5% (white)
> Homeownership rate: 29.5% (Black); 72.2% (white)
Syracuse ranks as one of the worst cities for Black Americans in large part because of the educational attainment gap between white and Black residents. The metro area’s white high school attainment rate of 92.7% is closely in line with the national rate. But the Black high school attainment rate is just 78.3%, one of the lowest among the 383 metro areas in the U.S. An estimated 33.1% of white residents 25 and older have bachelor’s degrees, more than double the Black bachelor’s degree attainment rate of 14.0%.
There is an 11.9 percentage point gap between the poverty rates of white and Black Americans nationwide — 11.1% of white Americans live in poverty, compared to 23.0% of Black Americans. In Syracuse, that disparity is more than twice as high. In the area, 35.2% of Black residents live below the poverty line, compared to 11.3% of white area residents.
 24/7 Wall St.
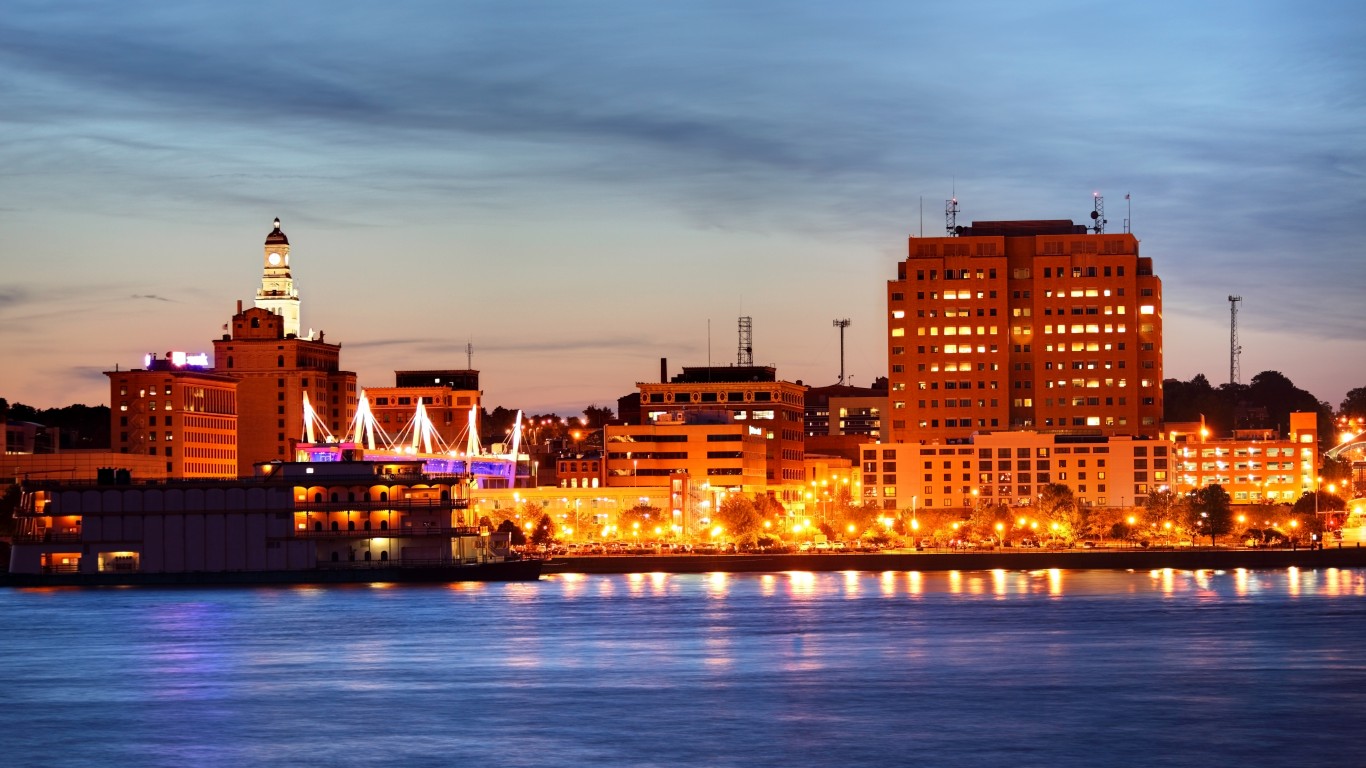
Source: DenisTangneyJr / E+ via Getty Images
13. Davenport-Moline-Rock Island, IA-IL
> Black population: 28,044 (7.4% of total)
> Black median income: $33,792 (55.2% of white income)
> Unemployment: 13.6% (Black); 3.7% (white)
> Homeownership rate: 31.1% (Black); 74.2% (white)
The Davenport metro area ranks as one of the worst places for Black Americans in part due to the wide disparity in its educational attainment between white and Black residents. The high school attainment rate among white adult residents of 93.5% is slightly above the U.S. white high school attainment rate of 92.9%. Among Black area residents, the high school attainment rate is just 79.5%, well below the 86.0% Black high school attainment rate nationwide.
The Davenport metro area is primarily located in Iowa, a state with one of the largest racial disparities in incarceration. For every 100,000 Black Iowa residents, 2,191 are incarcerated. The white incarceration is roughly 10 times lower, at 224 incarcerations per 100,000 residents.

12. Niles, MI
> Black population: 22,368 (14.5% of total)
> Black median income: $25,068 (44.6% of white income)
> Unemployment: 13.1% (Black); 4.7% (white)
> Homeownership rate: 36.8% (Black); 76.7% (white)
Niles is a metro area in southwestern Michigan. The area’s Black median household income is one of the lowest in the country, at just over $25,000. The white median household income is well more than twice as high, at $56,199.
Niles also has a large gap in poverty rate between white and Black residents. While more than 40% of Black residents live in poverty, just 11.3% of white residents do. Overall, Niles’ unemployment rate is relatively high, at 5.9% compared to the national unemployment rate of 5.3%. Yet the Black unemployment rate is 13.1%, whereas the white unemployment rate is 4.7%.
[in-text-ad-2]

Source: Davel5957 / Getty Images
11. Des Moines-West Des Moines, IA
> Black population: 34,128 (5.0% of total)
> Black median income: $37,716 (51.3% of white income)
> Unemployment: 8.8% (Black); 3.4% (white)
> Homeownership rate: 28.4% (Black); 72.7% (white)
The Des Moines, Iowa, metro area ranks as one of the worst cities for Black Americans in part due to the large disparity in health measures between white and Black residents. The white age-adjusted mortality rate is 717 deaths per 100,000 residents, which is slightly lower than the national rate. Black residents have a far higher age-adjusted mortality rate at 1,116 deaths per 100,000 residents. This is the sixth worst disparity in mortality rate among the nearly 400 U.S. metro areas.
The high school attainment rate for white adult residents is relatively high in Des Moines, at 95.6%. Yet the high school attainment rate for Black residents of the metro area is low, at 84.6%, below the 86.0% high school attainment rate for Black adults nationwide.
Source: Davel5957 / Getty Images
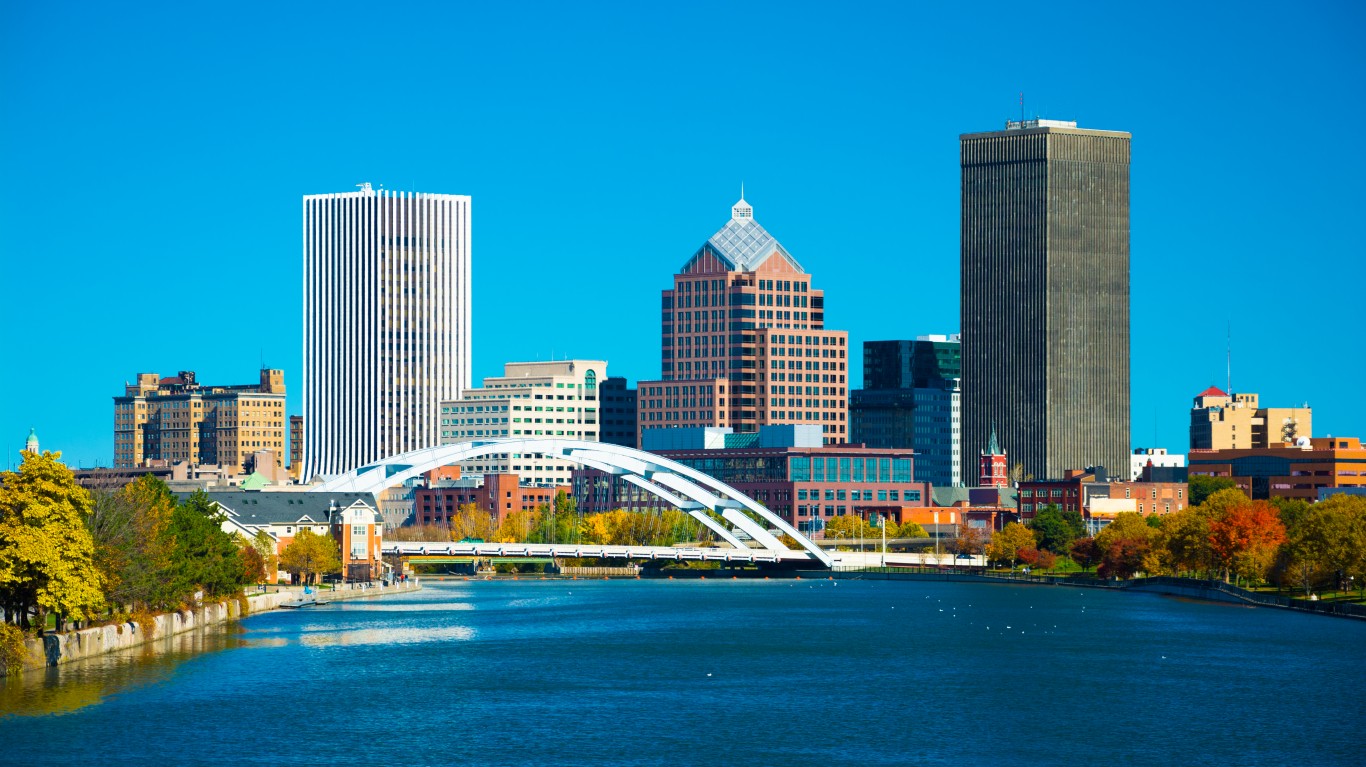
10. Rochester, NY
> Black population: 116,602 (10.9% of total)
> Black median income: $31,920 (48.2% of white income)
> Unemployment: 12.5% (Black); 3.7% (white)
> Homeownership rate: 31.9% (Black); 72.9% (white)
The Rochester, New York, metro area has some of the widest gaps in educational attainment rates between white and Black residents among all metro areas. An estimated 93.5% of white Rochester adult residents have a high school diploma and 38.4% have at least a bachelor’s degree — both of which are slightly higher than the respective national rates. The high school attainment rate among Black residents 25 and older is far lower, at 78.2%, and the bachelor’s degree attainment rate is 14.2%, both well below the rates for Black Americans nationwide.
White residents of the Rochester area have a median household income of more than $66,000. Most Black households earn less than half that much, as the median household income is just under $32,000.
[in-text-ad]

Source: aimintang / E+ via Getty Images
9. Trenton-Princeton, NJ
> Black population: 73,029 (19.8% of total)
> Black median income: $46,675 (47.1% of white income)
> Unemployment: 11.7% (Black); 4.4% (white)
> Homeownership rate: 40.0% (Black); 69.8% (white)
Of the 20 worst places for Black Americans, the Trenton-Princeton metro area has the highest share of Black residents, at 19.8% of the total population, or just over 73,000 people. When compared to the national median Black household income, the metro area has a relatively high median income for Black households, at $46,675. Still, the white median household income is more than twice as high, at just over $99,000, and the income gap is one of the largest.
This income disparity between white and Black residents may be due in large part to the education gap. More than 51% of the Trenton area’s white residents 25 and older hold at least a bachelor’s degree. Yet just 18.4% of Black residents 25 and older have at least a bachelor’s degree. This 32.7 percentage point difference is the sixth largest educational attainment gap in the nation.
 24/7 Wall St.
8. Danville, IL
> Black population: 10,837 (14.0% of total)
> Black median income: $26,039 (51.7% of white income)
> Unemployment: 16.0% (Black); 5.2% (white)
> Homeownership rate: 30.8% (Black); 75.2% (white)
Danville, Illinois, has one of the widest gaps in poverty rates between white and Black residents, though both are relatively high. In the metro area, 46.7% of Black residents live below the poverty line, compared to just 14.4% of white residents.
The Danville area has among the lowest incomes across all metro areas regardless of race, but the gap is still wide. While the area’s median annual household income is $46,515, white households have a median income of $50,318, and Black households have a median income of just over $26,000. Black Danville residents 25 and older have the second-lowest bachelor’s degree attainment rate among U.S. metro areas, at just 4.3%. Nationwide, 21.6% of Black Americans hold at least a bachelor’s degree. White residents of Danville 25 and older have a 16.1% bachelor’s degree attainment rate.

Source: StevenGaertner / Getty Images
7. Minneapolis-St. Paul-Bloomington, MN-WI
> Black population: 300,039 (8.4% of total)
> Black median income: $39,294 (45.5% of white income)
> Unemployment: 8.1% (Black); 2.8% (white)
> Homeownership rate: 25.5% (Black); 75.5% (white)
The Minneapolis-St. Paul-Bloomington metro area in Minnesota and Wisconsin ranks as one of the worst metro areas for Black Americans. The over 300,000 Black area residents make up 8.4% of the total population, well below the 12.3% population share of Black Americans nationwide.
Homeownership is a common way for many Americans to build wealth, yet the homeownership rate is just 25% among Black metro area residents compared to more than 75% among white area residents.. Most Black households in the area earn less than $40,000 per year, while the median income for white households is $86,291.
[in-text-ad-2]
Source: Jacob Nichols / iStock via Getty Images
6. Waterloo-Cedar Falls, IA
> Black population: 12,737 (7.5% of total)
> Black median income: $29,150 (47.7% of white income)
> Unemployment: 14.7% (Black); 3.1% (white)
> Homeownership rate: 31.6% (Black); 72.7% (white)
The Waterloo-Cedar Falls metro area of Iowa has one of the largest unemployment gaps between white and Black residents. The 3.1% five-year unemployment rate for white residents is well below the 5.3% national unemployment rate. The Black unemployment rate is nearly five times higher, at 14.7%.
This wide gap in unemployment rate has likely contributed at least in part to the wide gap in the poverty rate in the Waterloo-Cedar Falls metro area. Less than 12% of white area residents live in poverty, compared to more than one-third of all Black residents.
Source: benkrut / Getty Images
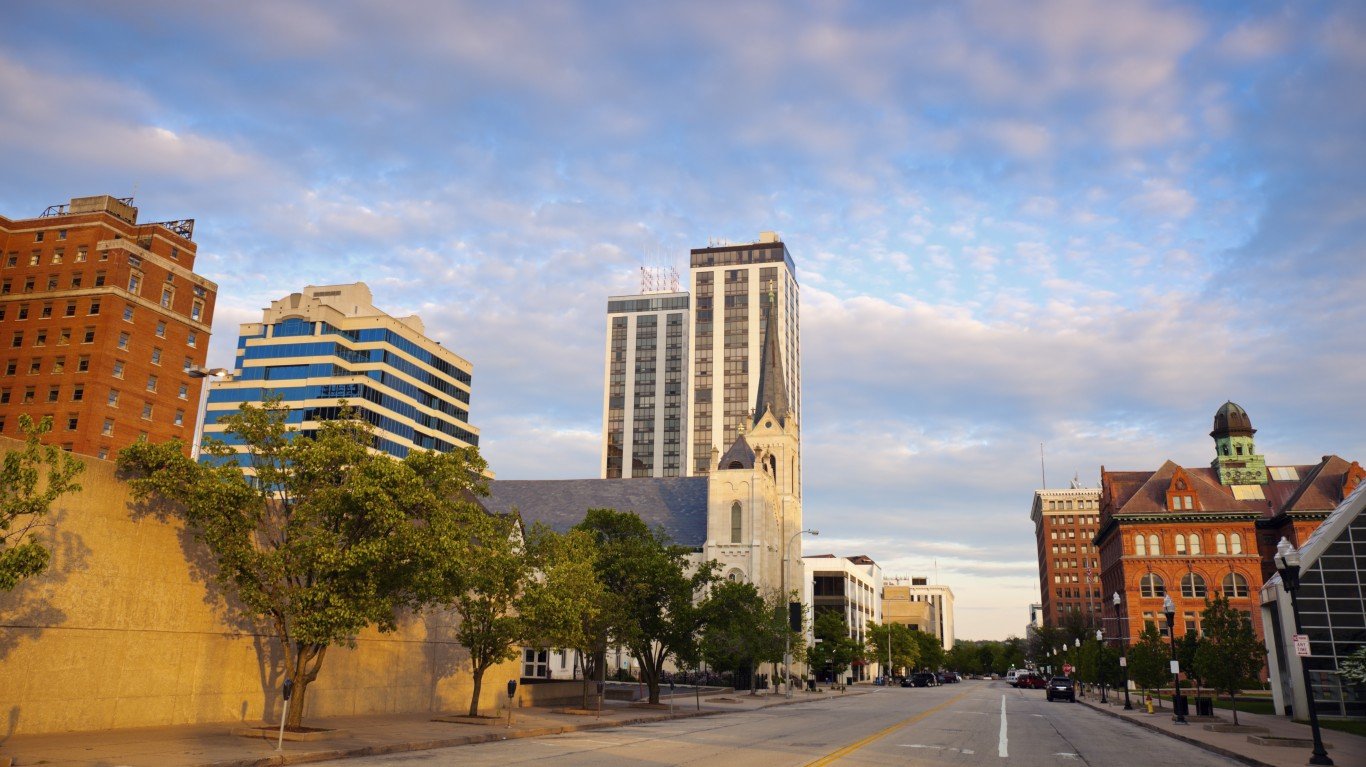
5. Peoria, IL
> Black population: 35,463 (8.7% of total)
> Black median income: $27,977 (45.2% of white income)
> Unemployment: 16.2% (Black); 4.8% (white)
> Homeownership rate: 31.4% (Black); 76.5% (white)
The Peoria metro area is one of five metro areas at least partially located in Illinois to rank among the 20 worst for Black Americans. The median income for Black households is less than $28,000 — less than half of what the typical white household in the area earns. White residents are also more than twice as likely to own their home as Black residents, with a 76.5% to 31.4% homeownership rate disparity.
There is a strong association between income and educational attainment. The white high school attainment rate in Peoria is 93.3%, slightly above the white nationwide average. Black Peoria residents have a high school attainment rate of just 80.3%, well below the 86.0% Black high school attainment rate across the U.S.
[in-text-ad]
Source: pabradyphoto / Getty Images
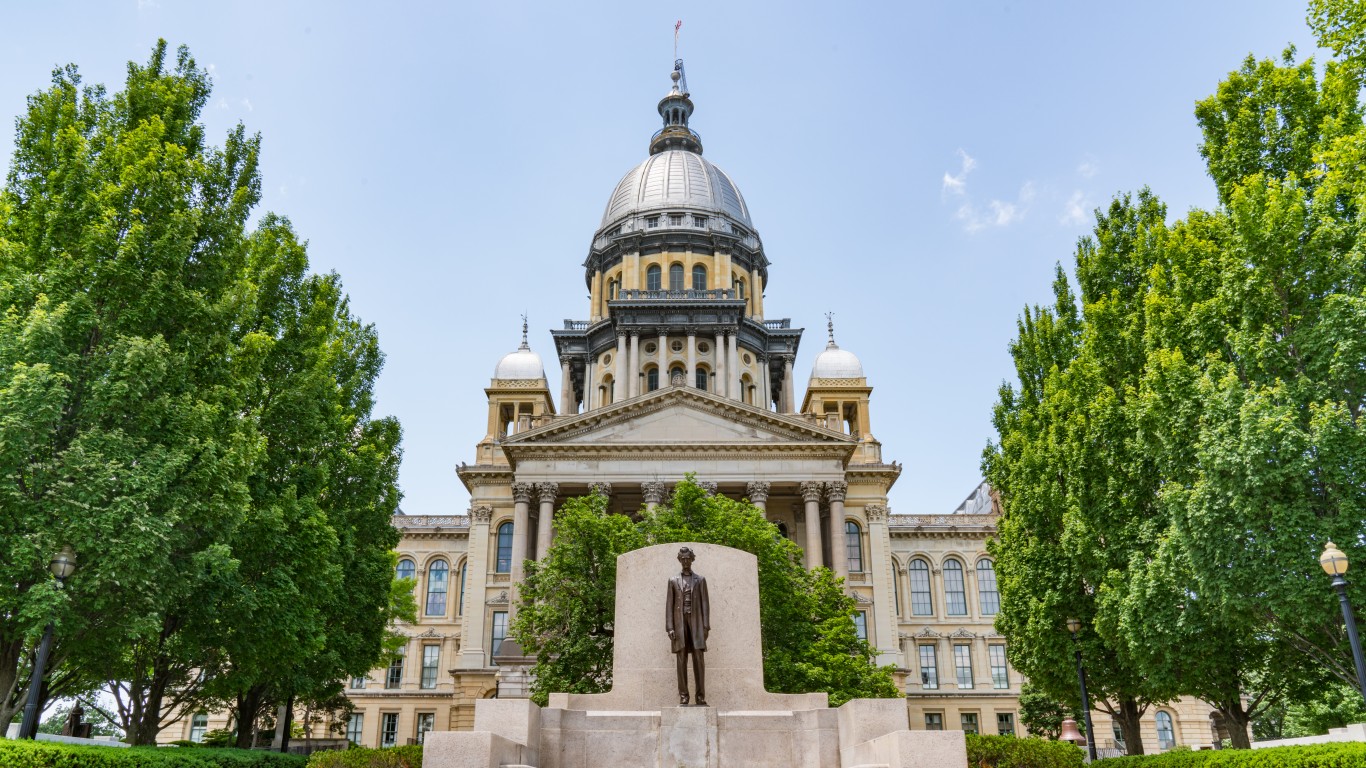
4. Springfield, IL
> Black population: 25,009 (12.0% of total)
> Black median income: $27,020 (40.1% of white income)
> Unemployment: 15.4% (Black); 4.4% (white)
> Homeownership rate: 28.6% (Black); 75.3% (white)
Springfield, Illinois, ranks as one of the worst places for Black Americans in large part because of the wide gap in the poverty rates of its white and Black area residents. Just 10.2% of white Springfield residents live in poverty, compared to 11.1% of white Americans overall. A significantly larger share, 39.2%, of Black residents live below the poverty line, well above the national black poverty rate of 23.0%.
Springfield also has one of the largest income gaps between Black and white residents. White households have a median income of $67,422. The median income of Black households is more than $40,000 lower, at $27,020.
 24/7 Wall St.
Source: Sean Pavone / Getty Images
3. Milwaukee-Waukesha, WI
> Black population: 256,974 (16.3% of total)
> Black median income: $31,257 (42.3% of white income)
> Unemployment: 10.1% (Black); 2.9% (white)
> Homeownership rate: 27.0% (Black); 68.7% (white)
The Milwaukee metro area of Wisconsin ranks as one of the worst places for Black Americans. In addition to economic struggles, Black residents face significant health challenges, especially relative to white residents. The overall U.S. age-adjusted mortality rate is 723 deaths per 100,000 residents. For Black Milwaukee residents, the mortality rate is 1,046 deaths per 100,000, while for white residents it is just under 700 deaths per 100,000.
In Wisconsin, Black residents are 12 times more likely to be incarcerated as white residents. The Black incarceration rate is 2,764 per 100,000 — more than double the U.S. Black incarceration rate of 1,239 per 100,000. The white incarceration rate in Wisconsin is 415 per 100,000, slightly above the U.S. white incarceration rate.
Source: DenisTangneyJr / Getty Images
2. Racine, WI
> Black population: 21,610 (11.0% of total)
> Black median income: $25,751 (36.5% of white income)
> Unemployment: 9.7% (Black); 3.6% (white)
> Homeownership rate: 26.3% (Black); 74.0% (white)
The Racine, Wisconsin, metro area has one of the largest income gaps between white and Black residents of any U.S. metro area. The Black median annual household income is $25,751, just 36.5% of the white median household income of $70,589.
With this income disparity, Black Racine residents are also more than four times as likely to live below the poverty line as white residents. The area’s Black poverty rate is one of the highest in the nation at 35.3%, while the white poverty rate is relatively low, at 8.7%.
[in-text-ad-2]
Source: Anh Luu / Shutterstock.com
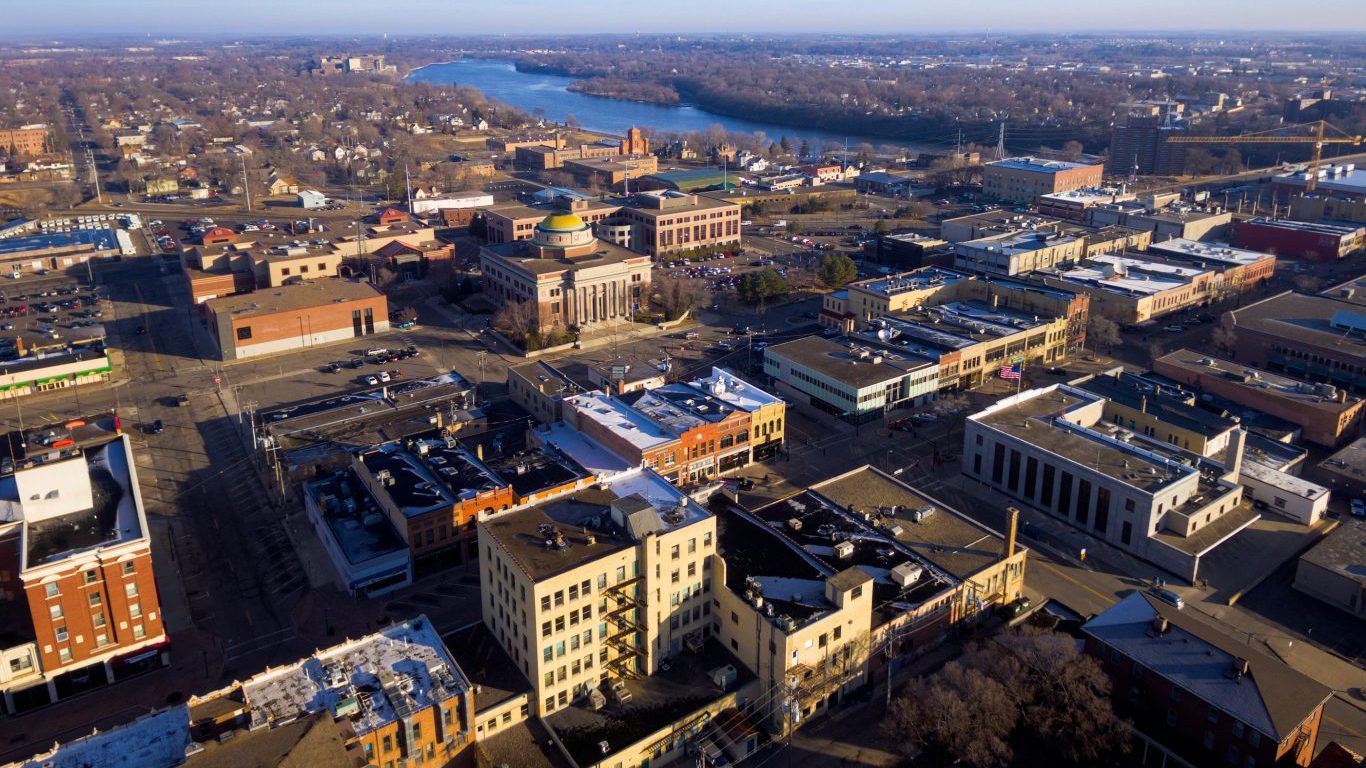
1. St. Cloud, MN
> Black population: 11,768 (5.9% of total)
> Black median income: $26,585 (41.1% of white income)
> Unemployment: 17.2% (Black); 3.4% (white)
> Homeownership rate: 8.2% (Black); 72.3% (white)
The St. Cloud metro area of central Minnesota ranks as the worst city for Black Americans. A number of socioeconomic indicators are significantly better among white area residents than among Black residents. White households have a median annual income of $64,703, well more than double the Black median household income of $26,585. Fewer than 10% of white St. Cloud residents live below the poverty line, yet nearly half of all Black residents do, at 47.7%
The St. Cloud area has the second largest gap in Black and white high school attainment among all U.S. metro areas. The high school attainment rate is 94.0% for white adults, and it is just 60.7% for Black adults. This educational gap may contribute to the relatively high unemployment rate for Black members of the St. Cloud labor force. The area’s Black unemployment rate is one of the higher ones in the country, at 17.2%. The white unemployment rate is relatively low, at just 3.4%. For context, the comparable U.S. unemployment rate is 5.3%.
Methodology:
To determine the worst cities for Black Americans, 24/7 Wall St. created an index of eight variables measuring racial socioeconomic gaps in each of the nation’s 383 metropolitan areas. For each city we evaluated the gap between white and Black residents in poverty, high school and college education, income, homeownership, unemployment, mortality, and incarceration.
Creating the index in this way means cities are ranked based on the relative differences between Black and white residents and not on absolute levels of socioeconomic development, which, if used for the ranking, would result in a list of cities with the worst social and economic measures for anyone regardless of their race.
For each measure, we constructed an index of the gaps between Black and white Americans. The index was standardized using interdecile normalization so outliers in the data did not skew results.
We excluded metro areas where Black residents comprise less than 5% of the population or where data limitations made comparisons between racial groups impossible.
Within the index, we considered data from the U.S. Census Bureau’s 2019 American Community Survey on median household income, poverty, adult high school and bachelor’s degree attainment, homeownership, and unemployment for each racial group. All ACS data are five-year estimates for 2019, the most recent year available.
Data on the number of prisoners in state or federal correctional facilities within a state by race are for 2019 and came from the Bureau of Justice Statistics. These figures were adjusted for population using ACS data. Because states, rather than metro areas, are responsible for the prison population, incarceration rates are for the state where the metro area is located. If a metro area spans more than one state, we used the state in which the metro area’s principal city is located.
We also included age-adjusted mortality rates for the years 2017 to 2019 from the Centers For Disease Control and Prevention. We aggregated mortality rates from the county to the metropolitan level using boundary definitions from the Census Bureau. Incarceration and mortality rates are per 100,000 residents.
Essential Tips for Investing: Sponsored
A financial advisor can help you understand the advantages and disadvantages of investment properties. Finding a qualified financial advisor doesn’t have to be hard. SmartAsset’s free tool matches you with up to three financial advisors who serve your area, and you can interview your advisor matches at no cost to decide which one is right for you. If you’re ready to find an advisor who can help you achieve your financial goals, get started now.
Investing in real estate can diversify your portfolio. But expanding your horizons may add additional costs. If you’re an investor looking to minimize expenses, consider checking out online brokerages. They often offer low investment fees, helping you maximize your profit.
Thank you for reading! Have some feedback for us?
Contact the 24/7 Wall St. editorial team.
Editors' Picks