

Excel-lent Ways to Use PivotTables to Look at Your Reading Habits
Reading habits can be difficult to puzzle out without some tools for the job. The question, “What you have been reading recently?” can be a bit chaotic. Whether you’re looking at a written list, a stack of books, or a spreadsheet, it is a lot to process. Honestly, any approach is fine, but there is something about a well-formatted reading spreadsheet that is incredibly satisfying. I am not a math person, but I do love a well-made spreadsheet in soothing colors. Something about having the numbers and percentages in front of you helps you understand your reading habits.
I like to think of a spreadsheet as a digital bookshelf that logs concrete reading information for you. So, instead of looking at your bookshelf to see what you have been reading, you can look at your reading log spreadsheet. I would like to sell you on the joy of using PivotTables to look at your reading habits a bit further.
So, I am going to look at both Microsoft Excel and Google Sheets, because why not try both? As a jumping-off point, I used the brilliant 2021 reading log template from Book Riot. (Of course, you can also use PivotTables with any book spreadsheet.) Here are some not so mysterious ways to look at your reading habits. It is time to play with PivotTables.
Excel-lent Look at Reading Habits
Let’s start with Microsoft Excel. Highlight your entire table >select Insert >PivotTable >select either New worksheet if you would like the table to be in a new tab or Existing worksheet >select a cell where you would like the table if you would like the table to be in the same tab.
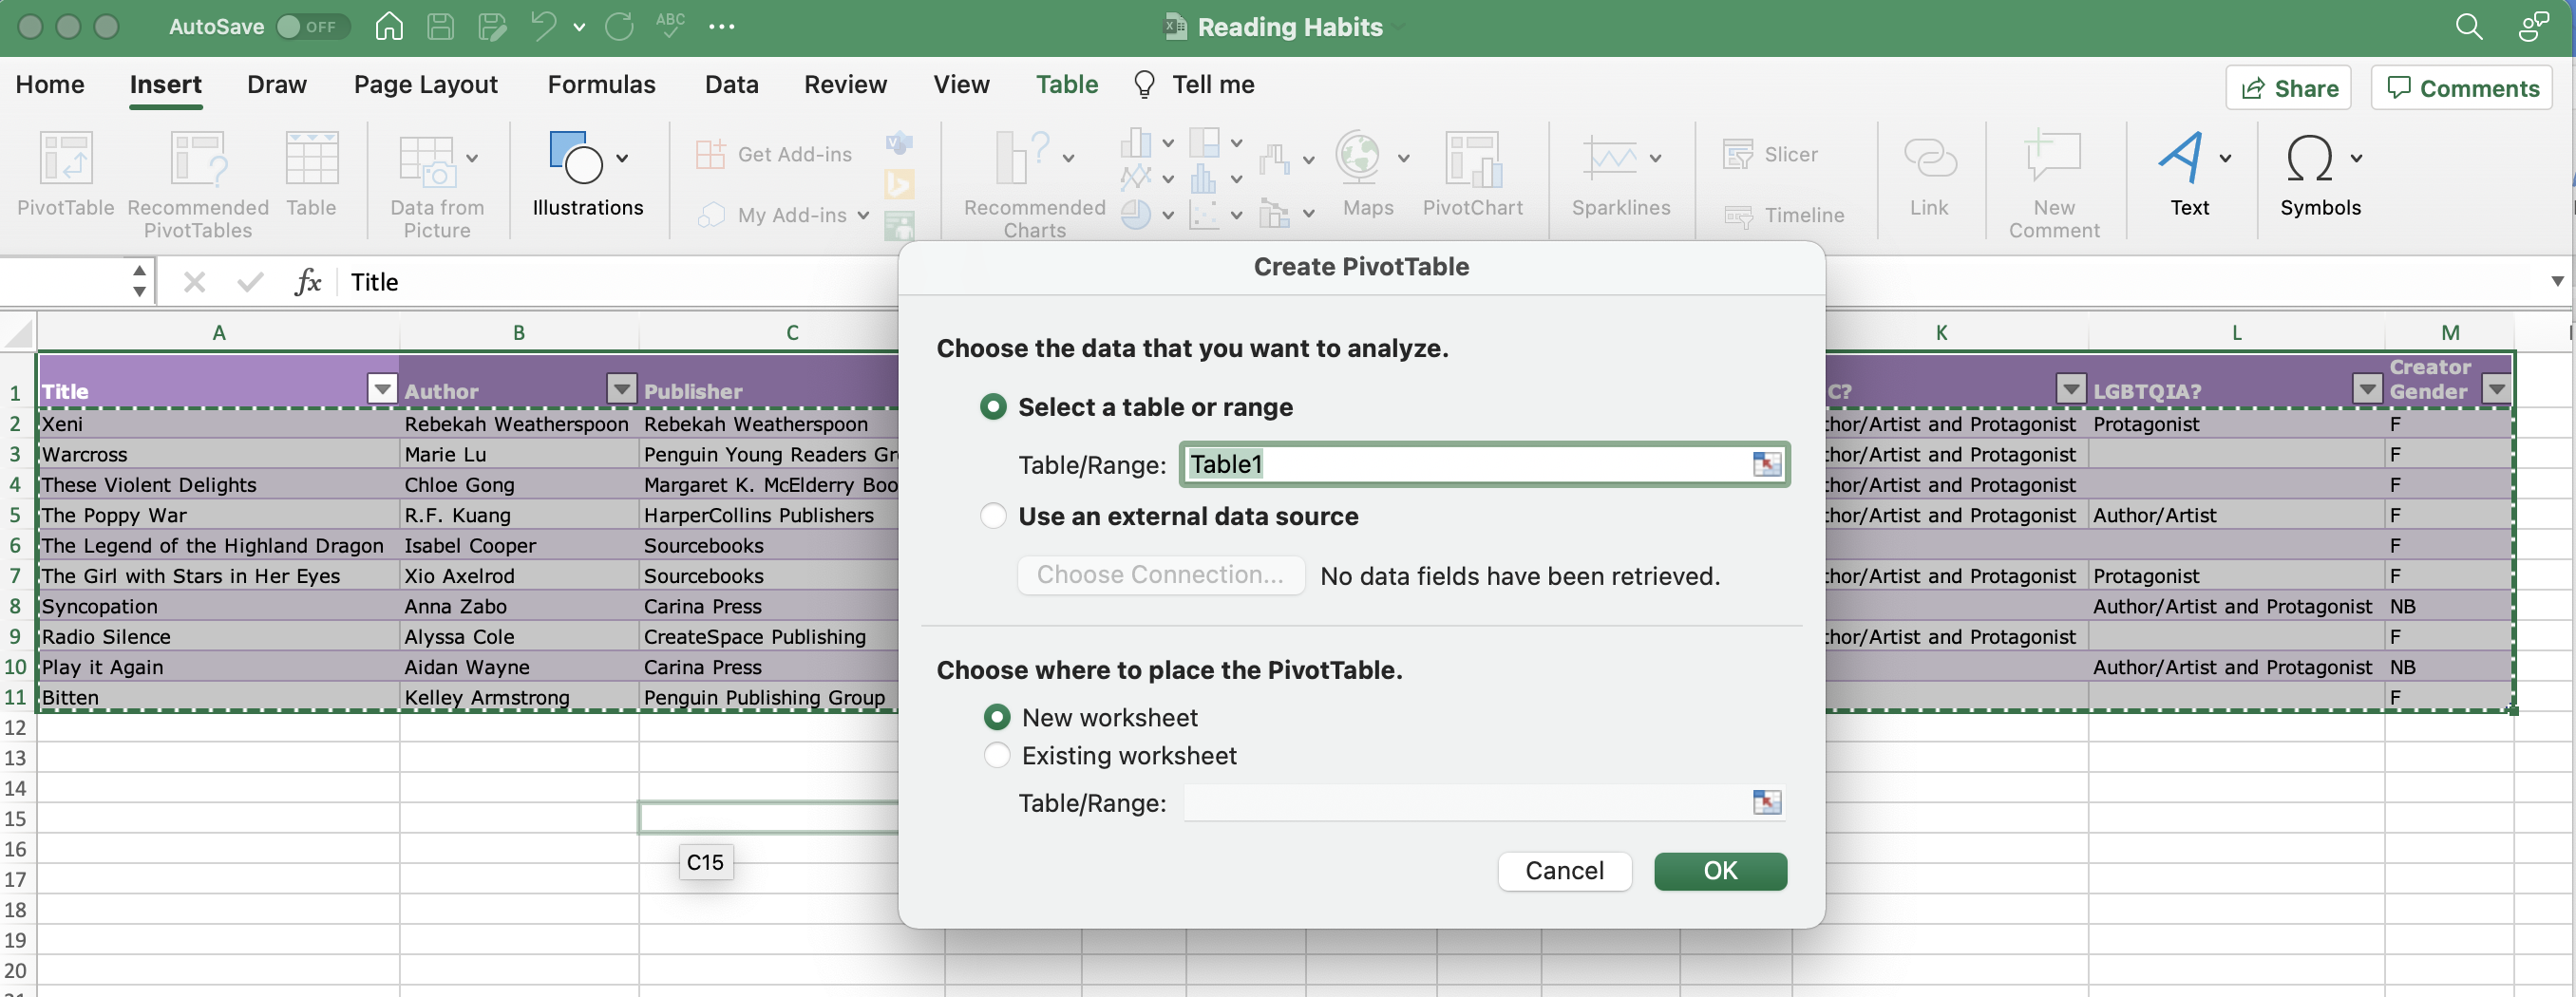
Now, we have a space where we can play around with our information. Check the boxes for the information you would like a count of. I prefer to keep my Count of Title in the Values area. You can drag any selected Field Name to the Filters, Columns, or Rows areas.
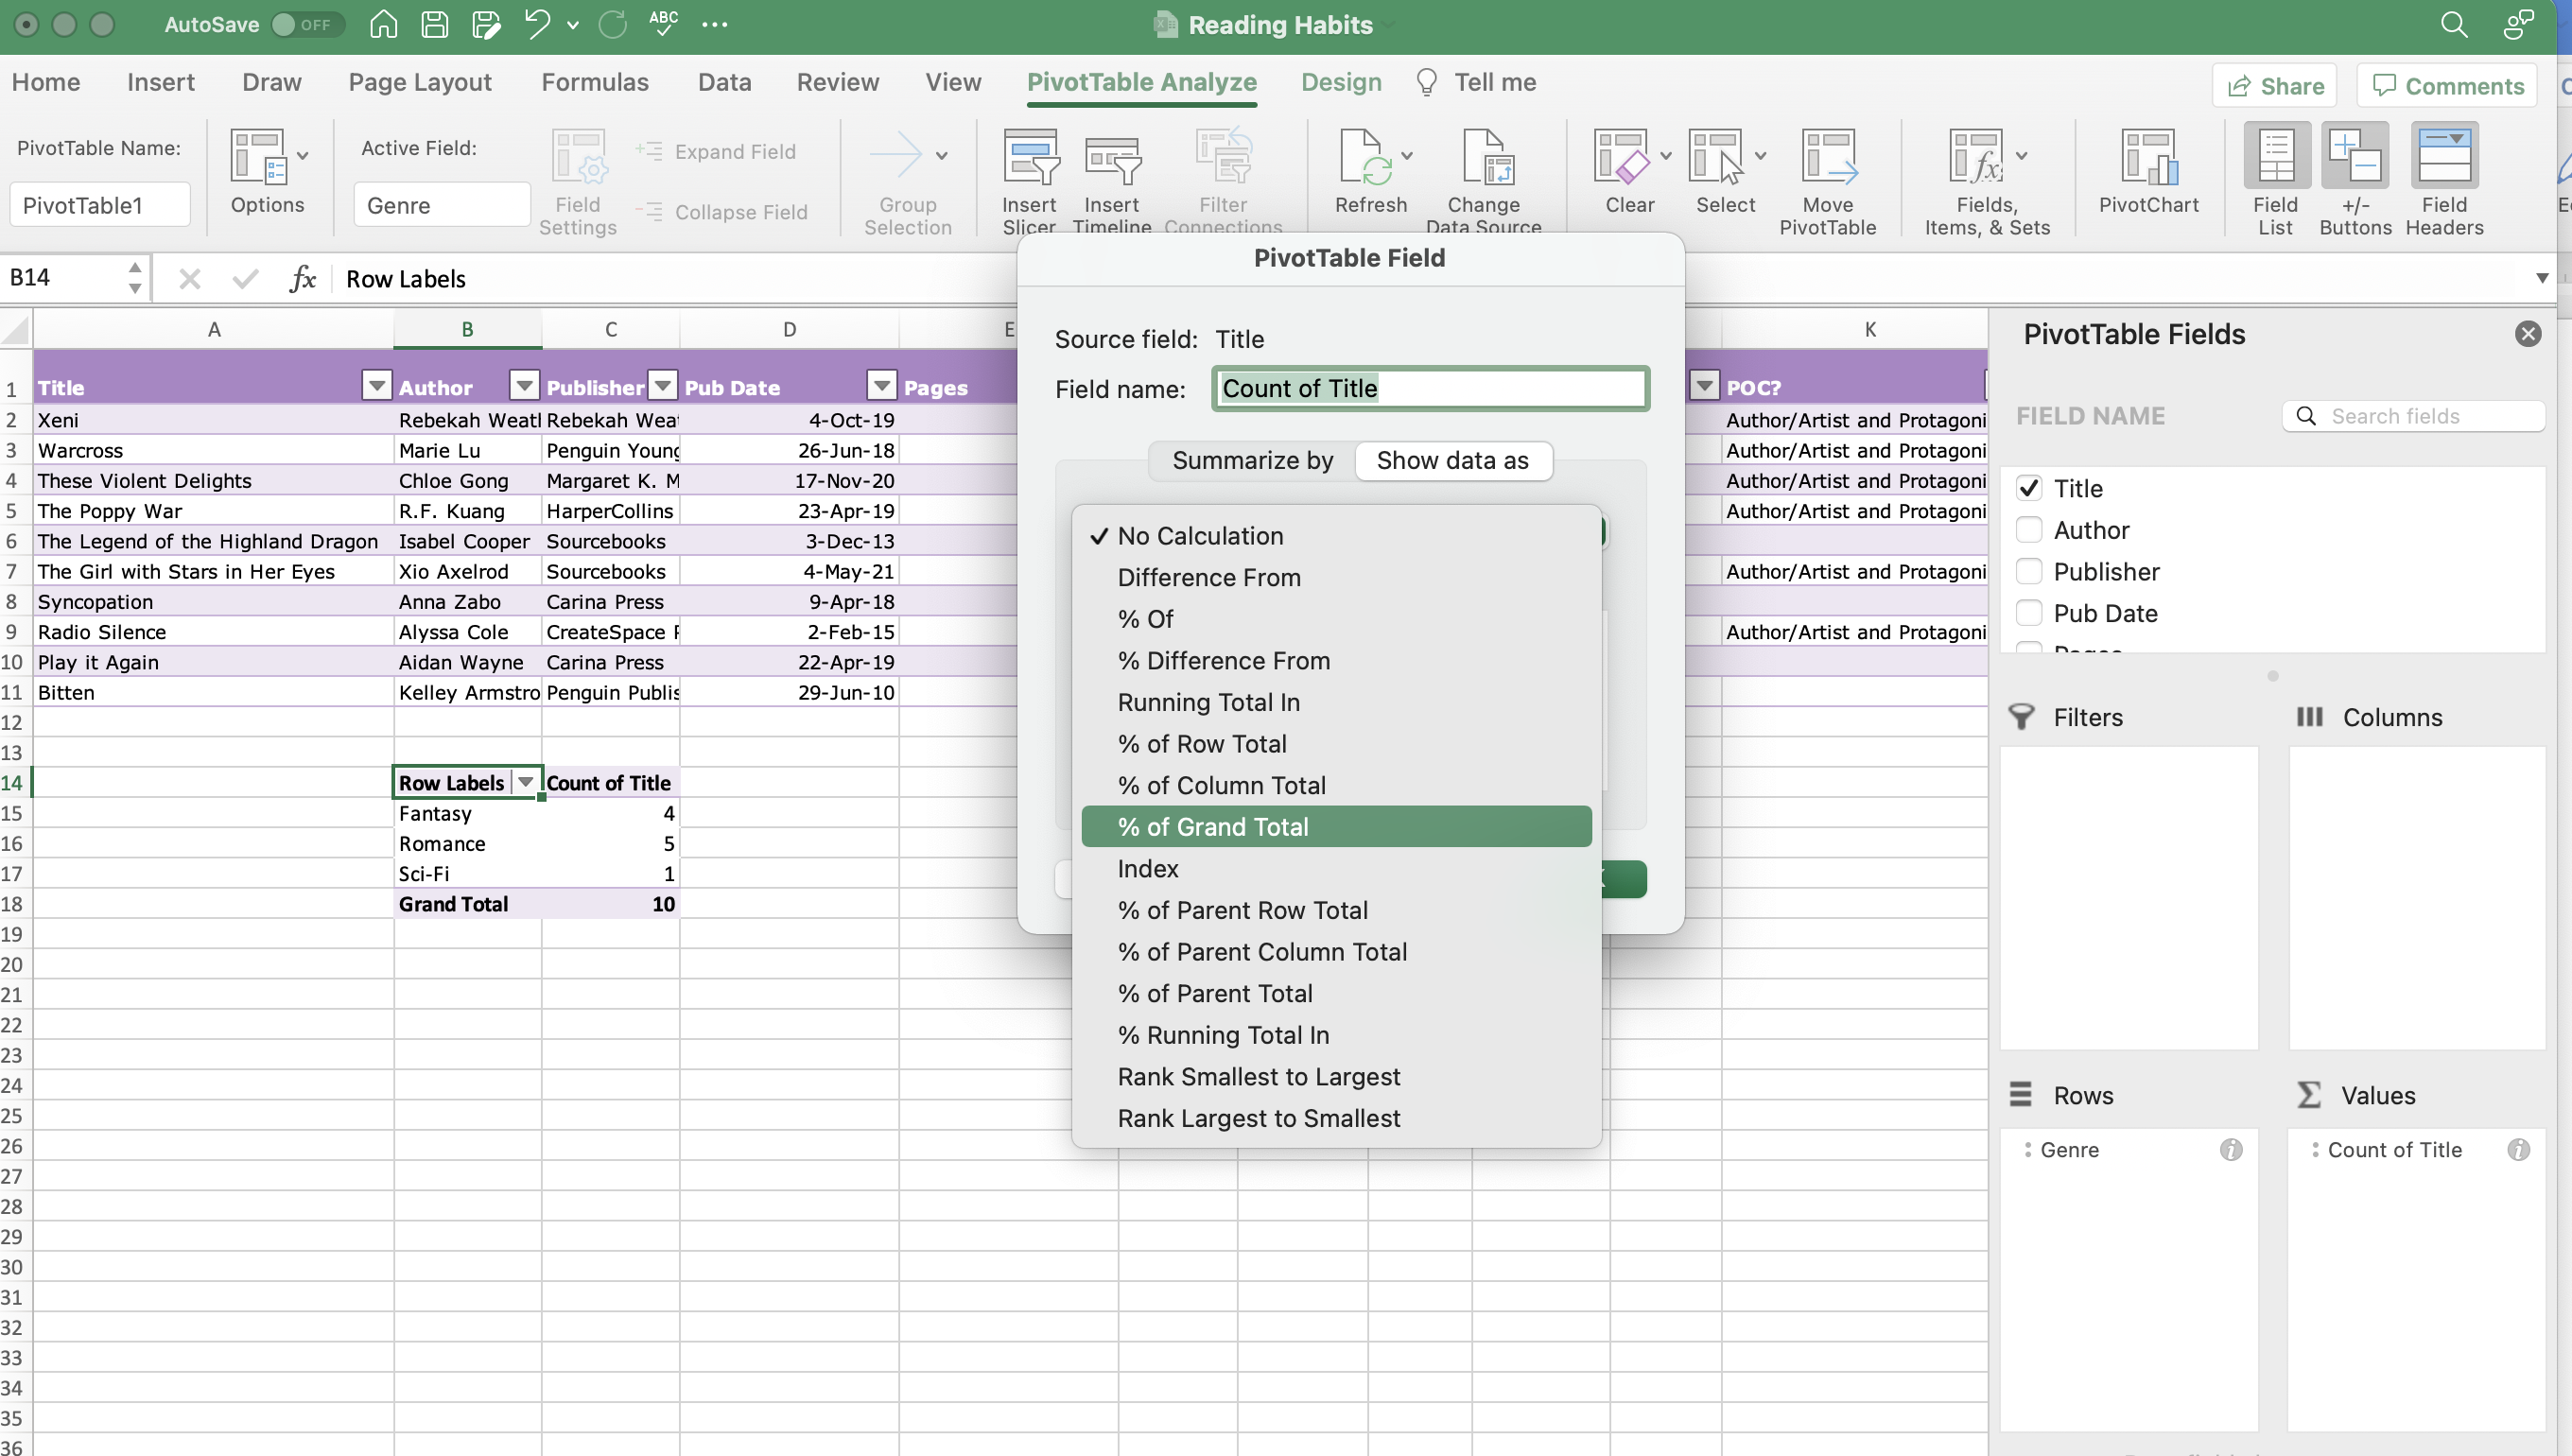
I am going to start with a count of “Genre” by dragging “Genre” to the Rows area. You can also change the count from the number to a percentage of the total by selecting the “i” >Show data as > % of Grand Total. Now I know that half of the books I’ve read on this list are romance novels.
It gets better. You can then double click on the percentage and Excel will generate a new tab with the titles that make up that percentage.
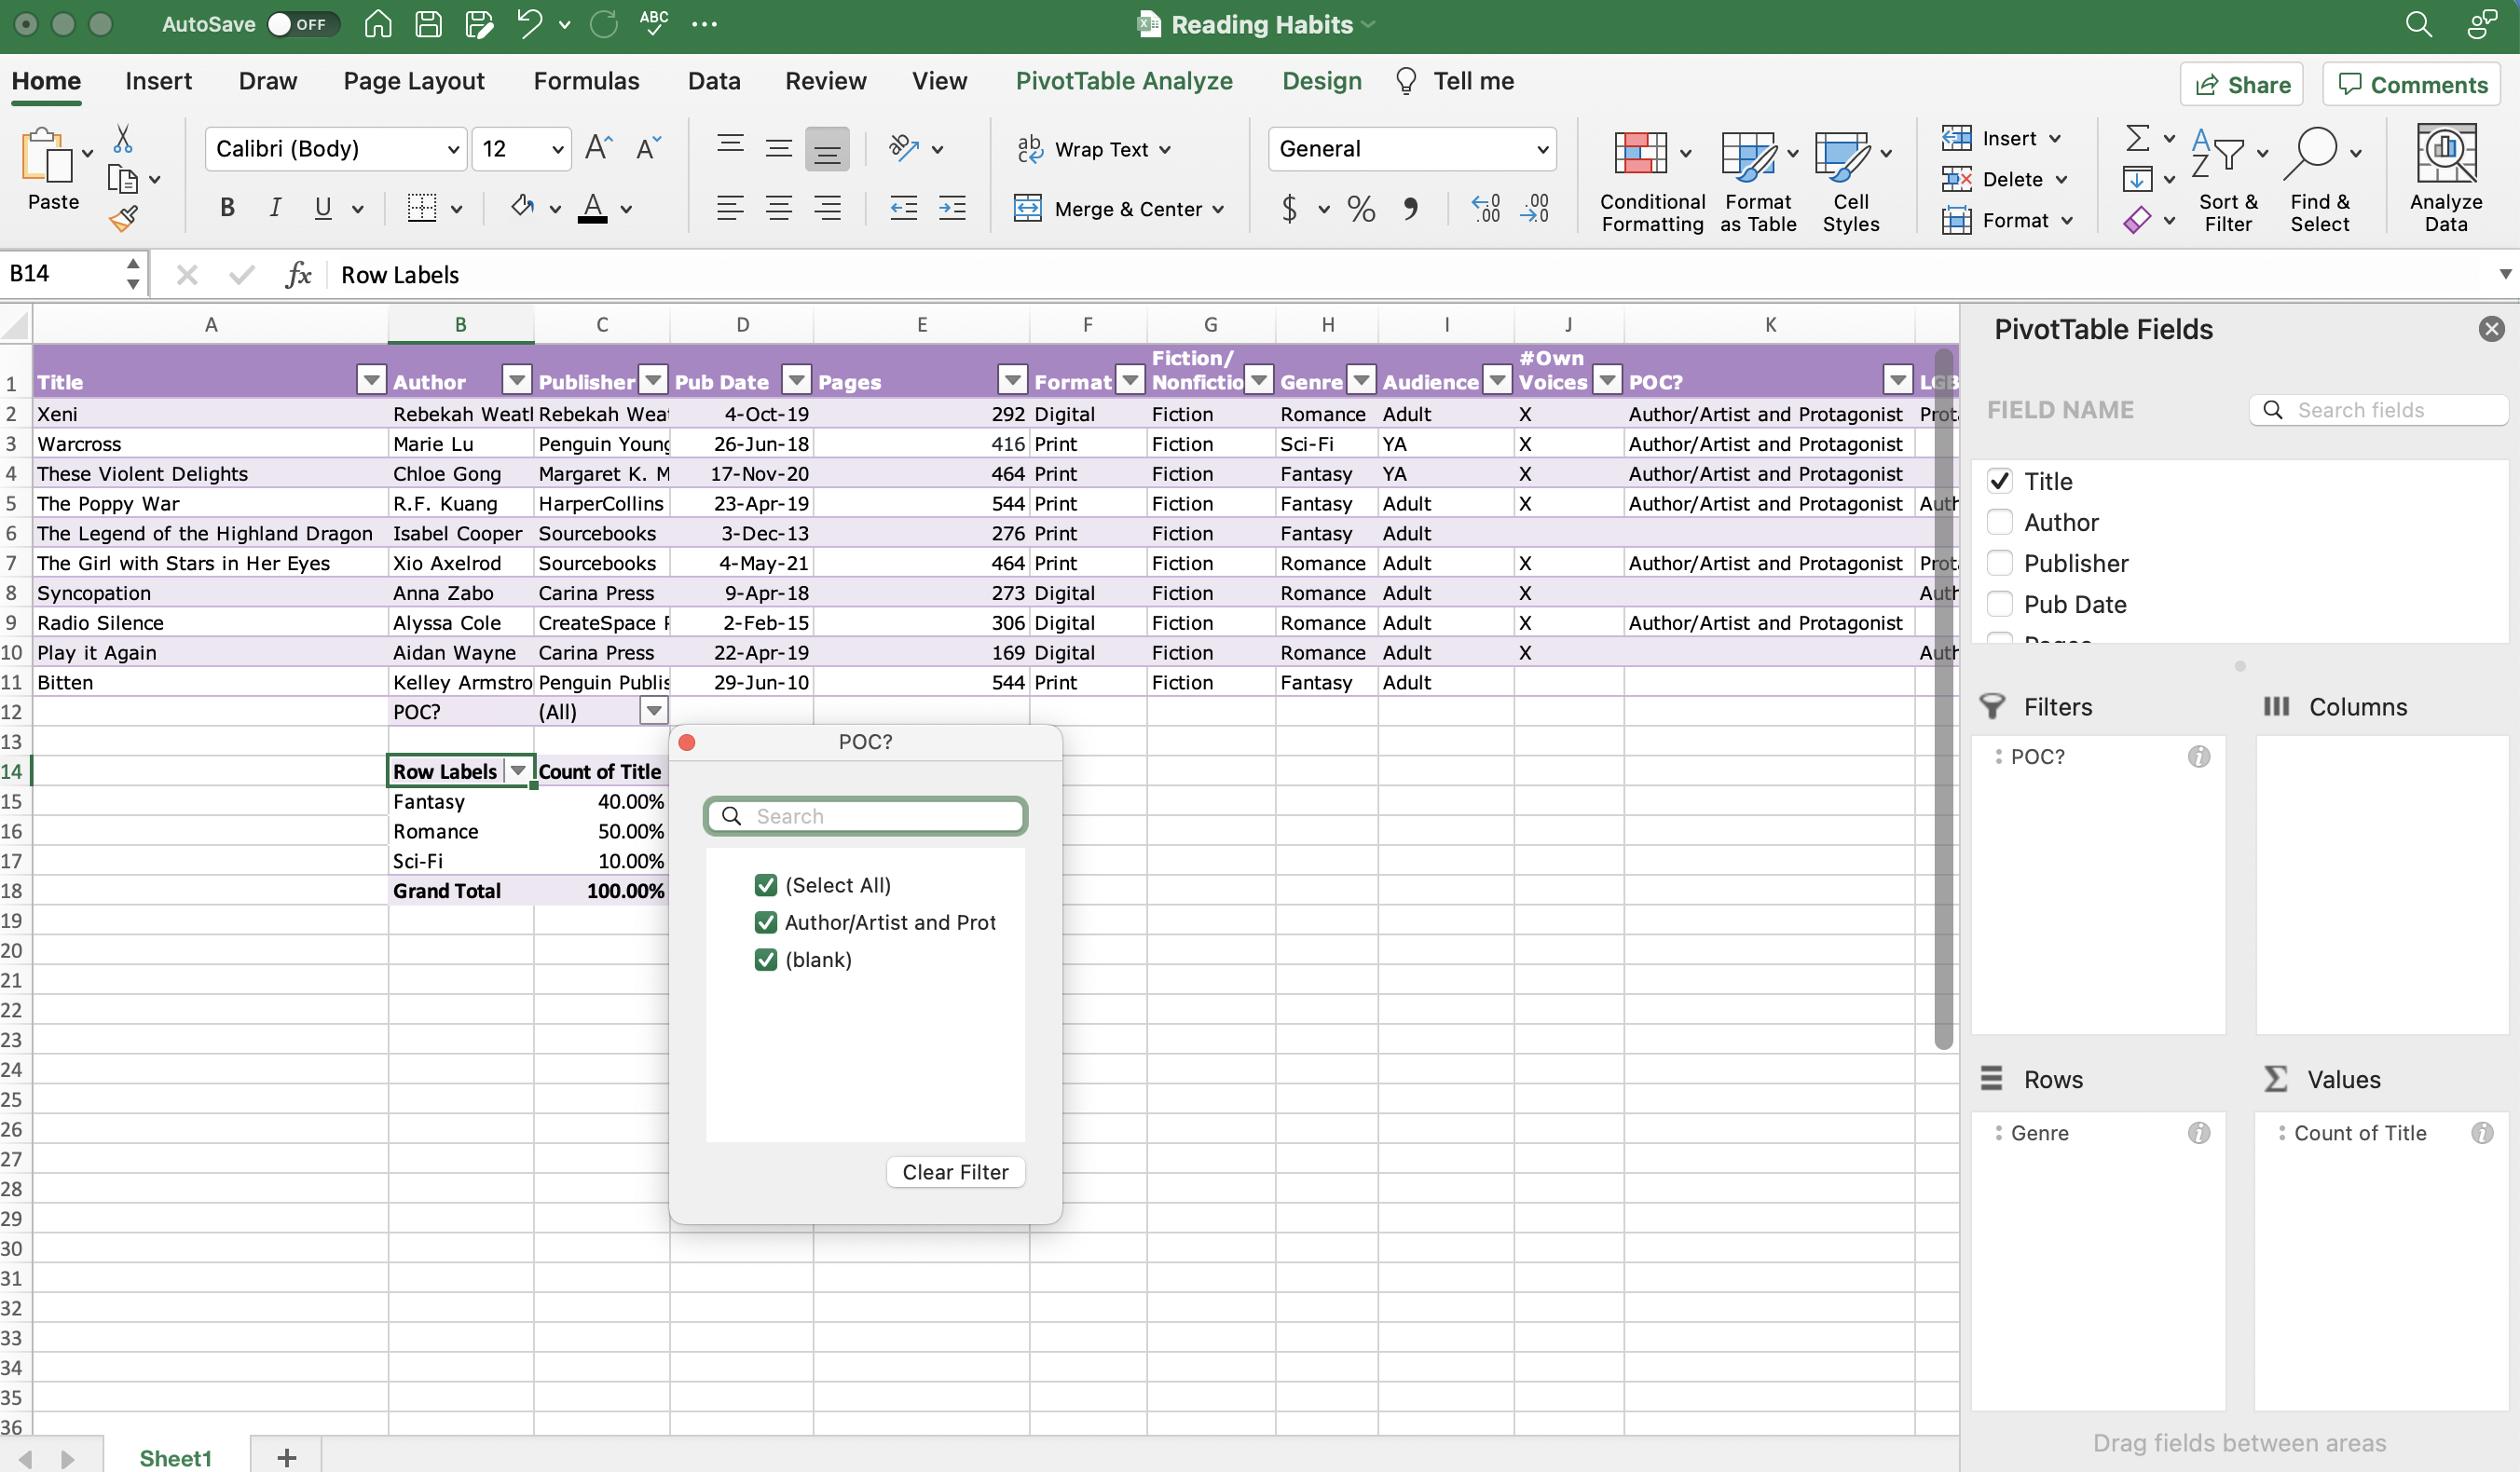
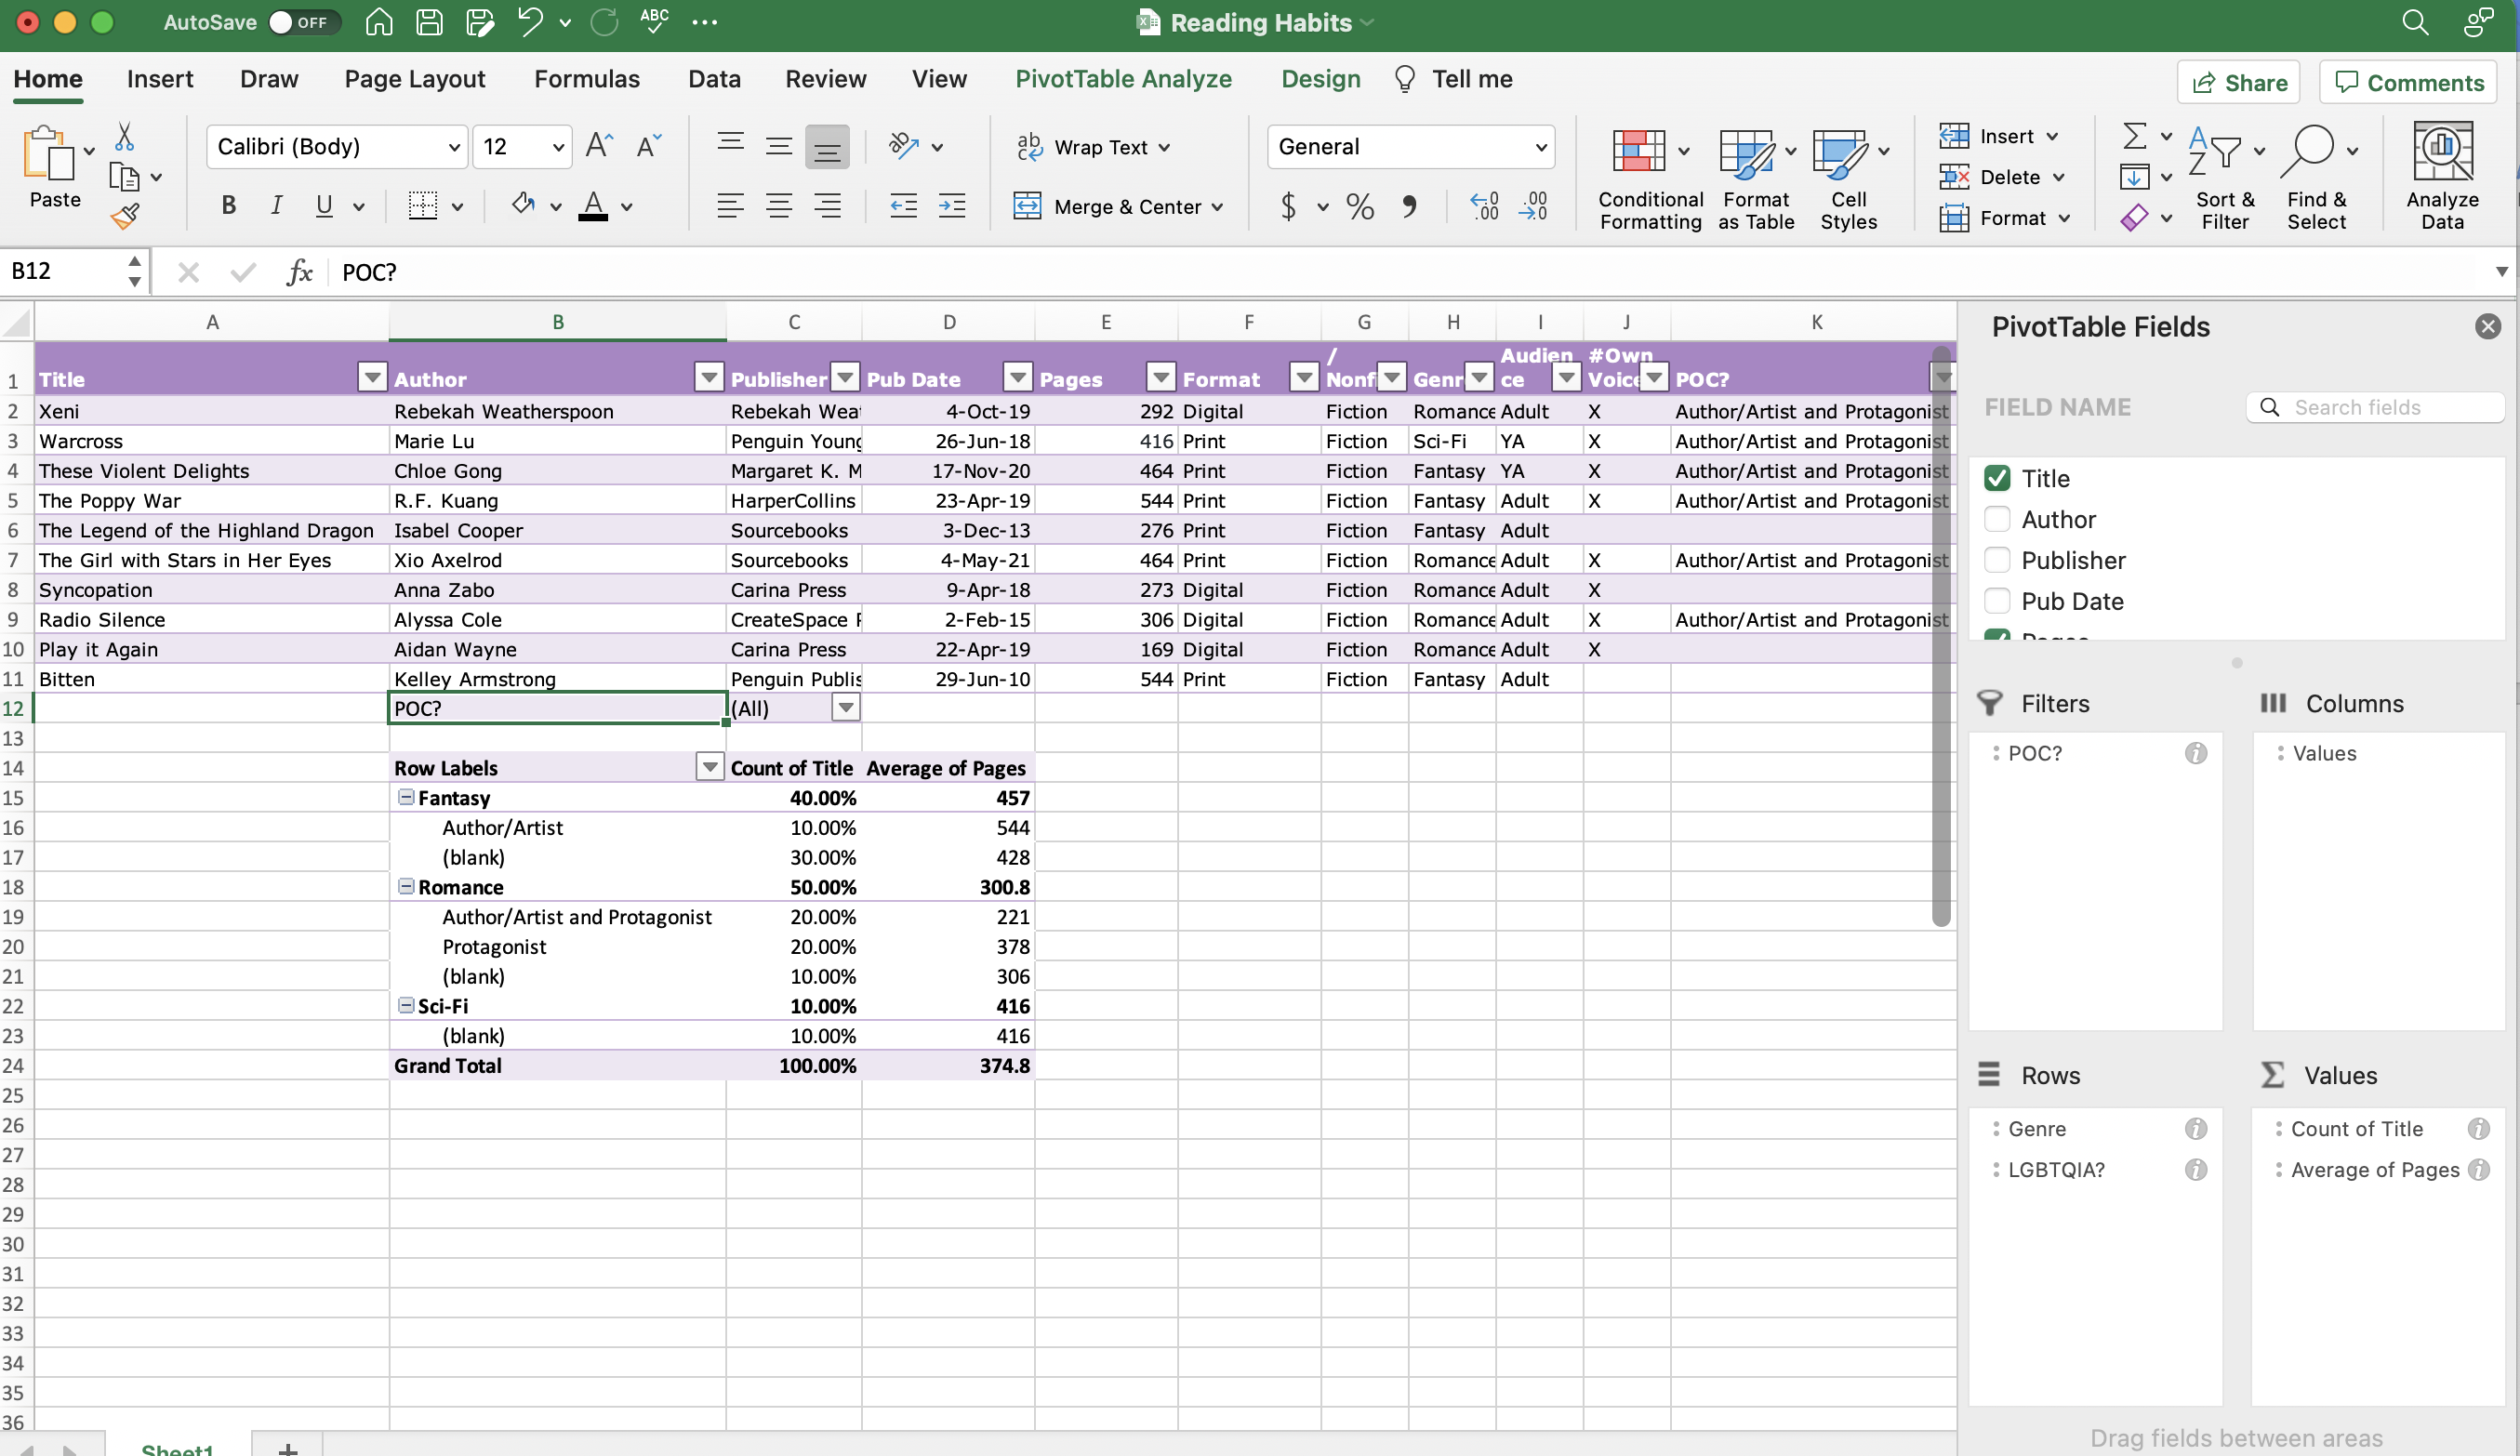
But say you want to know more specifics, like how many romance novels have you read that are written by people of color. Select “POC?” from the Field Name and drag “POC?” into the Row Label. You will now have a breakdown under the Count of Titles. You can also drag “POC?” to the Filters if you want to look at the way selecting different categories changes your chart. The new arrow in the (All) cell has a cute list now. You can select “Author/Artist and Protagonist” and get a new PivotTable with only these titles.
Now that you have the basics down, you can make any combination of fields to easily look at your reading habits. I added the “Pages” Field Name to the Values area and selected Summarize by >Average to see differences in average genre page length. I also added a “POC?” Filter and an “LGBTQIA?” secondary row. Any combination of the four areas and your Field Names can generate new tables for you to examine.
Look at Your Reading Sheets
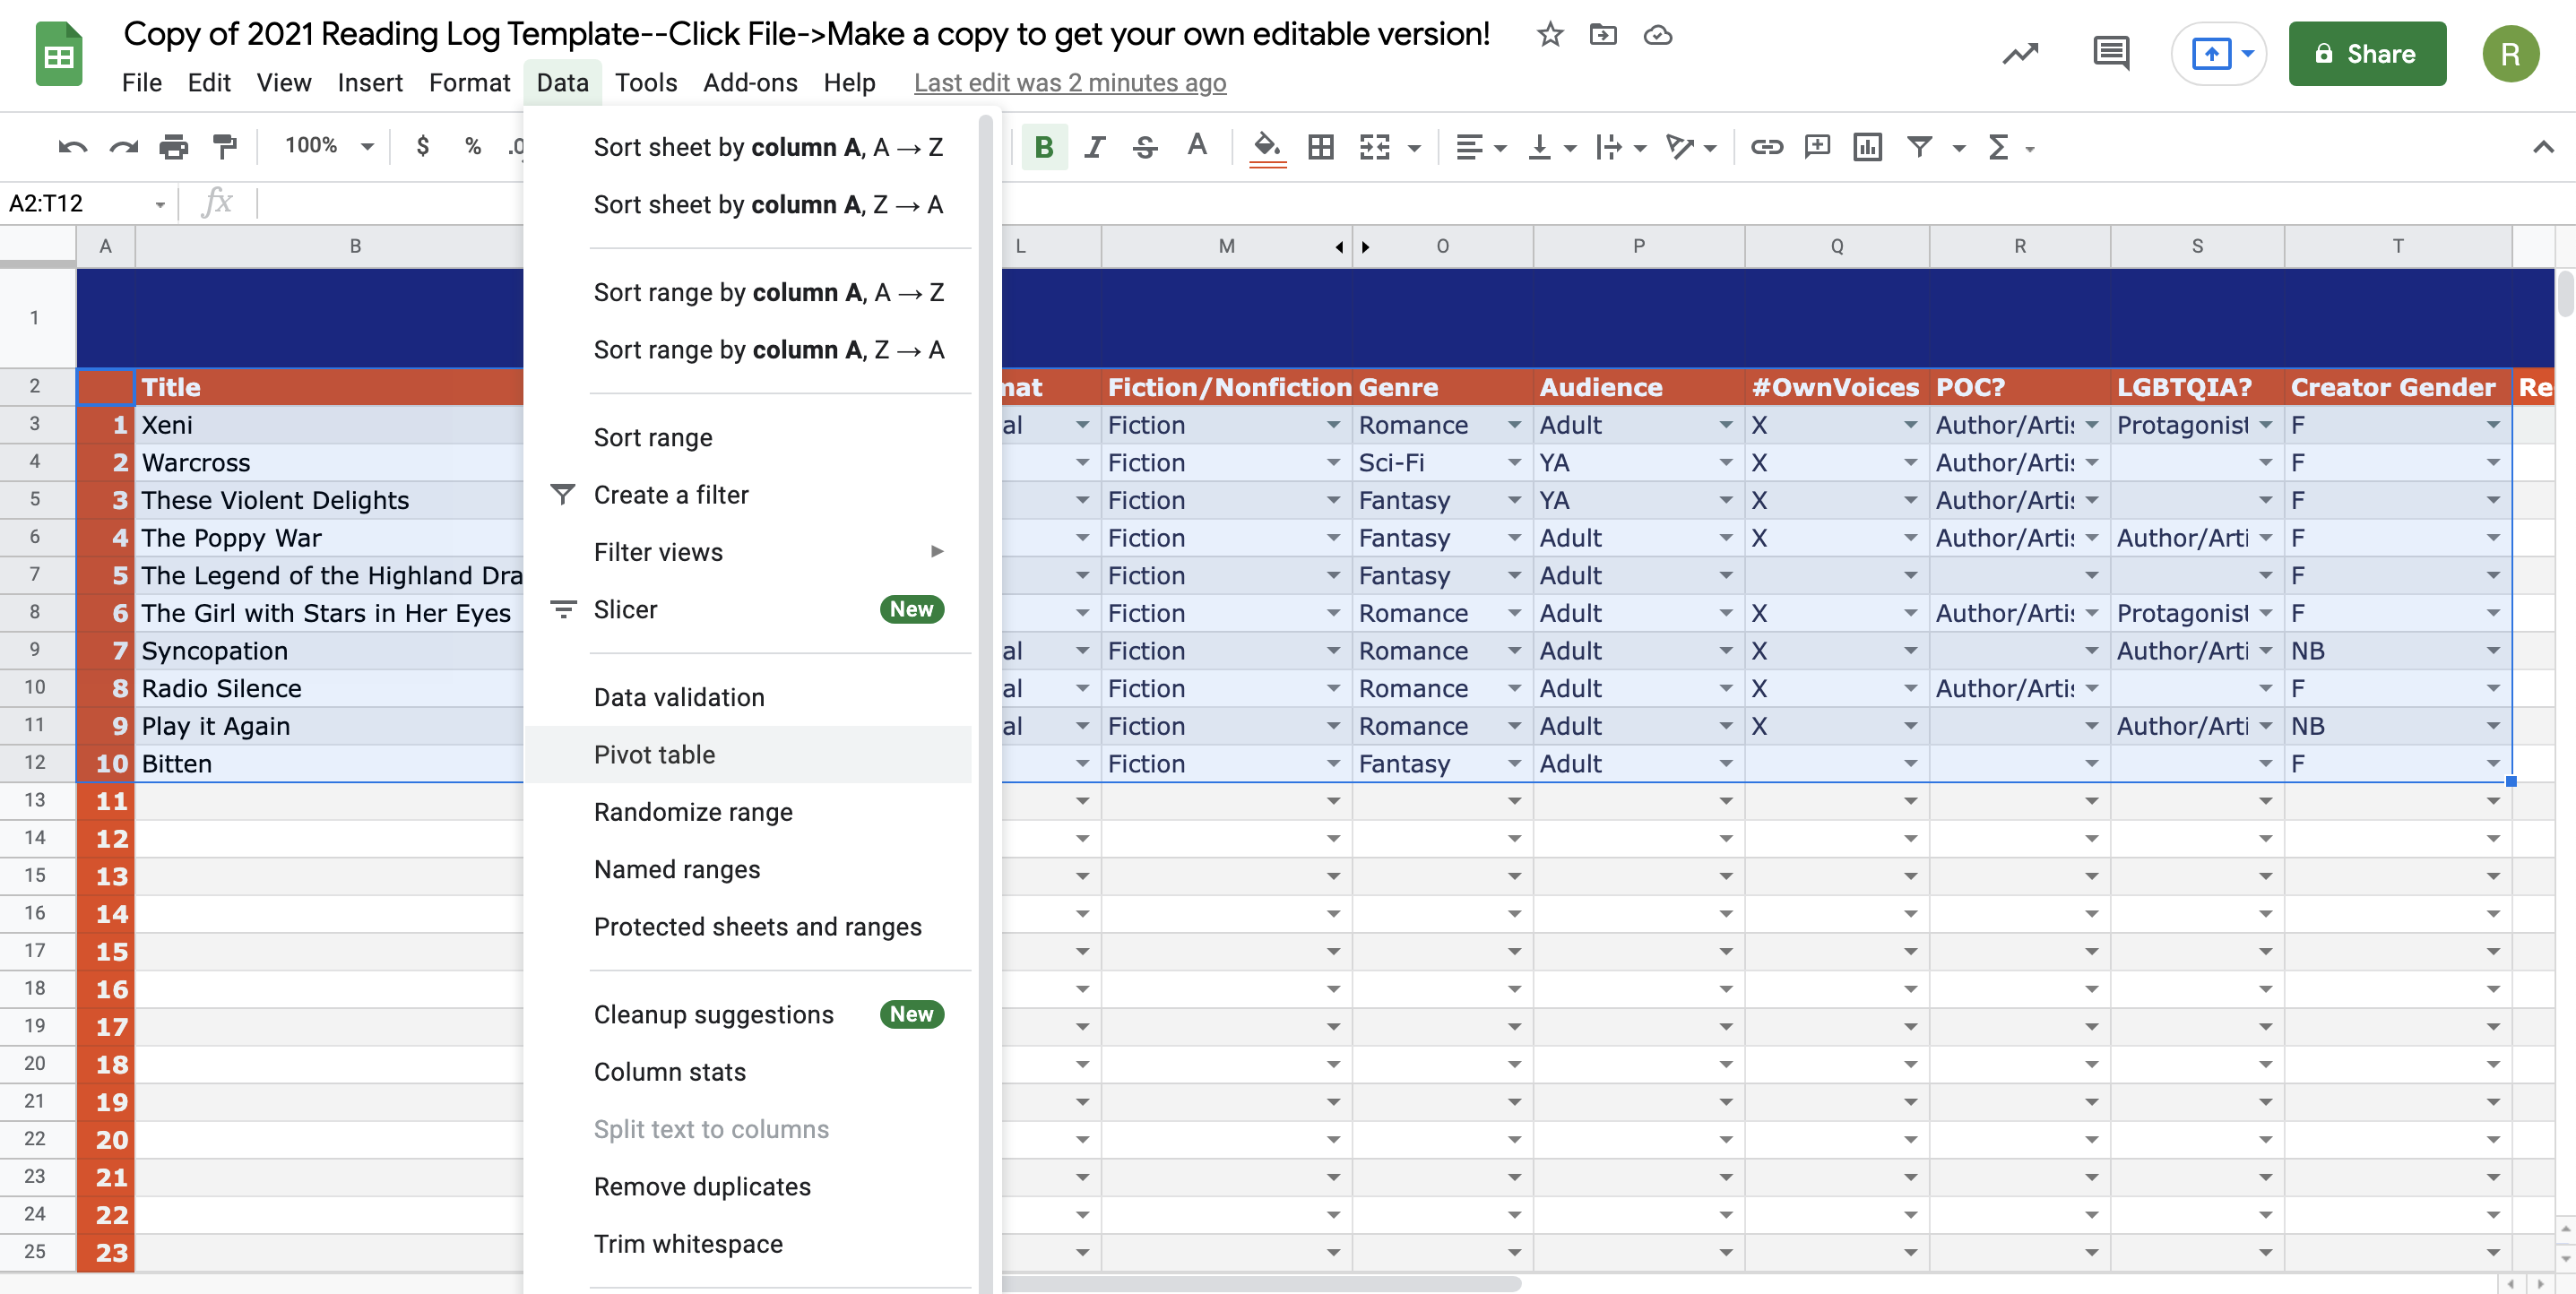
We can jump over to Google Sheets, the location where the Book Riot reading tracker originated. I have decided to hide some columns for this set of books so we can get to work. Highlight your entire table >select Data >Pivot table > New sheet >Create and you will create a new PivotTable tab.
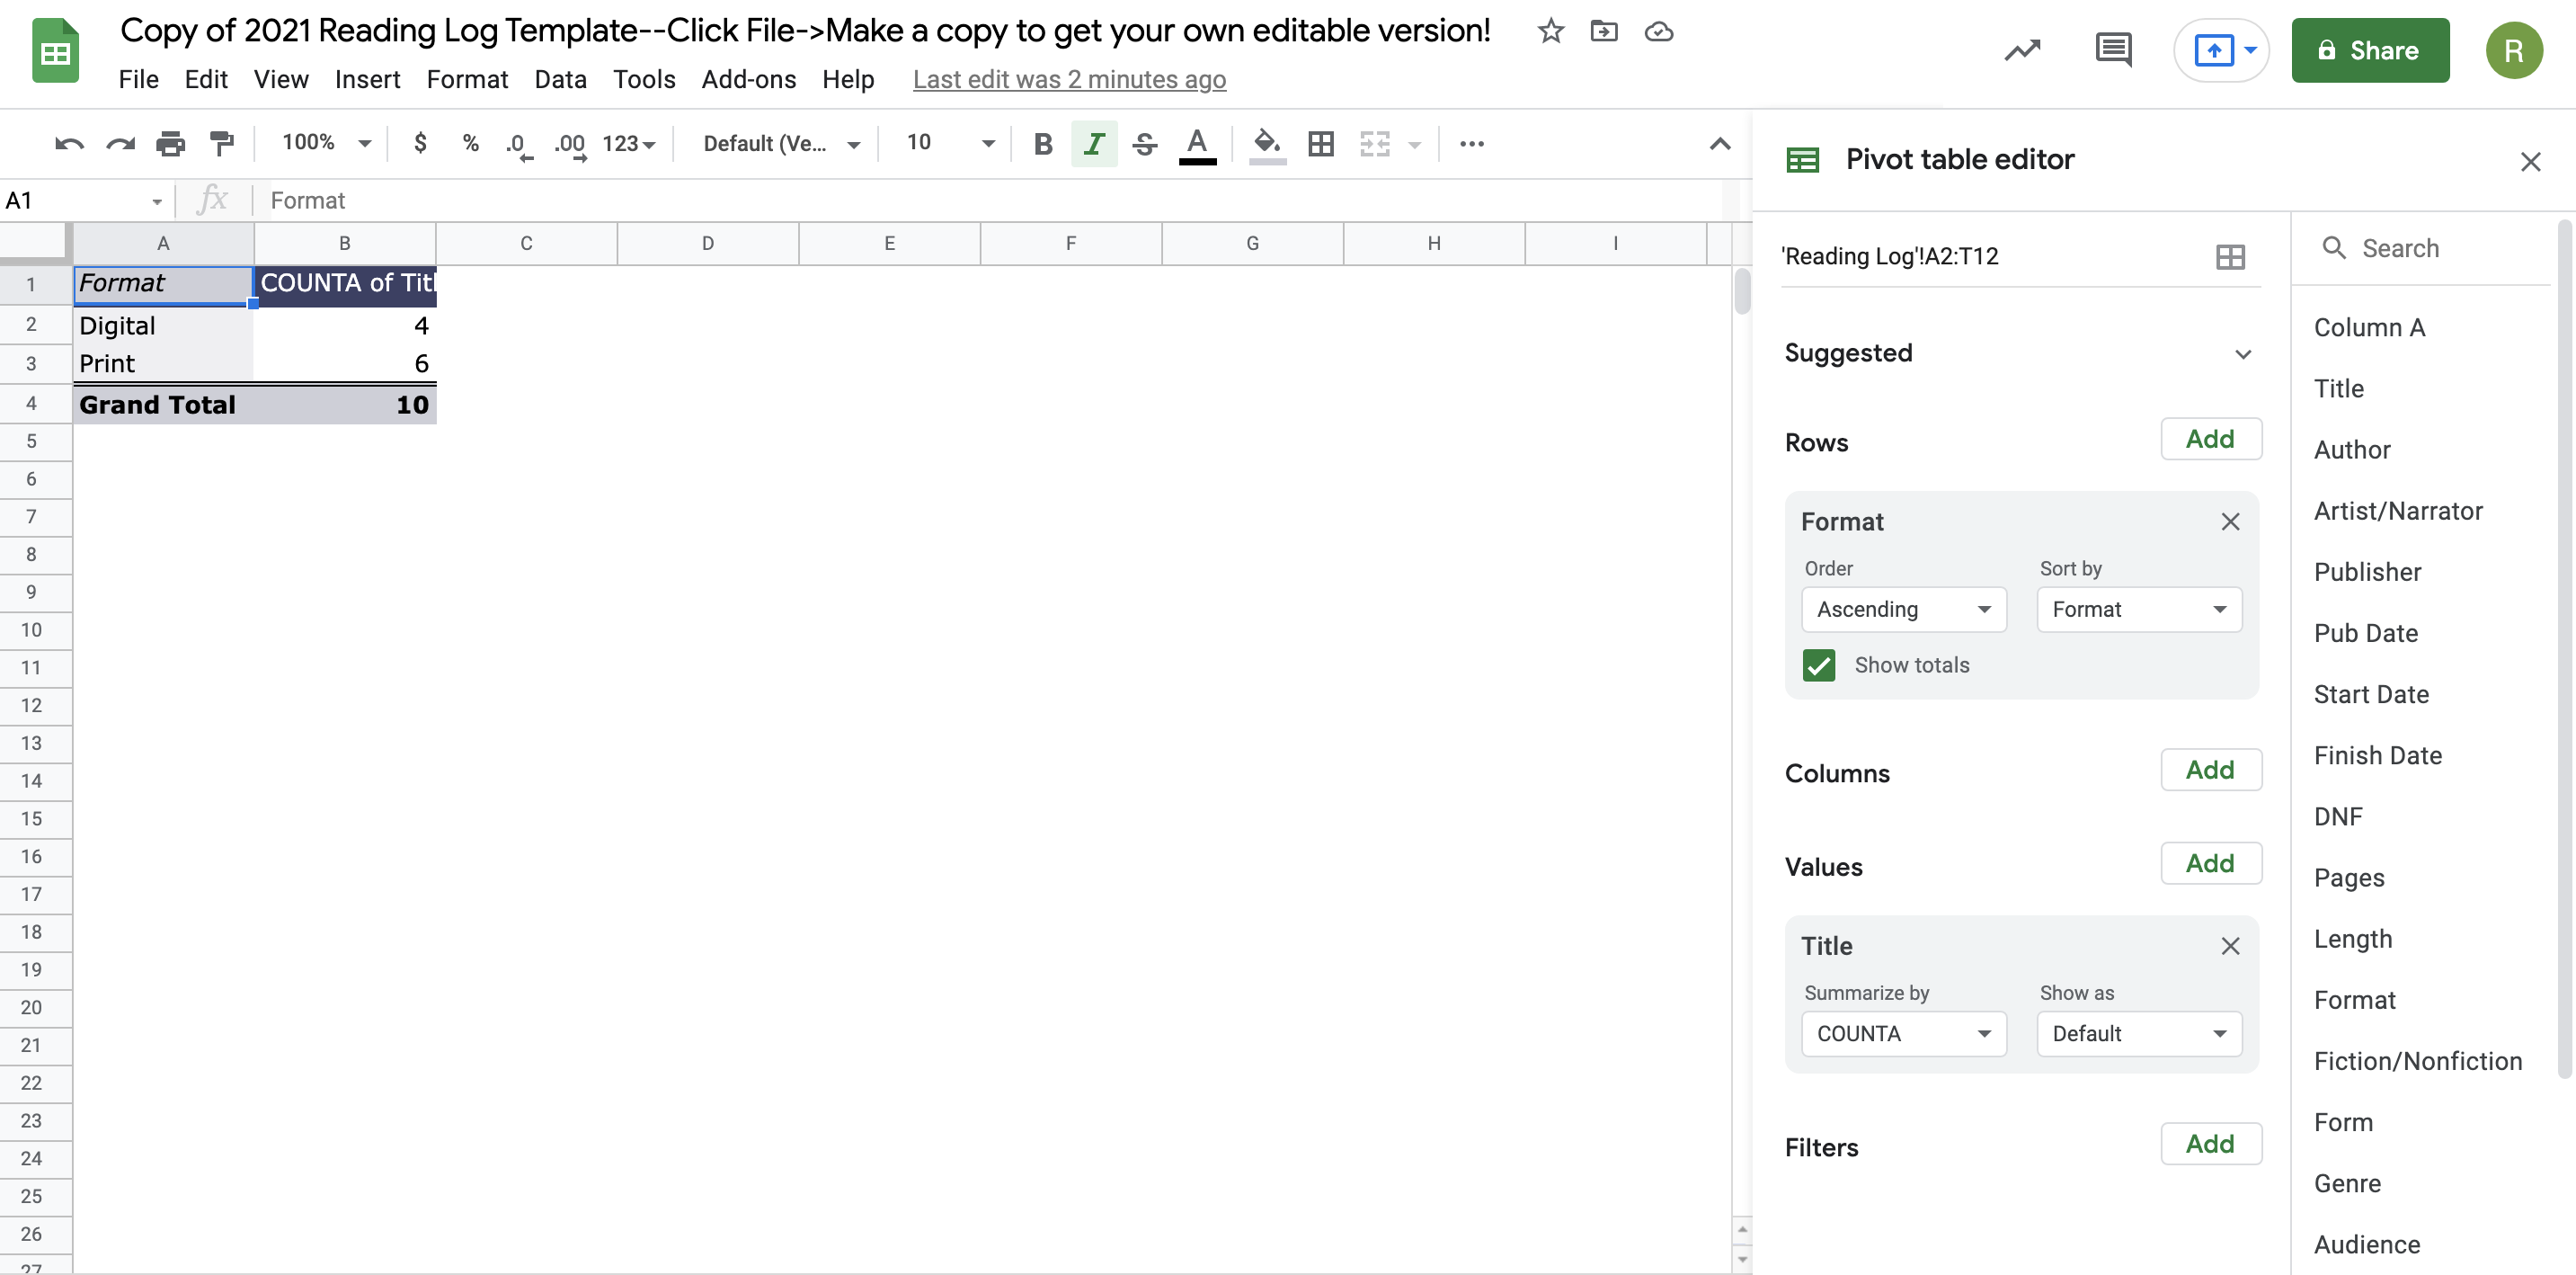
You can drag column titles to the Rows, Columns, Values, or Filters sections. We can start by dragging the “Title” to the Values section and the “Format” to the Rows section to see a breakdown of digital versus print reading. You can also select Show as >% of Grand Total to see the percentage breakdown.
If you want to add another dimension to the table, add something like “Genre” to the Columns or Filters section. In Sheets, you can also double-click any percentage total and get a new tab with those titles.
Spreadsheets and Reading Habits
Once you know what question you have about your reading habits, the PivotTable tool in Excel or Sheets can give you some fast answers. With an option to create new charts based on the intersection of different categories, it also helps you see the bigger picture behind the numbers.
PivotTables can be used as a tool to rearrange your bookshelf by subcategories if you choose to follow the tables generated from the totals. You can print your PivotTable out and put it in a journal. If you want to go crazy, you can put your yearly Reading Habits PivotTables online and share your stats with friends, book clubs, or the public. The possibilities are endless.
PivotTables are just another tool you can use for the task of tracking your reading habits. I hope this quick breakdown helps you experience the joy of reading in spreadsheet form. It will be an Excel-lent choice.