Tuesday’s stock market trading session showed mixed price action amid positive earnings reports and a 14% increase in home sales for September.
Focusing on the residential housing sector, many are looking for a top in this market as home sales have skyrocketed since the pandemic began.
Residential and Multisector Real Estate ETF (REZ) is one way to gauge the health of the housing market from a technical standpoint.
Currently, REZ is creating a head and shoulders chart pattern as seen on the daily chart and is sitting in a resistance area from the left shoulder.
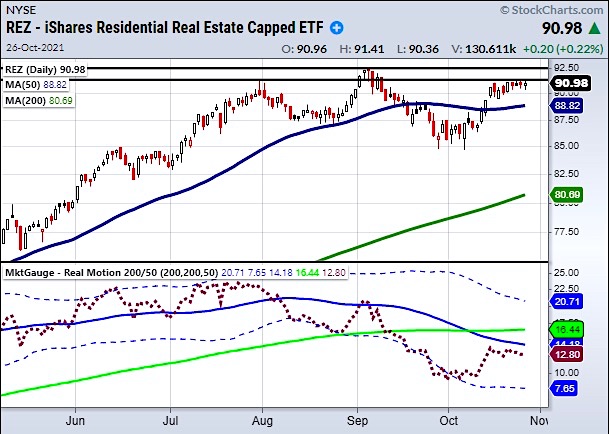
If the housing market is looking to top out, the recent highs hold key resistance to clear at $92.60. A move above $92.60 and REZ will enter price discovery making it tougher to find potential topping areas.
Besides watching key resistance levels, we can also check momentum using MarketGauges Real Motion Indicator (RM). Looking at the bottom of the chart we can see a large shift in momentum through RM.
Notice how the 50-DMA broke undeath the 200-DMA with RM (Red dotted line) sitting underneath the 50-DMA. Though the price of REZ is holding over its 50-DMA, RM is clearly showing a different story.
This gives us two ways to watch for a potential trade in REZ based on price and momentum.
First, if RM can get back over its 50-DMA it will show that momentum has improved thus creating a potential buy zone.
On the other hand, if the price breaks underneath its 50-DMA at $88.82 it will show that the price now agrees with the current weakening momentum.
Stock Market ETFs Trading Analysis:
S&P 500 (SPY) 454.05 needs to hold as price support.
Russell 2000 (IWM) needs to clear and hold over 229.84.
Dow Jones Industrials (DIA) needs to hold 356.60 as new support.
Nasdaq (QQQ) 382.78 is the high to clear.
KRE (Regional Banks) 71.60 is key price support area.
SMH (Semiconductors) 264.75 is the 50-day moving average.
IYT (Transportation) is sitting in a price resistance area.
IBB (Biotechnology) 160.30 is the 200-day moving average that could not hold.
XRT (Retail) … Watching to hold over the 50-day moving average at 93.53.
Twitter: @marketminute
The author may have a position in mentioned securities at the time of publication. Any opinions expressed herein are solely those of the author and do not represent the views or opinions of any other person or entity.


