


The following post was written and/or published as a collaboration between Benzinga’s in-house sponsored content team and a financial partner of Benzinga.
EUR/USD Current price: 1.1624
- Mixed US data fueled the ruling dismal market’s mood, the dollar edged higher.
- US Treasury yields reached fresh multi-month highs, 10-y note yield nearing 1.70%.
- EUR/USD approaches a Fibonacci support, may soon retest the year low.

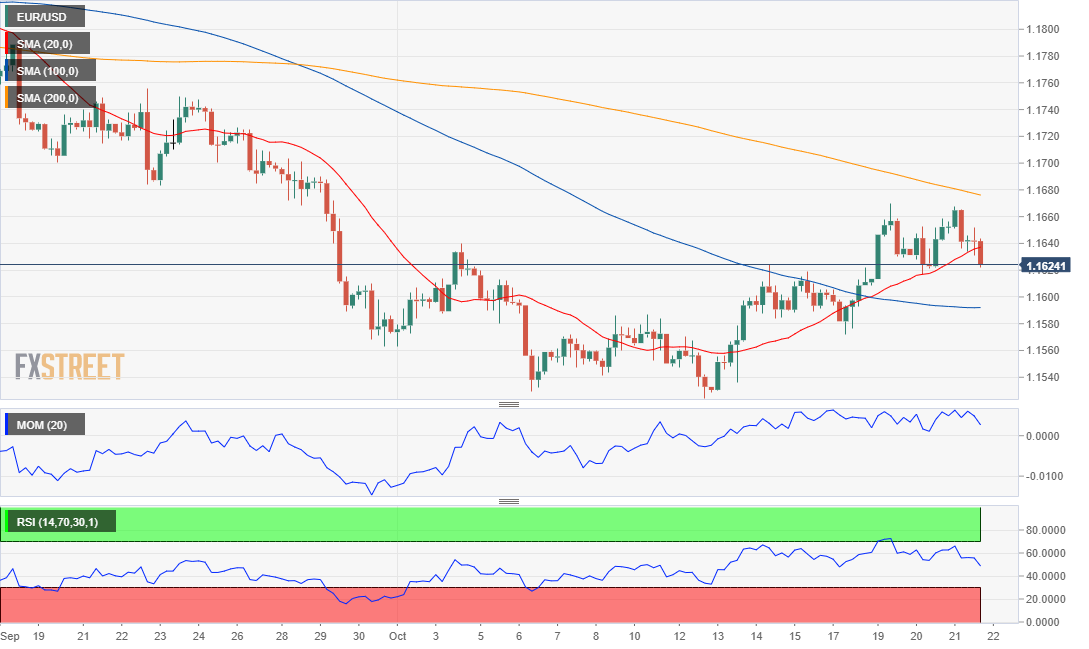
The EUR/USD pair traded as high as 1.1666 but was unable to break above the weekly high and retreated to settle in the 1.1620 price zone, ending the day with modest losses. The American dollar keeps seesawing between gains and losses, finding late support on higher US government bond yields and a downbeat market’s mood. Concerns about mounting inflationary pressures are back in the spotlight alongside supply chain bottlenecks.
Stocks edged lower, with Wall Street weighed by the sour tone of its overseas counterparts, although holding near record highs. Still, the yield on the 10-year US Treasury note reached a fresh multi-month high of 1.682%, settling not far below the level.
US data was mixed, as the country published Initial Jobless Claims for the week ended October 15, which resulted in 290K, improving from 296K in the previous week and beating expectations. The October Philadelphia Fed Survey came in at 23.8, missing the expected 25 and contracting from 30.7 in September. Finally, September Existing Home Sales were up 7% MoM improving from -2% in August. As for the EU, it released the preliminary estimate of October Consumer Confidence, which resulted at -4.8, better than the -5 expected but worse than the previous -4.
Markit will publish on Friday the preliminary estimate of its October PMIs. Manufacturing activity is expected to have contracted in the EU but to remain within expansionary levels, while services output is also expected to have decelerated at the beginning of the third quarter. On the other hand, US figures are expected to show a persistent economic recovery.
EUR/USD short-term technical outlook
The daily chart for the EUR/USD pair suggests that bears may soon be in charge of it, as technical indicators turned south, currently within neutral levels, while moving averages maintain their firmly bearish slopes, despite the 20 SMA stands below the current level.
In the near term, and according to the 4-hour chart, the bearish case is also firming up. The current candle is actually developing below a bullish 20 SMA, which used to provide dynamic support, while technical indicators have crossed their midlines into negative ground. The immediate support is the 23.6% retracement of the 1.1908/1.1523 slide at 1.1615. Bears will have chances as long as they keep defending the 1.1670 price zone.
Support levels: 1.1615 1.1570 1.1525
Resistance levels: 1.1670 1.1715 1.1750
Image Sourced from Pixabay
The preceding post was written and/or published as a collaboration between Benzinga’s in-house sponsored content team and a financial partner of Benzinga. Although the piece is not and should not be construed as editorial content, the sponsored content team works to ensure that any and all information contained within is true and accurate to the best of their knowledge and research. This content is for informational purposes only and not intended to be investing advice.
© 2024 Benzinga.com. Benzinga does not provide investment advice. All rights reserved.
Trade confidently with insights and alerts from analyst ratings, free reports and breaking news that affects the stocks you care about.

