Record levels of renewable energy drove down electricity prices across Australia in the September quarter, with prices zero or negative for one-sixth of the time, the Australian Energy Market Operator has said in its latest report.
There was also little sign of the Morrison government’s much-touted “gas-led recovery”, with a supply disruption at Victoria’s Longford gas plant initially leading to record or near-record spot prices for the fossil fuel in Adelaide, Sydney and Melbourne. Gas’s share of the power mix also slumped one-fifth from a year earlier for the quarter as a whole.
By August the arrival of milder weather and ongoing weak electricity demand caused by Covid-related lockdowns in Victoria and New South Wales sent gas and electricity prices plunging, Aemo said.
For the quarter, electricity from wind, solar and hydro plants supplied almost a third of demand in the national electricity market, at a record 31.7%. For one 30-minute period on 24 September, renewables met 61.4% of demand – also a fresh high.
The share of black coal in the electricity mix fell below half for the first time for a September quarter, while the share of gas also retreated from a year earlier.
The electricity industry has been decarbonising much faster than other parts of the economy. While still contributing about one-third of Australia’s carbon emissions, the power sector has been the main reason Australia’s Paris agreement climate pledge to cut 2005-level emissions by 26% to 28% for 2030 is likely to be exceeded.
Aemo’s chief markets officer, Violette Mouchaileh, said power prices in the mainland section of the national electricity market – serving about three-quarters of Australia’s population – averaged $111 a megawatt hour in July before sinking to an average $37MWh by September.
“This trend of falling prices through the quarter was in sharp contrast to international energy prices for LNG and coal which continued to rise throughout the quarter reaching record levels,” she said.
The spread of solar panels on rooftops and the addition of new solar and windfarms to the grid meant spot power prices were often zero during the middle of the day, and regularly lurched into negative territory.

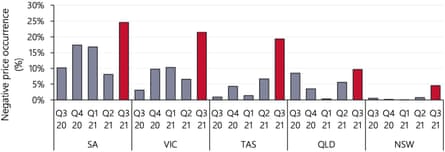
Prices were zero or negative for 16% of all trading intervals during the quarter, more than double the previous share set during the final three months of 2020 at 7%.
“Notably, the occurrence of negative spot prices this quarter was up across the NEM, with records set in all regions including New South Wales where negative prices were previously rare,” Aemo said in its accompanying report.
Spring in southern Australia can be stormy, resulting in increased output from windfarms. New wind turbine capacity helped increase the periods of very high renewables output in Victoria, South Australia and Tasmania. As a result, stints of negative prices increased overnight for those three states in particular.
In Victoria, average spot prices between 10am and 3.30pm fell from an average of $30 a MWh in 2020 to just 1c a MWh during August and September, Aemo said. SA reached average negative prices during that time slot in the March quarter of this year, the first time such an outcome has been seen in the market’s history for one region.

Increased rooftop solar use also meant consumers reduced the need to access the grid for power.
“The continued growth in distributed PV pushed minimum operational demand levels to record lows,” Mouchaileh said. “In NSW, minimum demand from the grid fell to 4,872MW, the lowest level since [the first quarter of] 2000, while South Australia’s minimum demand record fell by 21% to 236MW.”
The abundance of renewable energy also meant that at times the grid could not take all the power being generated.
Curtailment of grid-scale wind and solar power reached new highs during the quarter, tripling from 118MW in the June quarter to 351MW in the September quarter.
The story was similar in Western Australia, which operates on a separate grid from the eastern states.
Renewable energy provided a record share of demand during the quarter, including a new high of 70% during one interval on 7 September, Aemo said.
Total WA domestic gas consumption was also down about 5% from a year earlier to 95.3 petajoules.
