Analysis
Shiba Inu, Tron, Uniswap Price Analysis: 20 October
While Bitcoin hits the $63,000 mark, altcoins like SHIB and UNI show bearish signs. However, TRX seemed to follow in the footsteps of the King coin and showing some signs of recovery on the charts. Nevertheless, all of these coins show weak directional price trends in the near term.
SHIB
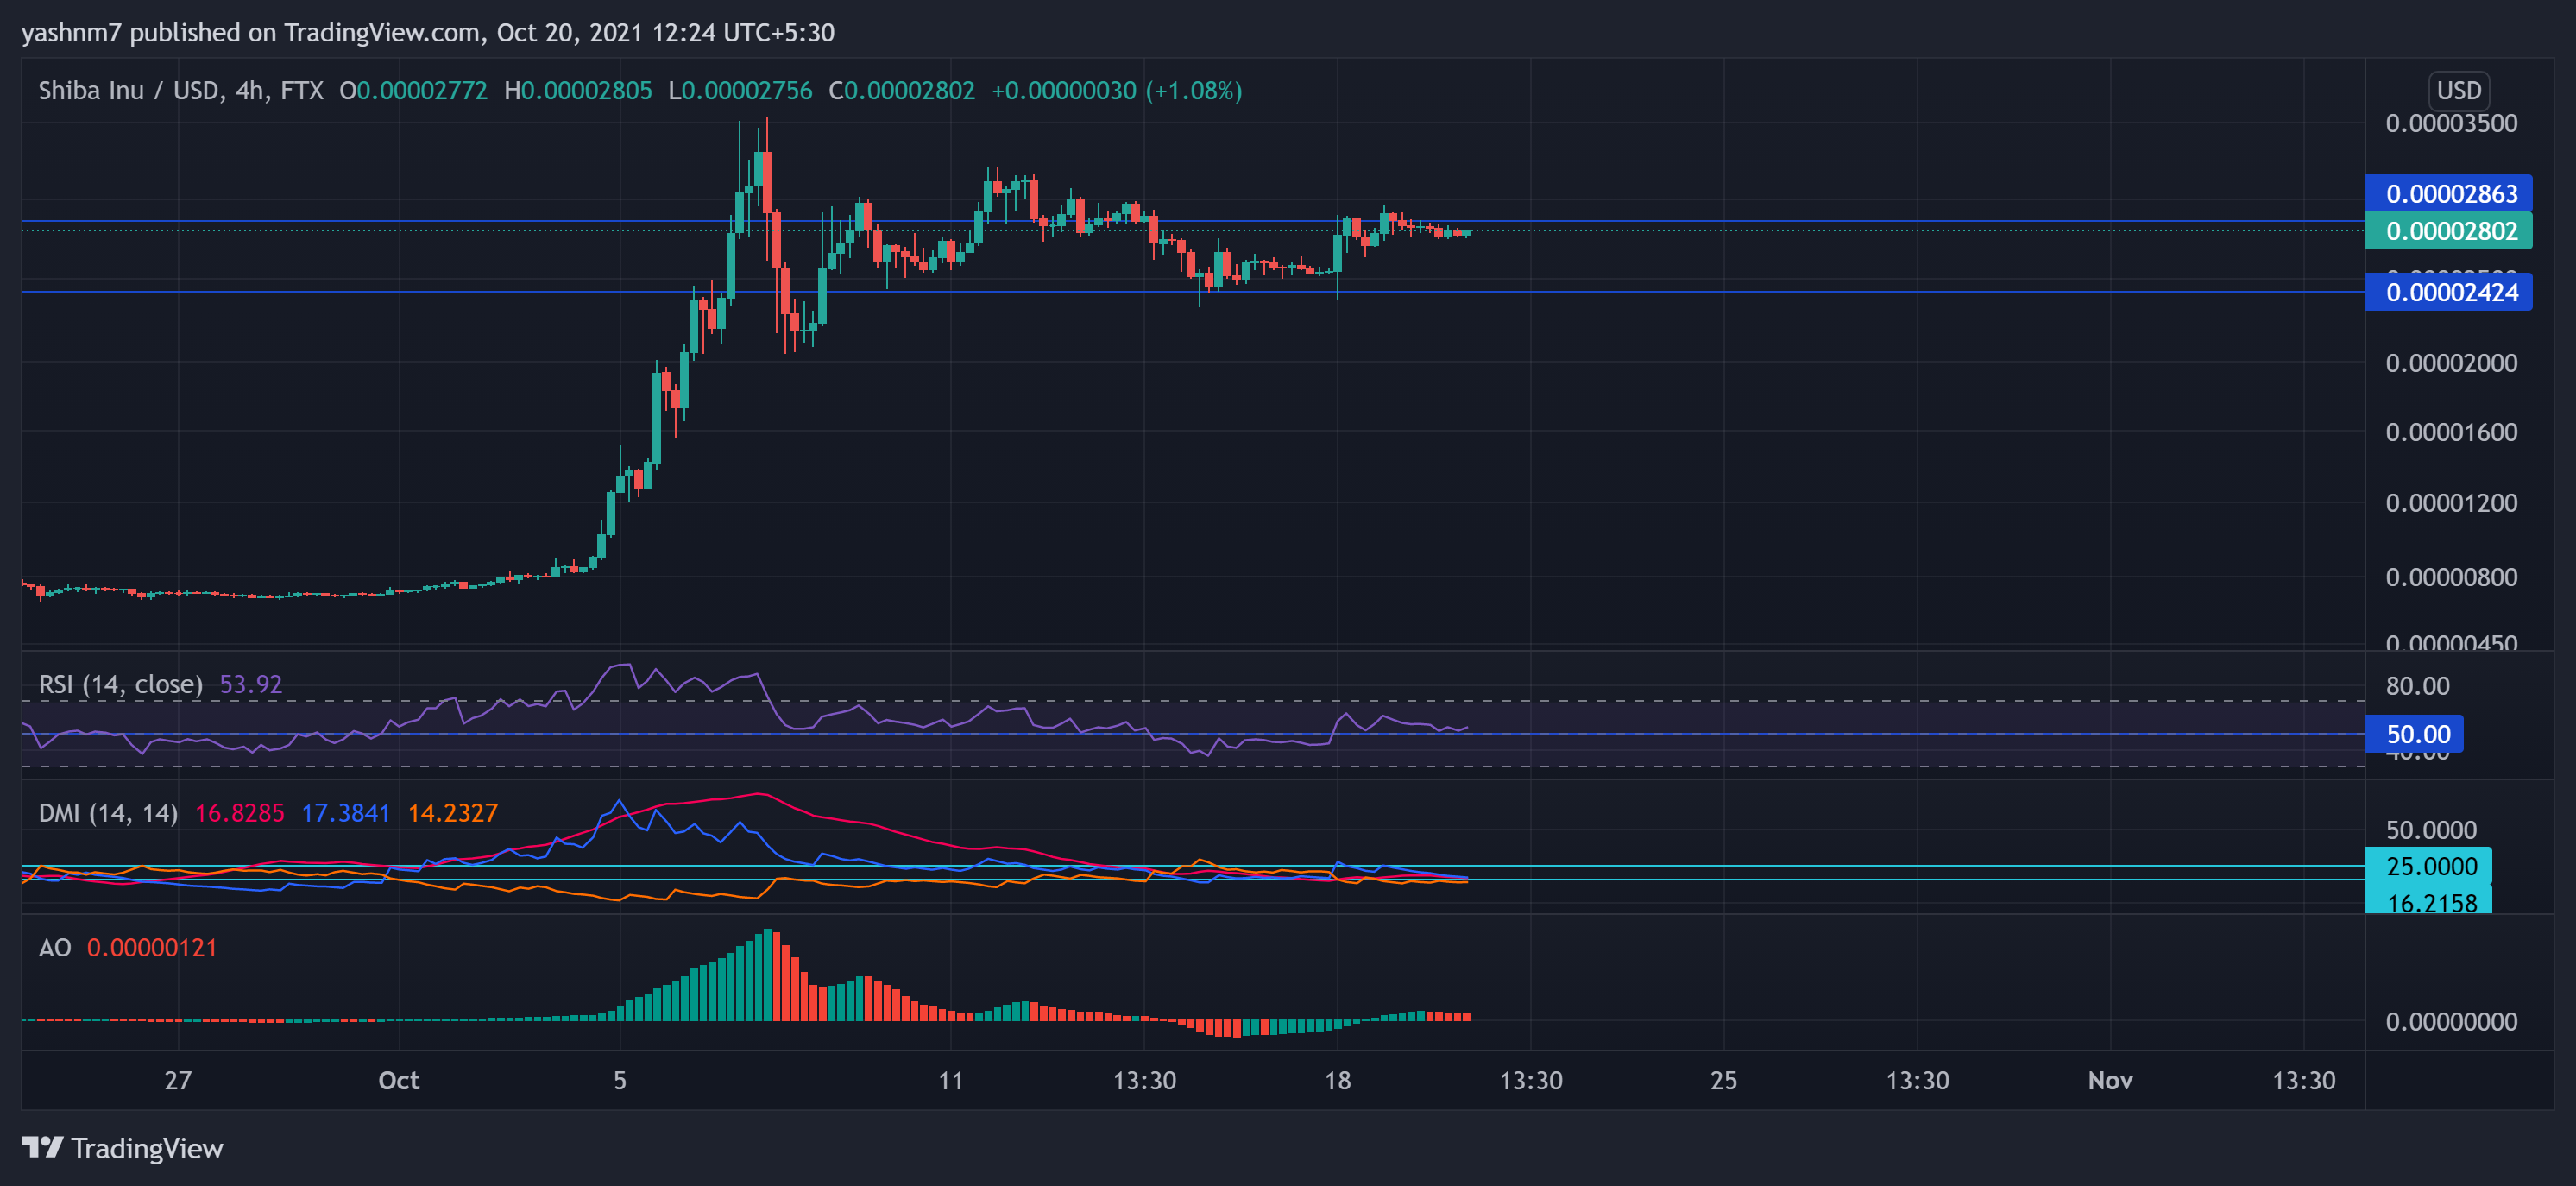
TradingView, SHIB/USD
SHIB saw a 2.26% decrease over the last week and was trading at $0.00002802, showing possible signs of continued consolidation in the near term. The immediate resistance and support levels stood at $0.00002863 and $0.00002424, respectively. The 20-SMA level (not shown) was adjacent to the current trading price, suggesting that neither the bulls nor the bears depicted strong momentum.
The RSI stood at the 53-mark after assuming a downward trajectory over the past few days. This reading demonstrated the short-term decreasing buying power. The Awesome Oscillator showed bearish tendencies by flashing red signal bars. The +DI Line (blue) marked a sharp decline below the 25-mark by converging with the ADX line (red). This confirmed the decreasing buying strength. However, the ADX line stood at 16.2158, suggesting a very weak price action trend.
TRX
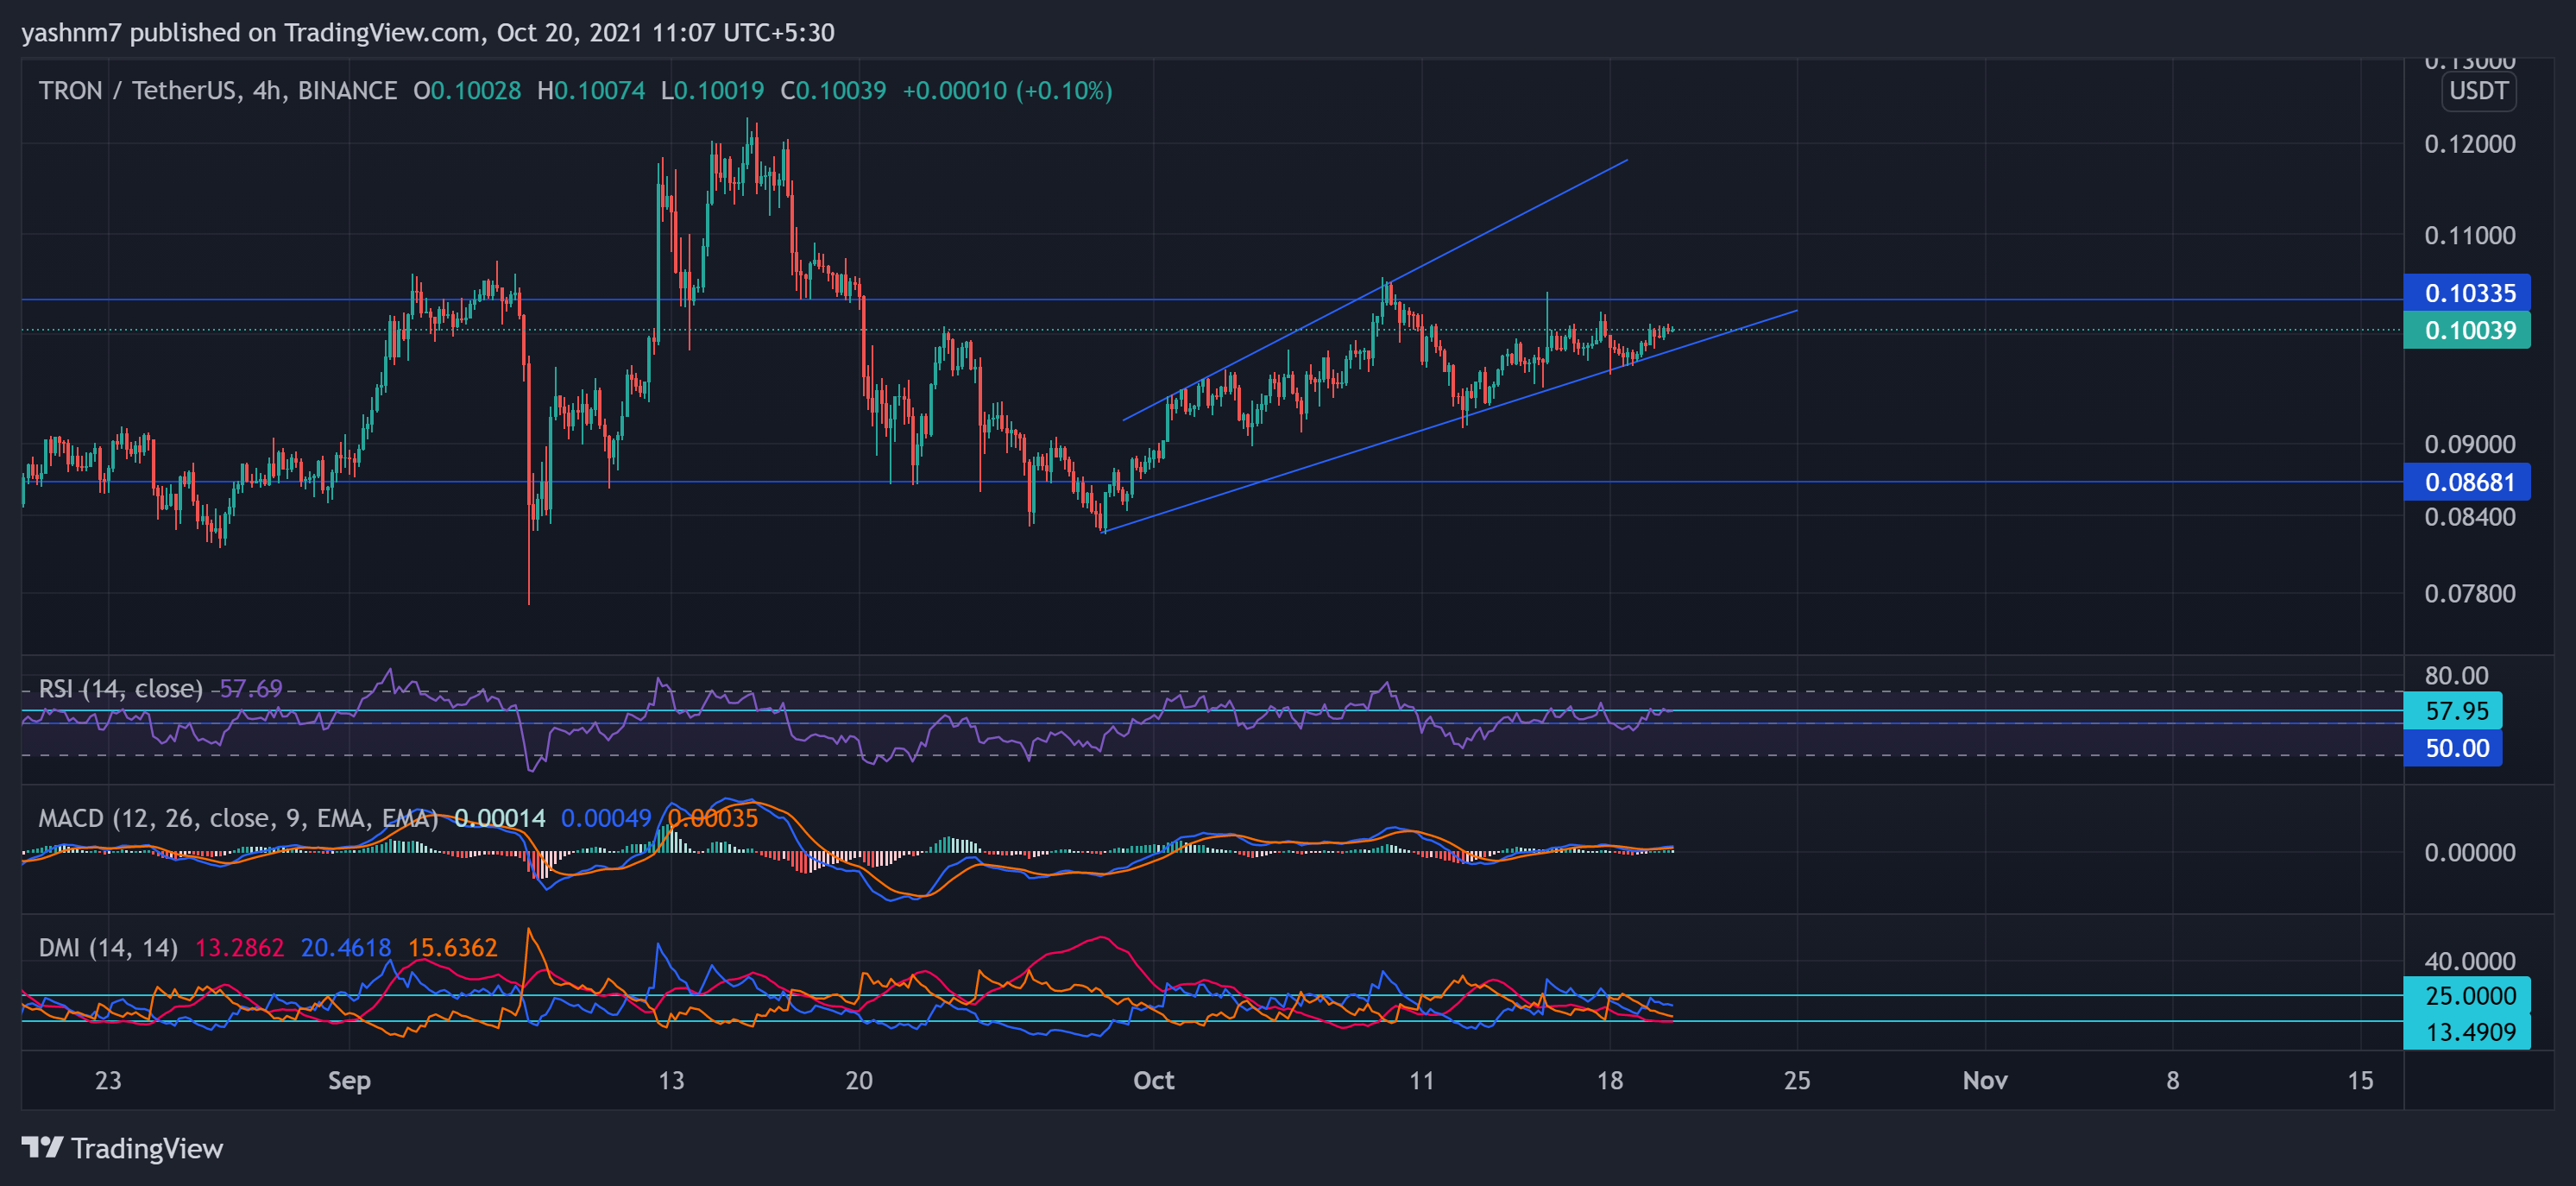
TradingView, TRX/USDT
Tron stood at $0.100 after noting a gain of nearly 1.28% over the last 24 hours and 4.44% over the week. The price seemed to be marching towards its immediate resistance level that stood at $0.103, demonstrating the increased buying strength in the market, while the support level stood at $0.087. The current trading price stood above its 20-SMA (not shown), affirming the price momentum in favor of buyers.
The RSI witnessed a recent surge and stood at 57.95, suggesting a preference for the buyer’s market. MACD Line (blue) was just above the Signal line (orange) post-convergence, hinting at bullish price tendencies, confirmed by the green bars on its histogram. However, the Average Directional Index of the Directional Movement Index stood at 13.49, depicting a substantially weak directional trend.
UNI

TradingView, UNI/USDT
UNI recorded a 1.05% decrease over the last day and was trading at $25.67. The immediate resistance stood at $27.11, while the support stood at $20.28. The salient technical indicators pointed at bearish tendencies in the near term.
The RSI was below the 50 mark after marking a substantial plunge from above the middle line. This reading suggested higher selling pressures. The Awesome oscillator was in agreement and reiterated the selling strength by flashing red signal bars. As the +DI Line (orange) surged towards the 25-mark, the bears seem to take control in the near term.