


The following post was written and/or published as a collaboration between Benzinga’s in-house sponsored content team and a financial partner of Benzinga.
AUD/USD Current Price: 0.7418
- Poor Chinese data sent investors into the greenback at the beginning of the day.
- The Reserve Bank of Australia will publish the Minutes of its October meeting.
- AUD/USD is neutral-to-bullish in the near term, needs to break above 0.7440.

The AUD/USD pair is unchanged at around 0.7415 for a second consecutive day, recovering from an intraday low of 0.7378. Poor Chinese macroeconomic figures sent the pair lower at the beginning of the day, as the greenback benefited from a dismal market mood. The American dollar shed ground during US trading hours as stocks recovered while government bond yields retreated.
China published its Q3 Gross Domestic Product, which resulted at 0.2% down from the previous 1.3%, while the annualized reading resulted at 4.9% declining from 7.9% in Q2. The country also reported softer than anticipated Industrial Production figures for September, up 3.1% YoY, although Retail Sales were upbeat as per surging 4.4% in the same period.
The Reserve Bank of Australia will release the Minutes of its latest meeting on Tuesday, although little could be expected from them. The October meeting was pretty much the same as the September one, without any change to the current policy or its future perspectives.
AUD/USD short-term technical outlook
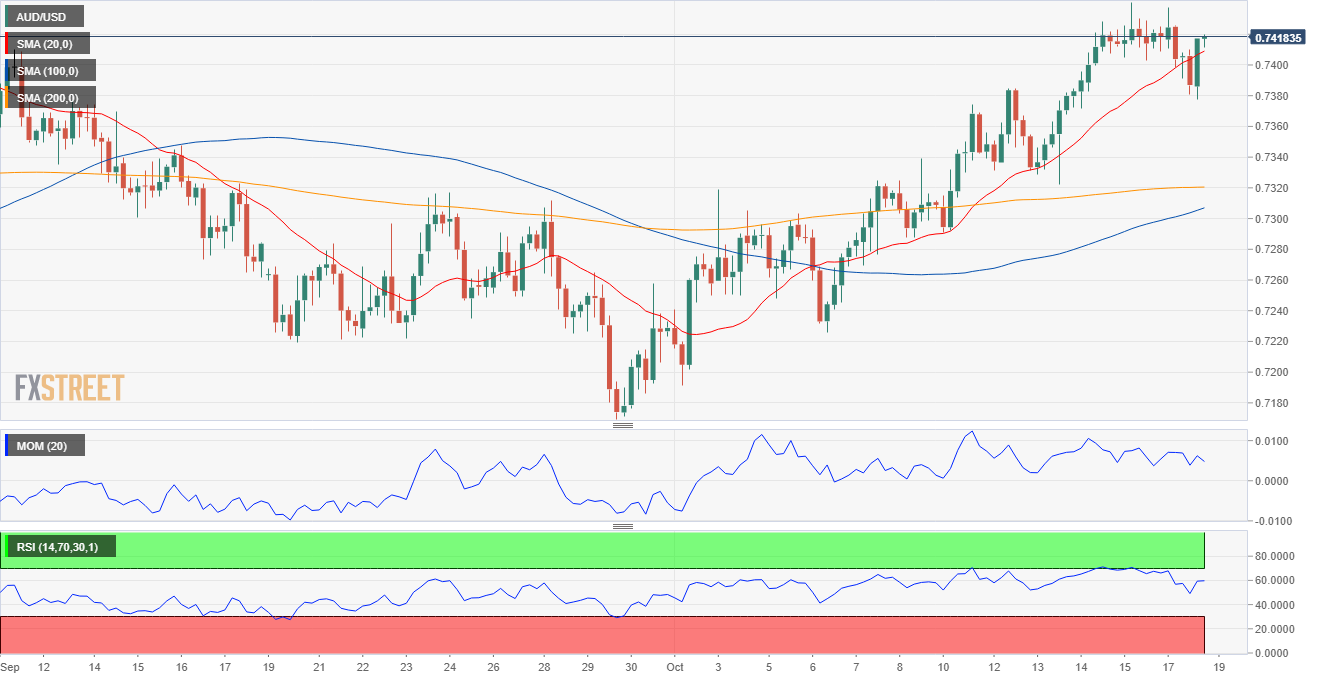
The AUD/USD pair retains its bullish stance in the daily chart, although it is unable to advance beyond a bearish 100 SMA, currently hovering around it. Nevertheless, the 20 SMA is gaining bullish traction well below the current level, while technical indicators remain near overbought readings, the Momentum heading higher at fresh one-month highs.
The 4-hour chart offers a neutral-to-bullish stance, as the pair is developing above all of its moving averages, with the 20 SMA heading firmly higher above the longer ones. At the same time, technical indicators have lost directional strength, the Momentum around its midline and the RSI at around 60. The next relevant resistance level is 0.7440, with bulls likely to add longs once the pair breaks above it.
Support levels: 0.7365 0.7330 0.7290
Resistance levels: 0.7440 0.7475 0.7510
Image Sourced from Pixabay
The preceding post was written and/or published as a collaboration between Benzinga’s in-house sponsored content team and a financial partner of Benzinga. Although the piece is not and should not be construed as editorial content, the sponsored content team works to ensure that any and all information contained within is true and accurate to the best of their knowledge and research. This content is for informational purposes only and not intended to be investing advice.
© 2024 Benzinga.com. Benzinga does not provide investment advice. All rights reserved.
Trade confidently with insights and alerts from analyst ratings, free reports and breaking news that affects the stocks you care about.

