Analysis
Litecoin: How traders can capitalize on this ‘ideal’ buy entry
Disclaimer: The findings of the following analysis are the sole opinions of the writer and should not be taken as investment advice
Litecoin’s near-term outlook seemed favorable as the alt closed in on an ascending triangle breakout. A northbound RSI, bullish crossover on the Directional Movement Index, and an uptick in 24-hour trading volumes backed such predictions.
However, some near-term bearishness would begin to seep if LTC fails to close above the upper trendline. Sellers would need to target a close below $166.2 in order to negate a bullish outcome and enforce a breakout in the opposite direction.
Litecoin 4-hour Chart
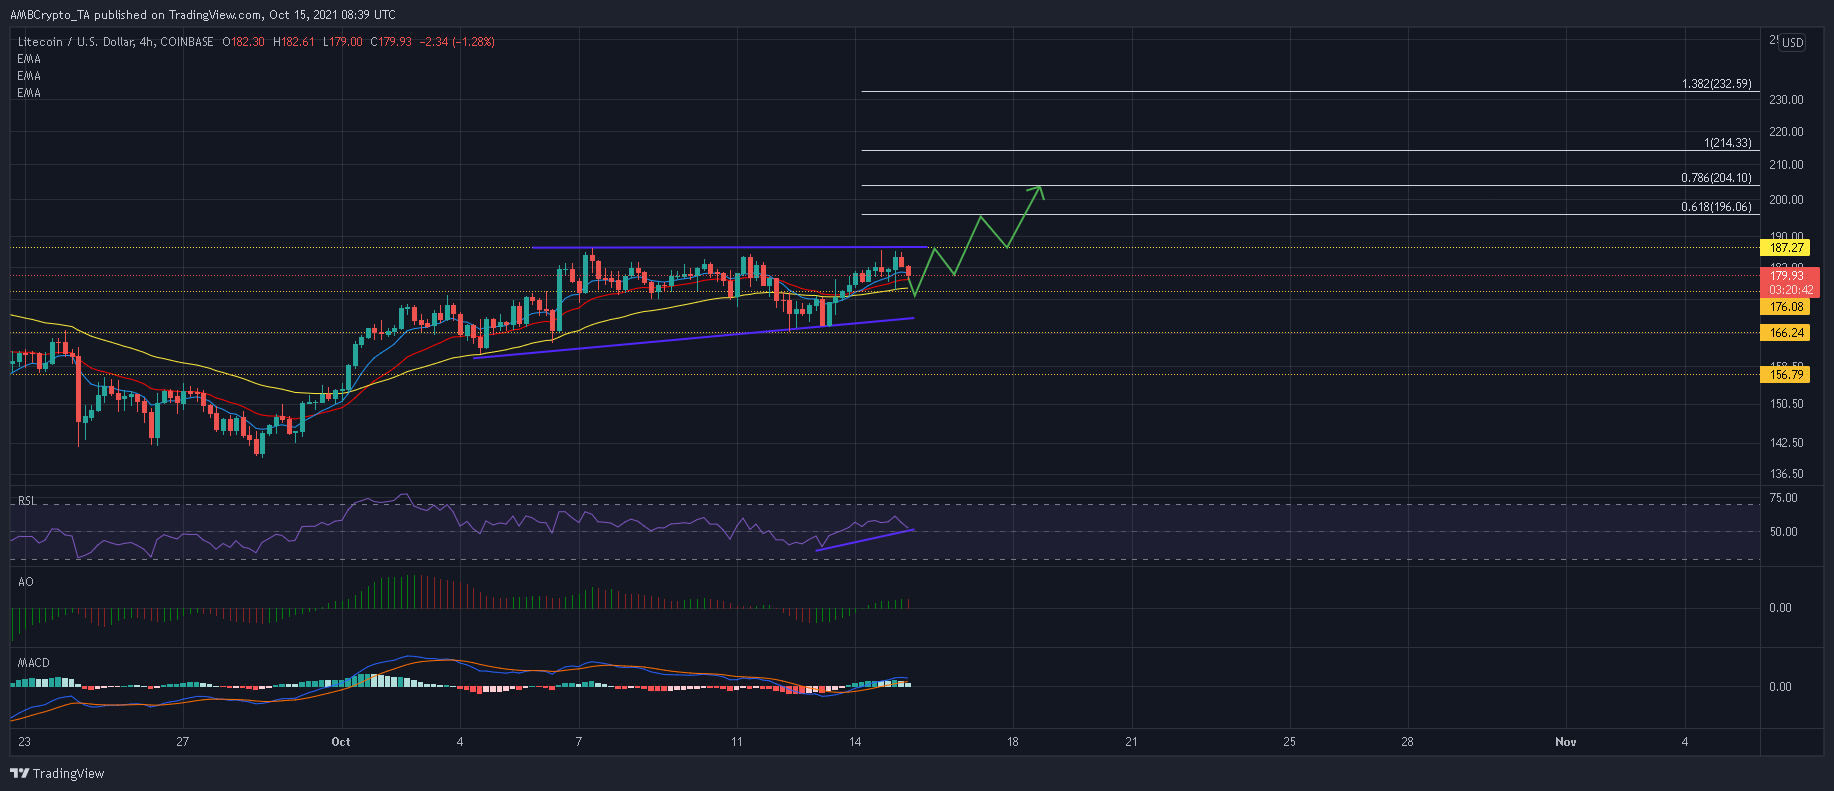
Source: LTC/USD, TradingView
A series of higher lows since 4 October along with steady highs around $187 were used to chart an ascending triangle setup for LTC. The pattern sets up the precedence for an upwards breakout as selling pressure gradually diminishes and the alt tackles the upper trendline. Now, the formation of two red candles presented an ideal buy entry at the 50-EMA (yellow).
The assumption was that LTC would rebound from this moving average line and formulate another assault at $187.27. A close above this ceiling can allow bulls to march on forward to the immediate 61.8% and 78.6% Fibonacci Extension levels. LTC could also tag its 100% Extension above $210 in case bulls are able to add to the rising 24-hour trading volumes.
Now, if LTC closes below the confluence of the 50-EMA and the $176-support, a newer low can be anticipated around $170.
On the other hand, LTC would lose its bullish thesis if bears slice below $166.24. Following a breakdown from the pattern, support levels of $157 and $153 would come under the spotlight.
Reasoning
For now, fears of a breakdown seem to be uncalled for as per the RSI and DMI. Even though the RSI noted a slight downtick, it still traded above the mid-line. The Directional Movement Index’s bullish crossover is also expected to dissuade any near-term bearish positions.
Having said that, an early breakout seems unlikely as well. This argument can be supported by a weakening MACD which highlighted receding bullish momentum.
Conclusion
Litecoin can be expected to form a newer low around $176 before challenging the upper trendline once again. Such a move would also present an ideal buy entry for traders willing to long the ascending triangle.
Stop-losses can be set slightly below the $170-mark. Once a breakout does occur, traders can exit their positions at the 61.8% or 78.6% Fibonacci Extension levels after gauging the 24-hour trading volumes.