The stock market advance over the past year has truly turned a lot of heads, in a good way.
After the initial bear market and bounce triggered by the Covid-19 pandemic and monetary/fiscal response, global equities went on a phenomenal run.
The vaccine rollout driving the re-opening trend in the economy helped, as did the continued emergency financial support policies. And what a run. During this advance, consumer spending pivoted more to durables such as vehicles, homes and technology. While nominal GDP doesn’t care as much where an individual decides to spend their money, the equity markets much prefer you buy some durables, instead of services (like a dinner).
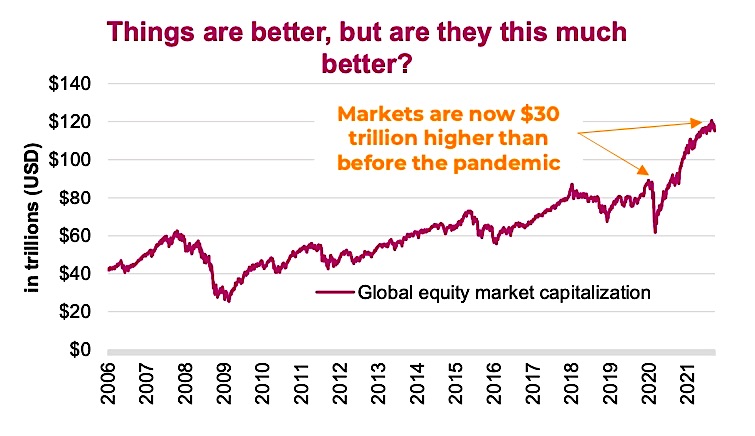
All this good market news has lifted the global market capitalization of equities to about $120 trillion—a full $30 trillion higher than before the pandemic hit. This is incredible, as it sure doesn’t feel like the world is 33% better off than before the pandemic. In fact, it took a decade to add $30 trillion to the global market cap from the peak before the global financial crisis. The latest $30 trillion took a year and a half.
It is not just the spending habits that changed. Given the market performance and high savings rates (since many are not spending as much on services), markets have enjoyed solid inflows over the past year. That super-charged savings rate isn’t just being tucked away in bank accounts.
With temporarily changed behaviours combined with monetary/fiscal policy, this may have dragged forward future performance. Or, in other words, some of these abnormally high returns may mean revert, leading to more muted returns ahead. To demonstrate how far outside the norm some markets have moved, let’s look at a few different perspectives.
There is no denying the economy and the market, while related, can behave very differently at times. Equities can go up or down while the economy remains stable. Sometimes, the economy accelerates and the market retreats. Variances in the direction of the markets and the economy led to the often-used phrase: “the market is not the economy”. While that may seem like the case at times, there is a strong relationship between the two.
The economy drives corporate earnings and if there were a constant valuation multiple placed on earnings, the relationship between the economy and the market would be clearer. But once investor sentiment gets in there, sometimes paying more for a dollar of earnings, sometimes less, the waters are muddied.
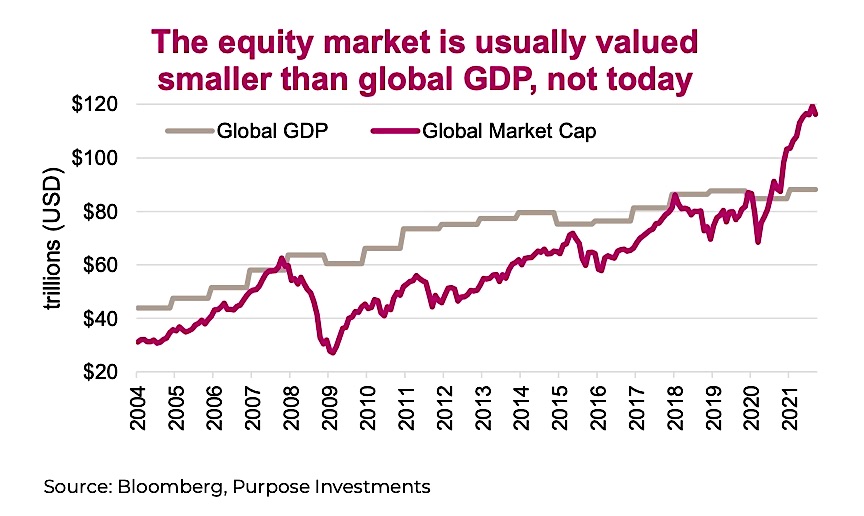
Based on the global GDP measure versus the global equity market valuation, we appear to be in some uncharted territory.
Just looking at the chart, you can see this is far from a perfect relationship, but you may also see that when GDP is rising nicely so is the market. And when GDP growth slows or falls, as does the equity market, roughly speaking. Nonetheless, the equity market advance of late does not seem anywhere near commensurate to the advance in the economy. It’s also worth noting that the global GDP metric is annual, and the move up from 2020 to 2021 is forecast to slow from 2021 to 2022.
There is a connection between the economy and the market, but comparing them is comparing apples to oranges. The measure for the economy as we know is GDP: an annual number that attempts to capture all economic activity. In other words, if all economic activity stopped for a year, GDP would be zero. Meanwhile, a company’s value is most often based on its earnings capabilities; both today and into the future (and usually more of the latter). Clearly a temporal mismatch. Additionally, the market is only measuring the earnings power of companies that are big enough to be public. The pandemic has disproportionally hit small, non-public businesses – especially services – while larger manufacturers and “virtual” service-providers (many of whom are public) have benefited.
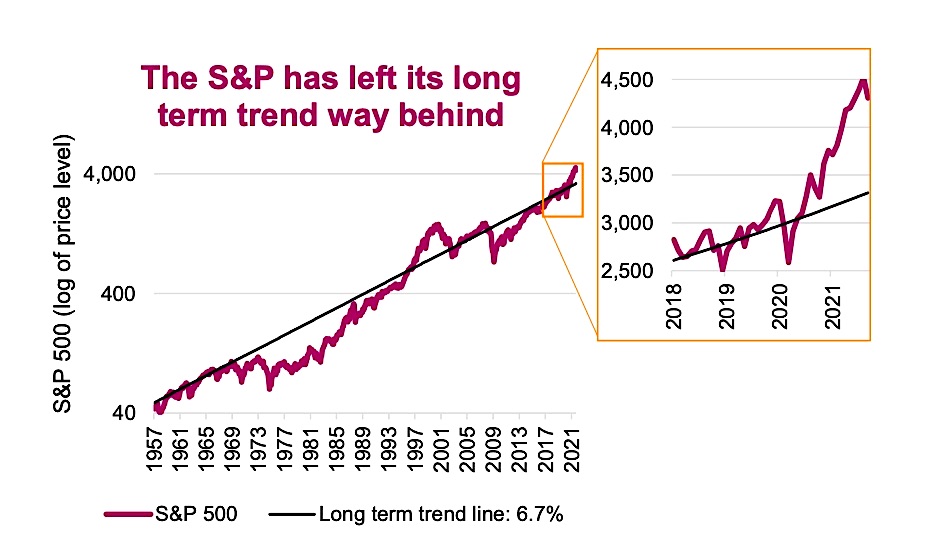
So let us simplify it even further. For the S&P 500, ignore the size relative to the economy, ignore the price-to-earnings, sales, book, EBITDA, DCF, etc. Instead, just look at the long-term return relative to the return of late. This chart is the S&P 500 since the 1950s with a simple trendline that works out to an annualized 6.7%, excluding dividends. Add a point or two from dividends, a respectable return. But clearly over the past couple years, the S&P 500 briefly dipped below trend during the pandemic-induced bear market then rocketed well above. Not as far above as the 1990s tech bubble but getting closer.
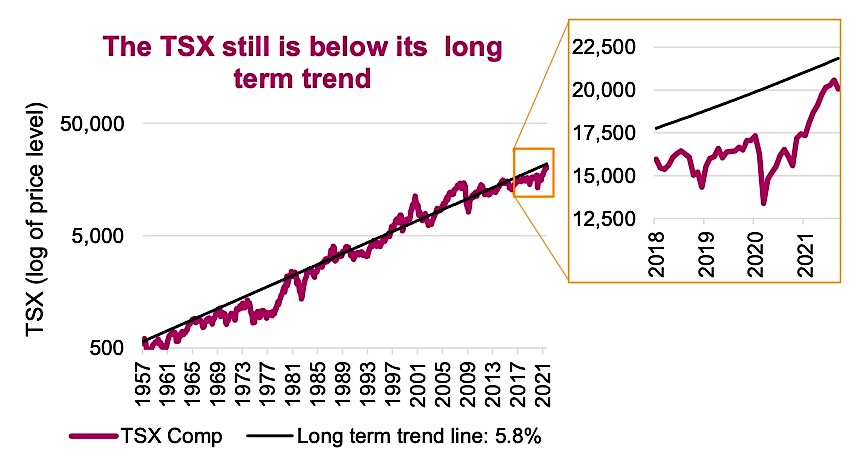
Turning to Canada’s TSX, things certainly look more interesting and are less of a concern. Note the long-term trend line has a compound growth rate of 5.8% during this period, but the TSX has historically enjoyed a higher dividend yield. Hence, the performance spread of the S&P outperforming the TSX is lower than this would imply. More importantly, while the U.S. equity market is well above its trend, the TSX is still below its trend.
Investment Implications
“This time is different,” is often labeled the most expensive words for an investor’s portfolio. This investor lesson is based on mean reversion. When things go on for too long or get too excessive, they often revert to the mean, or below it for a time.
The world may be different. The ongoing policy experiment with Modern Monetary Theory could be changing the rules. Perhaps ‘TINA’ (There Is No Alternative) with a world where bond markets are so expensive they actually lose money in real terms, is the reason markets will keep rising. Maybe Elon Musk’s giving his new puppy the name Floki is worth a few billion in the crypto market in its namesake. And maybe these markets keep going for months or quarters or a more than a year. History says otherwise and there is a mean reversion out there that will likely be more severe the longer this market continues on this path. The timing remains anyone’s guess, but keeping a defensive tilt remains our mindset, as does keeping liquidity in our portfolios to take advantage of rebalancing opportunities. It can be tough while the trend continues, but lots of alpha is made at inflections.
Source: Charts are sourced to Bloomberg L.P., Purpose Investments Inc., and Richardson Wealth unless otherwise noted.
Twitter: @ConnectedWealth
Any opinions expressed herein are solely those of the authors, and do not in any way represent the views or opinions of any other person or entity.


