The power of words is undeniable. However, you cannot influence people's perception of your brand, services, or products by using text alone.
Visual representations engage the user's sense of sight, and imagery, words, and graphic elements are more likely to catch readers' attention. Infographics are perfect for this purpose.
Let's look at a few tools to help you design impressive infographics and spice up your blog posts, landing pages, or promotional ads.
1. Canva
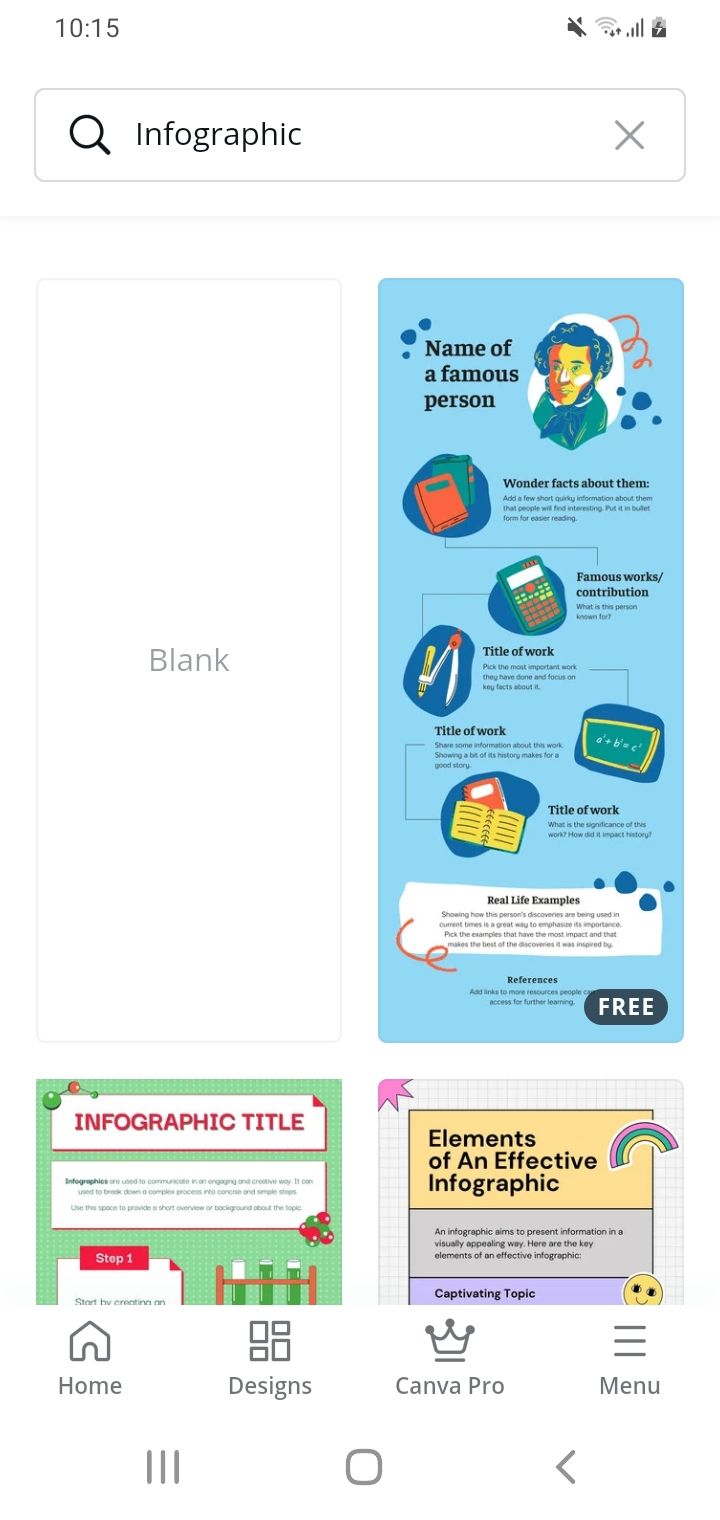
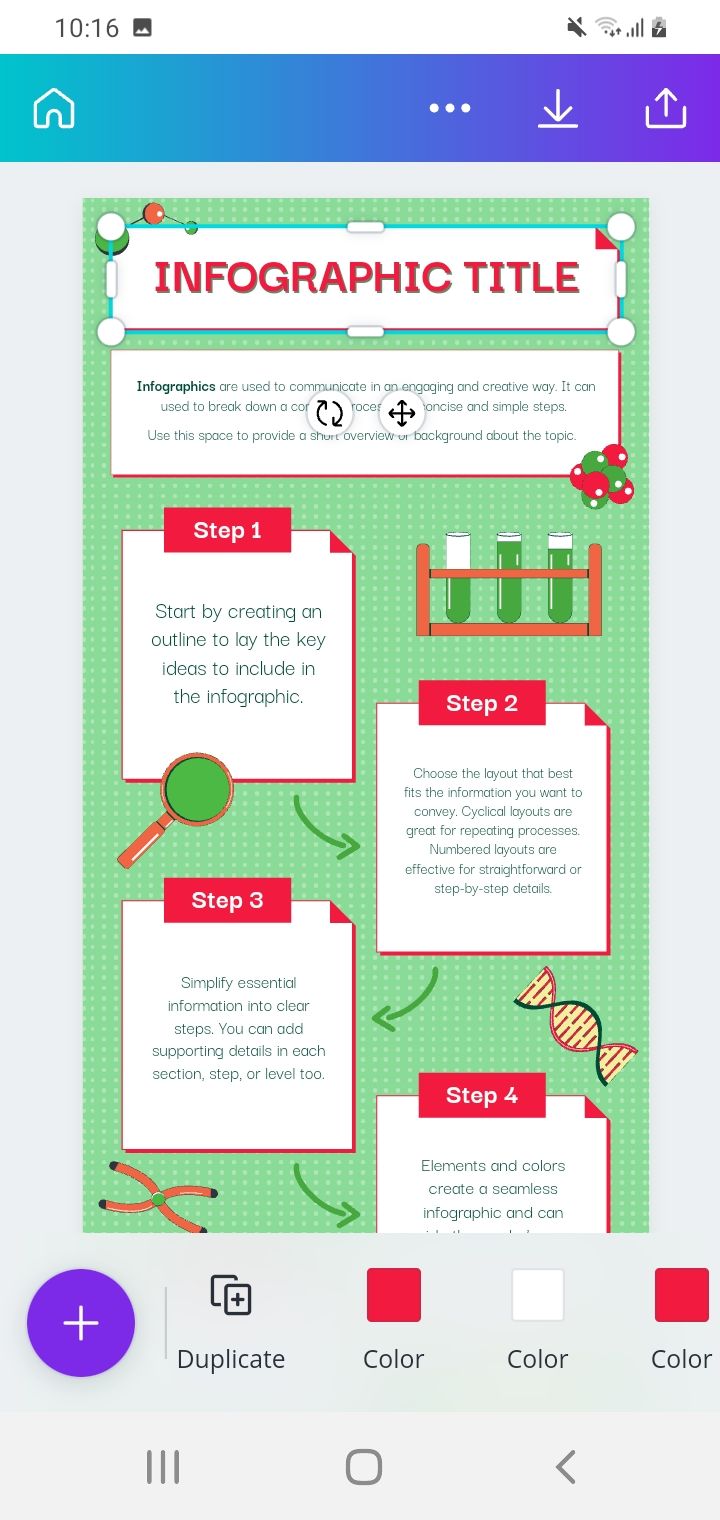
With Canva, you have access to hundreds of infographic templates. That means using Canva can help you create an infographic in no time. In addition, you can explore different illustrations and designs to make your text more engaging.
The platform also features an exhaustive collection of images, icons, illustrations, and vector graphics to help your presentations stand out.
Canva's collaboration features make it an ideal space for teams to create together. And there is no lengthy registration process. You can also tweak and comment on designs in real-time.
You can download completed designs in PNG, JPEG, or GIF format. You can even schedule your posts on social media with Canva's pre-scheduling tool, which makes it easy to manage all your social media accounts in one place. The Canva mobile application is available for both Android and iOS devices.
Download: Canva for Android | iOS (Free, premium version available)
2. Desygner
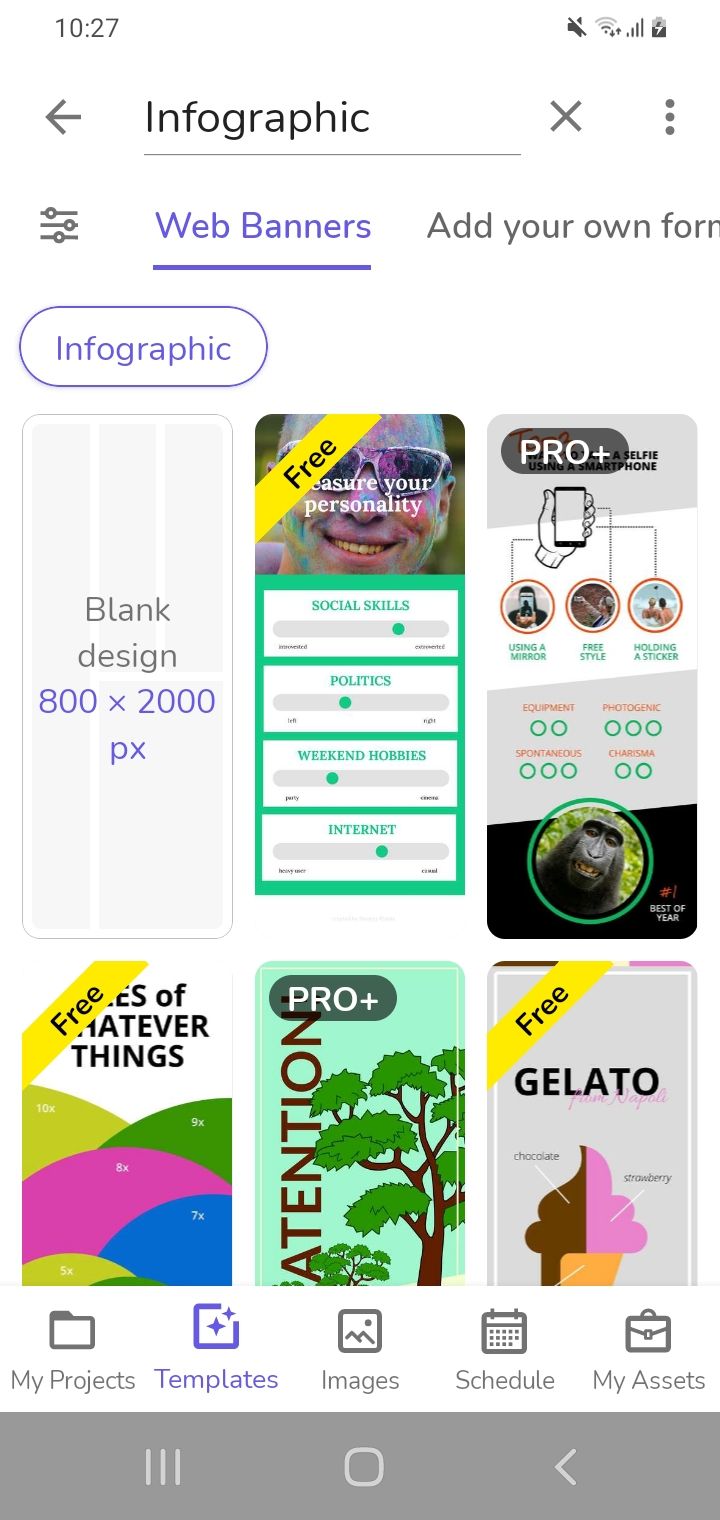
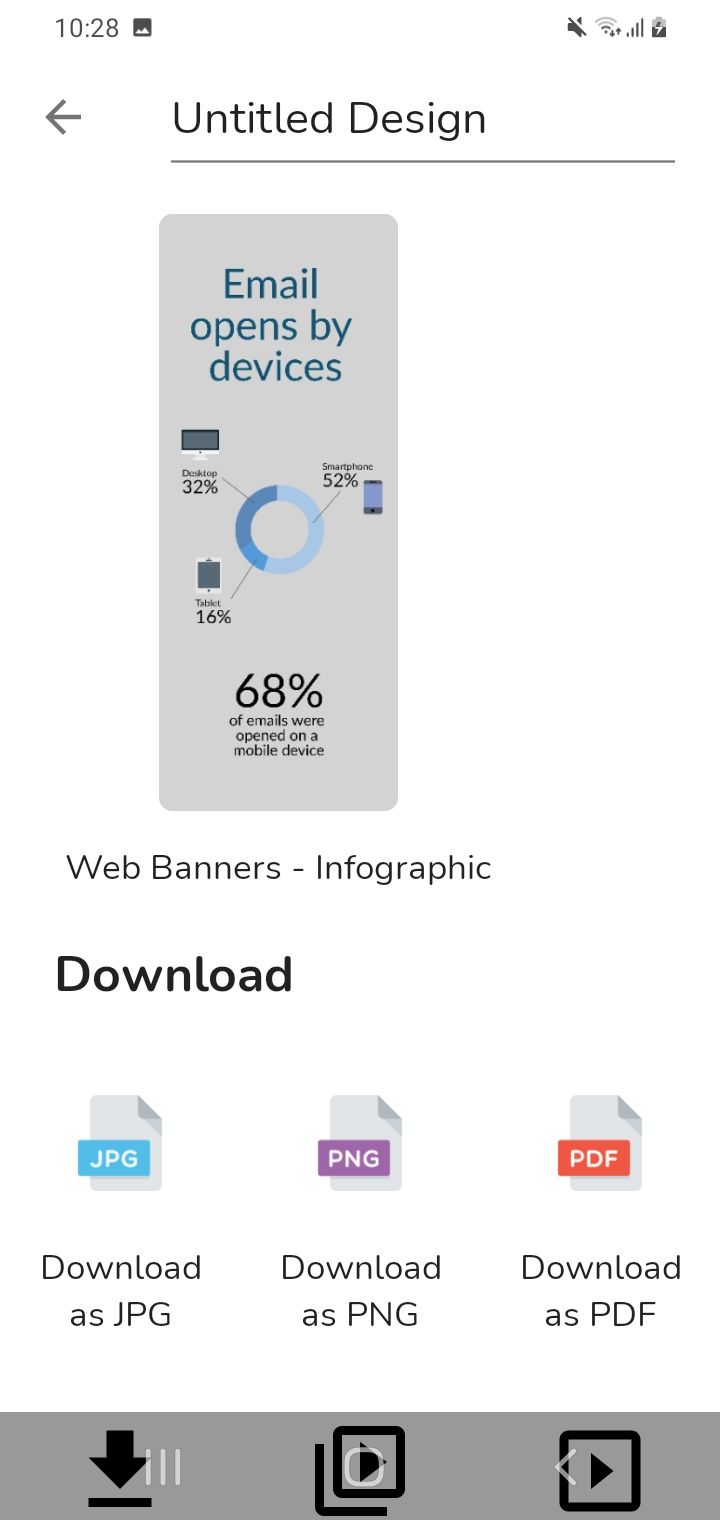
Despite its strange name, Desygner is a simple but powerful tool that lets non-designers create graphics without getting too entangled in professional software. As with Canva, it also has a gallery with thousands of templates well-suited for almost any industry.
Using a simple drag-and-drop interface, you can add images, change colors, and alter text quickly. With Desygner, you can add effects and change layers for a touch of elegance in your infographics.
Once you've created your perfect design, you can share it via email, Instagram, Facebook, Twitter, or other social networks. Repurposing these graphics with Desygner is also easy.
Desygner's free version has everything most people need to create stunning graphics, but its premium plans offer more options. If you become a subscriber to the Pro+ or Business plans, you'll gain access to more fonts, pre-scheduling on social media accounts, and an ad-free experience. Desygner is available on both Android and iOS. It also offers a web interface.
Download: Desygner for Android | iOS (Free, premium version available)
3. Crello
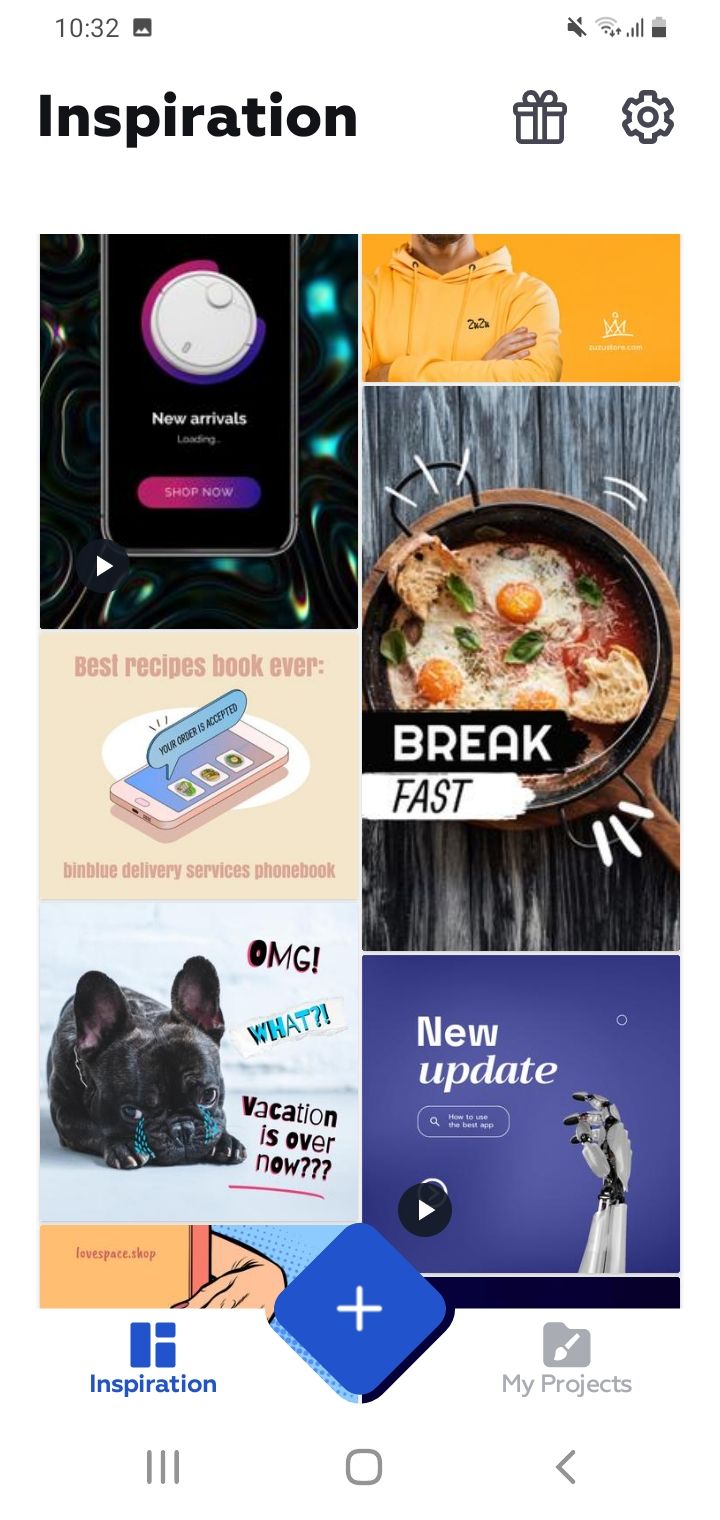
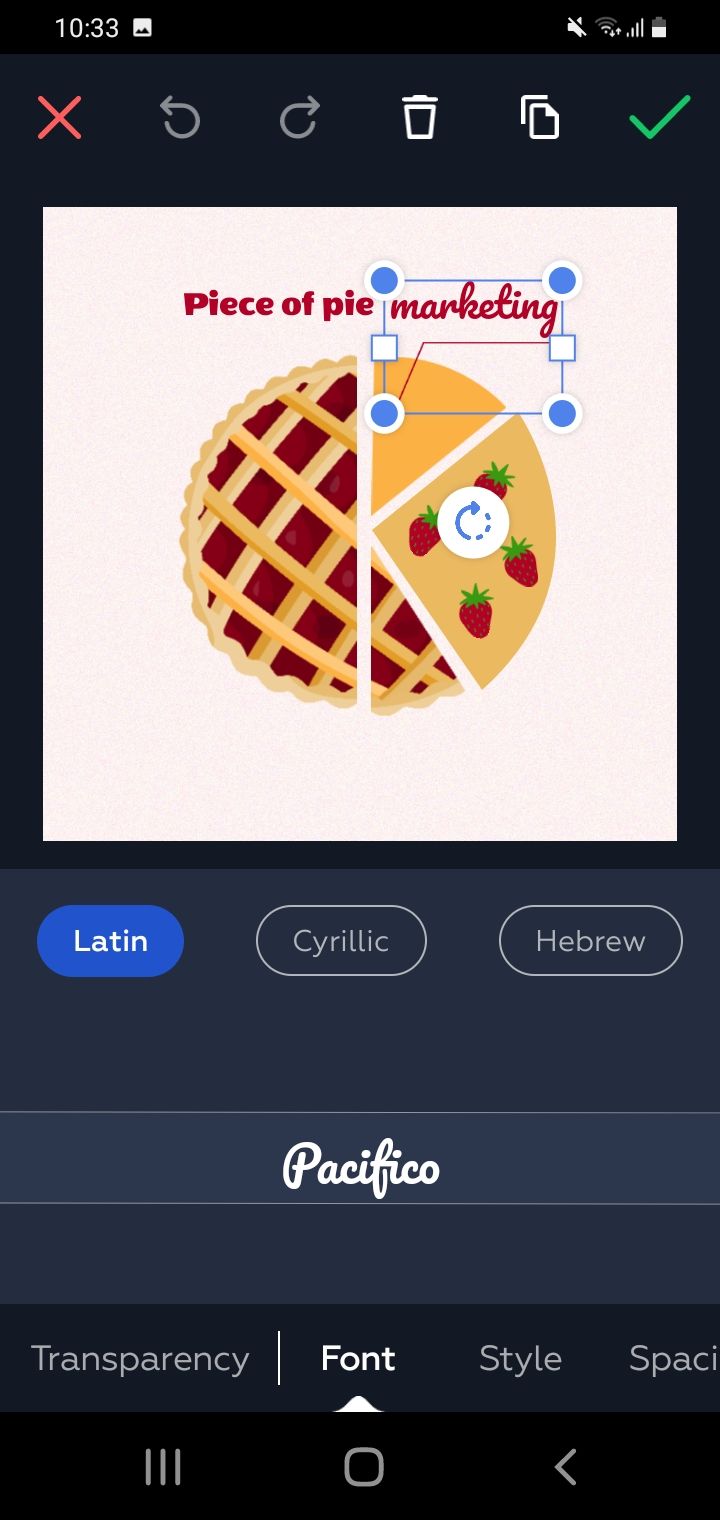
Crello's more than 50,000 templates make it the perfect partner for designing infographics. The platform's clean interface is also easy to use.
And with Crello's Depositphotos integration, you can access millions of stock images to enhance your graphics. In addition to these stock files, Crello Pro subscribers have access to a premium graphic gallery, which offers unique designs that are sure to grab your reader's attention.
The app comes with preset templates to create content for various social media channels. Branding content is also inexpensive and easy. Crello also won't break the bank as its free plan has most of the features you need to enjoy a satisfactory design experience. However, if you want better collaboration and access to all resources, Crello offers a premium plan for $7.99 per month. Crello is available for both Android and iOS.
Download: Crello for Android | iOS (Free, premium version available)
4. Adobe Spark Post
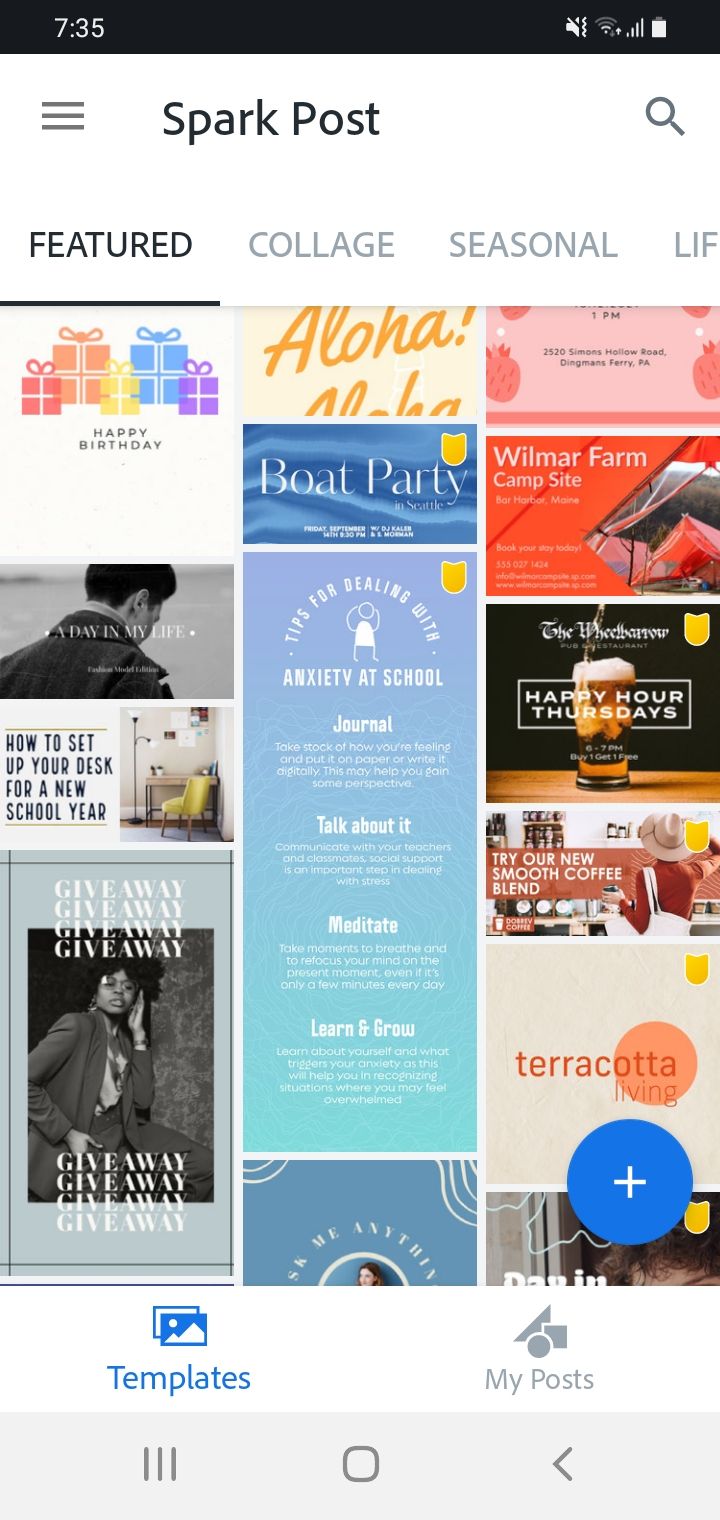
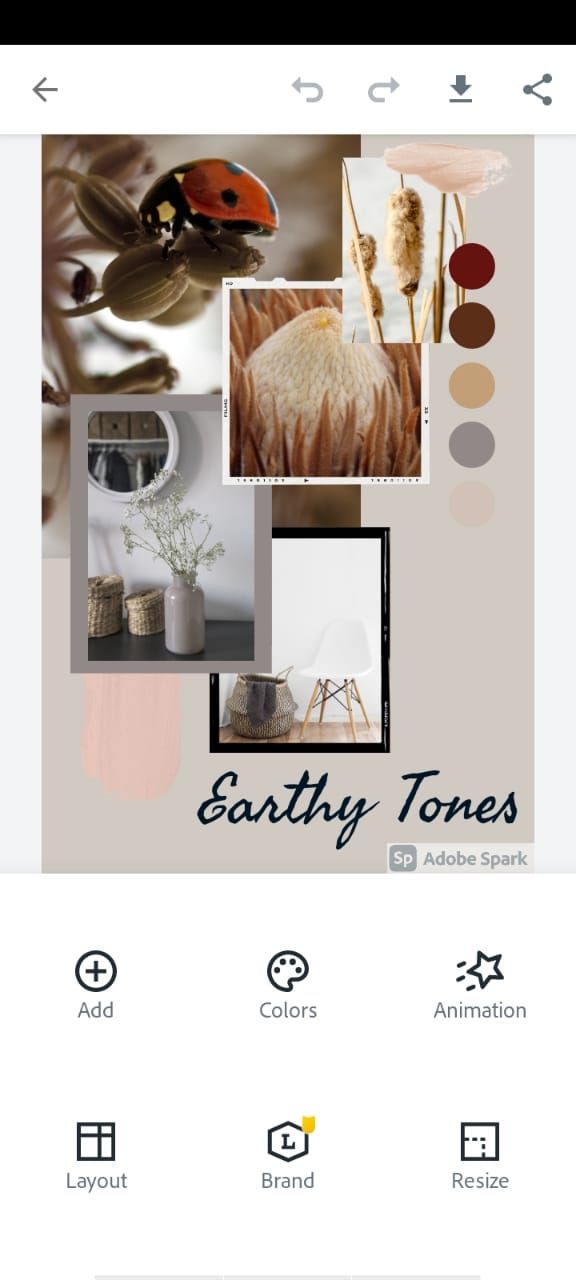
Adobe Spark Post provides all the tools you need to create unique and compelling infographics. In addition, spark Post has a wide selection of fonts you can use to make your designs come to life.
With Adobe Spark, you have access to thousands of templates that you can easily edit. Simply replace text and graphics to craft an exciting custom message.
Spark Post lets you apply design filters to plain text and create visually interesting graphics with a single tap. It's also possible to change the entire design palette in just a few clicks.
With Spark Post's auto-resize feature, it's easy to adjust the dimensions of your ready-made graphics to fit most social media platform requirements.
You may not find as many features in Spark Post's Android app as its web platform, but the app is constantly updated. Additionally, all your designs are backed up to the cloud, so you won't lose data if you switch devices.
While you can use Spark Post's basic features for free, you'll need to subscribe to its premium plan if you want effective collaboration, access to premium templates, and full access to fonts. The cost is $9.99 per month and includes a 30-day free trial.
Whether you're using Android or iOS, Adobe Spark Post is an excellent infographic creation tool.
Download: Adobe Spark Post for Android | iOS (Free, premium version available)
5. Brochure Maker
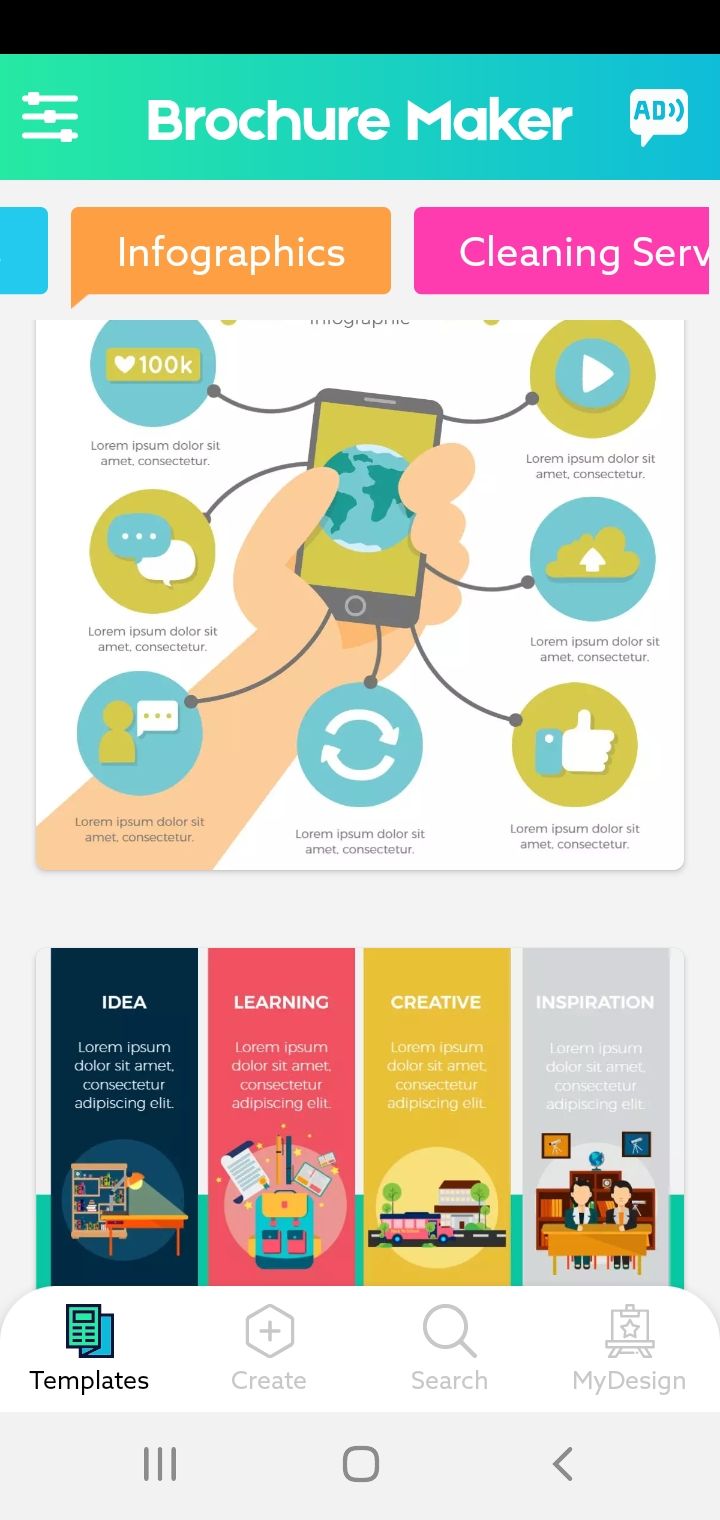
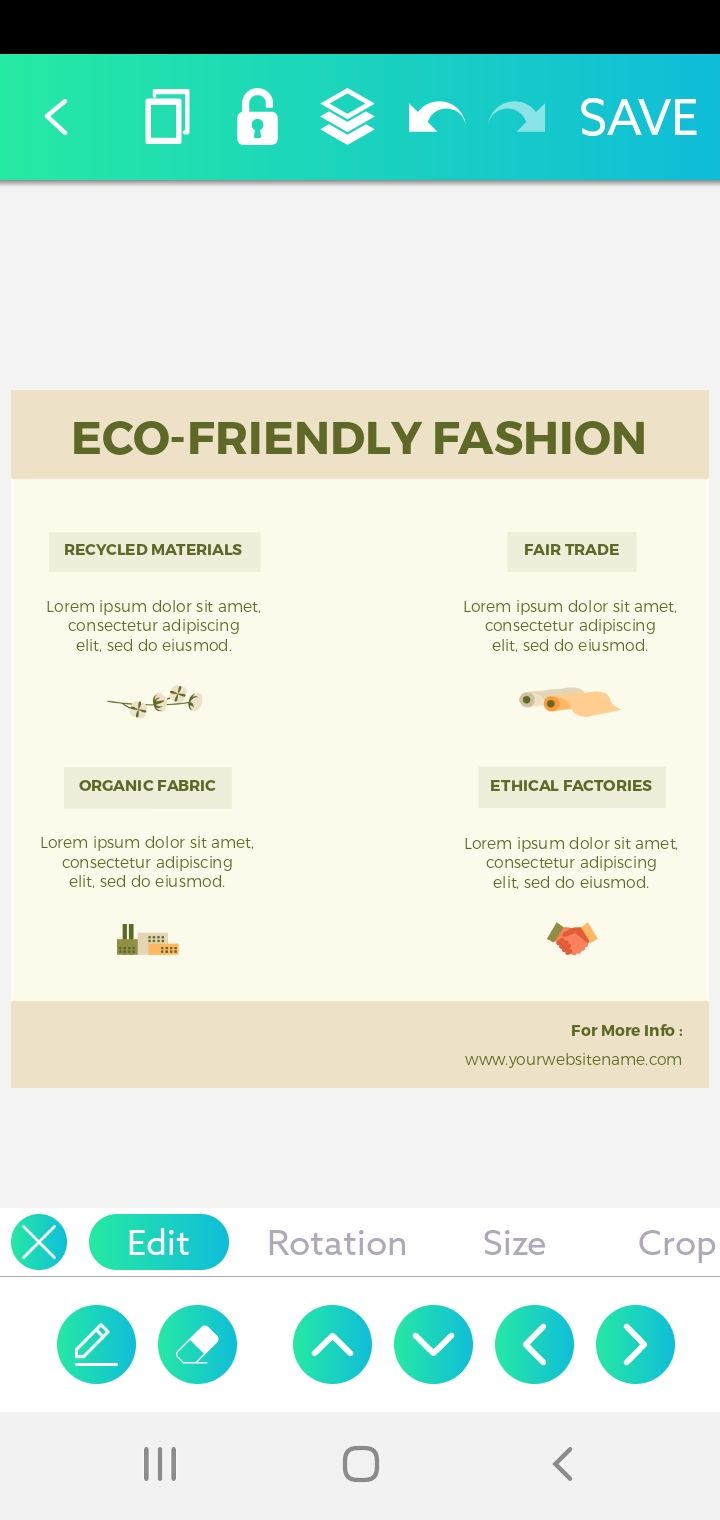
While this app sounds like three, Brochure Maker, Pamphlets, Infographic Designer is its full name. Brochure Maker (for short) has over a hundred fonts you can combine with a good collection of design elements, including shapes, icons, and text, to give presence to your infographics. No matter your area of specialization, Brochure Maker's 5000+ template gallery will help you get started.
It's effortless to use, and even if you don't have any design experience, you'll get the hang of it in no time. While there is a free version of the app, you must subscribe to the PRO plan to access full templates, fonts, and new features. Unfortunately, this version of Brochure Maker is only available for Android.
Download: Brochure Maker, Pamphlets, Infographic Designer for Android (Free, premium version available)
Increase Engagement With Beautiful Infographics
Keep in mind, the primary goal of infographics is to help visualize data. Therefore, you should avoid overloading your design. It's crucial to maintain a balance between text and images for maximum impact.
A well-designed infographic can boost engagement and conversion, whether it's on your website, in an ad, or on a landing page. Of course, that means more visitors and more sales. And, while there are many other ways to increase the value given by your website, infographics are a wonderful place to start.

