Last year’s senior living occupancy seems to be an indicator of current performance, according to Beth Burnham Mace, chief economist, and Anne Standish, research statistician, at the National Investment Center for Seniors Housing & Care.
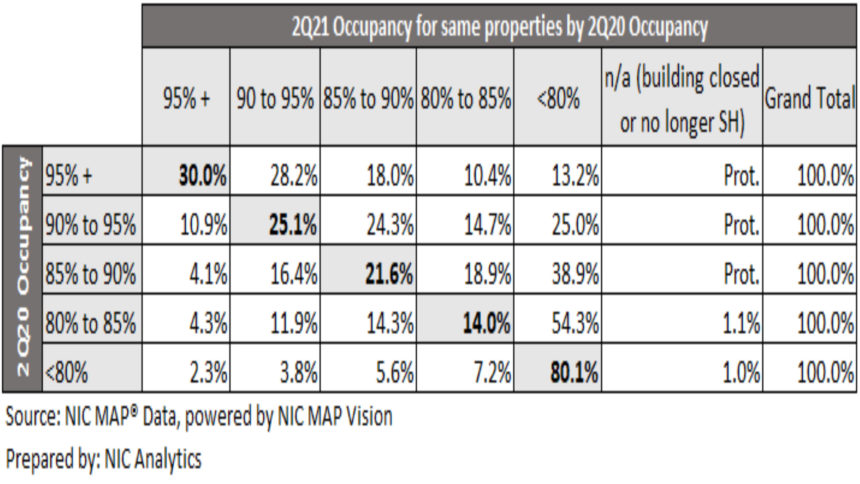
In a recent blog post, the two separated the independent living and assisted living properties in the NIC MAP primary markets occupancy cohorts to evaluate how those properties performed. Of the group that showed more than 95% occupancy in the second quarter of 2020, 30% held firm in occupancy and 28.2% has slipped into 90% to 95% occupancy category compared to a year ago. Of the 340 properties examined, two thirds were mostly-assisted-living properties, with the others being mostly-independent-living.
“This suggests that the high property level performers in 2Q20 tended to be fairly resilient (or did take occupancy hits but still were able to recover),” the authors wrote.
The 1,145 lower performers were fairly consistent over time. Of the properties that showed less than 80% occupancy in 2020, 80.1% remained in the under-80% cohort in the second quarter of 2021. Many have struggled, and just 2.3% managed to increase occupancy to more than 95%, Mace and Standish said. Eighty percent of the properties were mostly-assisted-living; the rest, mostly-independent-living.
“The highest performing senior housing properties in 2Q20, as measured by occupancy, generally remained highly occupied a year later, while properties with the lowest occupancies in 2Q20 tended to remain in the bottom. Properties in the middle of the pack in 2Q20 saw large drops in occupancy over the one-year course of the pandemic studied in this analysis and had not shown signs of recovery as of 2Q21,” Mace and Standish wrote.