
(STACKER)– The deployment of vaccines beginning in December signaled a turning point in the pandemic. By Feb. 2, more Americans had been vaccinated for COVID-19 than had been infected. But as vaccination rates lagged over the summer, new surges of COVID-19 came. More than 80% of these cases by late July were caused by the Delta variant, which is more contagious than the original virus. This has resulted in growing rates of community transmission and—especially in areas with lower vaccination rates—increasing rates of hospitalization and death.
The United States reached 684,360 COVID-19-related deaths and nearly 42.7 million COVID-19 cases as of Sep. 23, according to Johns Hopkins University.
Currently, 55% of the U.S. population is fully vaccinated. Epidemiologists say the lower the vaccination rate, the more the virus has the opportunity to continue to evolve and become more dangerous.
Stacker compiled a list of the counties with the lowest in-patient bed capacity in Missouri using data from the U.S. Department of Health & Human Services. Counties are ranked by the percent of in-patient hospital beds filled as of Sep. 20, with ICU availability serving as a tiebreaker. Hospitalization data was available for about 77% of counties in the U.S.
Keep reading to see what hospital capacity looks like in your county:

M. Curtis // Shutterstock
#50. Laclede County, MO
– Inpatient beds occupied: 50.0% (6.0% by COVID-19 patients)
— 38.3% more availability than Missouri overall
– ICU beds occupied: 56.0% (20.0% by COVID-19 patients)
— 33.3% more availability than Missouri overall
– Cases per 100k in last 7 days: 137 (49 cases)
– Population that is fully vaccinated: 31.7% (11,322 fully vaccinated)
— 32.8% lower vaccination rate than Missouri
Charles W. Chapman // Wikimedia Commons
#49. Audrain County, MO
– Inpatient beds occupied: 51.0% (0.0% by COVID-19 patients)
— 37.0% more availability than Missouri overall
– ICU beds occupied: .0% (.0% by COVID-19 patients)
— 100.0% more availability than Missouri overall
– Cases per 100k in last 7 days: 161 (41 cases)
– Population that is fully vaccinated: 32.1% (8,147 fully vaccinated)
— 32.0% lower vaccination rate than Missouri
Kbh3rd // Wikimedia Commons
#48. Livingston County, MO
– Inpatient beds occupied: 51.0% (2.0% by COVID-19 patients)
— 37.0% more availability than Missouri overall
– ICU beds occupied: 25.0% (.0% by COVID-19 patients)
— 70.2% more availability than Missouri overall
– Cases per 100k in last 7 days: 92 (14 cases)
– Population that is fully vaccinated: 38.1% (5,794 fully vaccinated)
— 19.3% lower vaccination rate than Missouri
Kbh3rd // Wikimedia Commons
#47. Henry County, MO
– Inpatient beds occupied: 52.0% (9.0% by COVID-19 patients)
— 35.8% more availability than Missouri overall
– ICU beds occupied: 41.0% (12.0% by COVID-19 patients)
— 51.2% more availability than Missouri overall
– Cases per 100k in last 7 days: 330 (72 cases)
– Population that is fully vaccinated: 38.8% (8,458 fully vaccinated)
— 17.8% lower vaccination rate than Missouri
Americasroof // Wikimedia Commons
#46. Harrison County, MO
– Inpatient beds occupied: 55.0% (0.0% by COVID-19 patients)
— 32.1% more availability than Missouri overall
– ICU beds occupied: data not available
— 84% full in Missouri overall
– Cases per 100k in last 7 days: 192 (16 cases)
– Population that is fully vaccinated: 28.9% (2,414 fully vaccinated)
— 38.8% lower vaccination rate than Missouri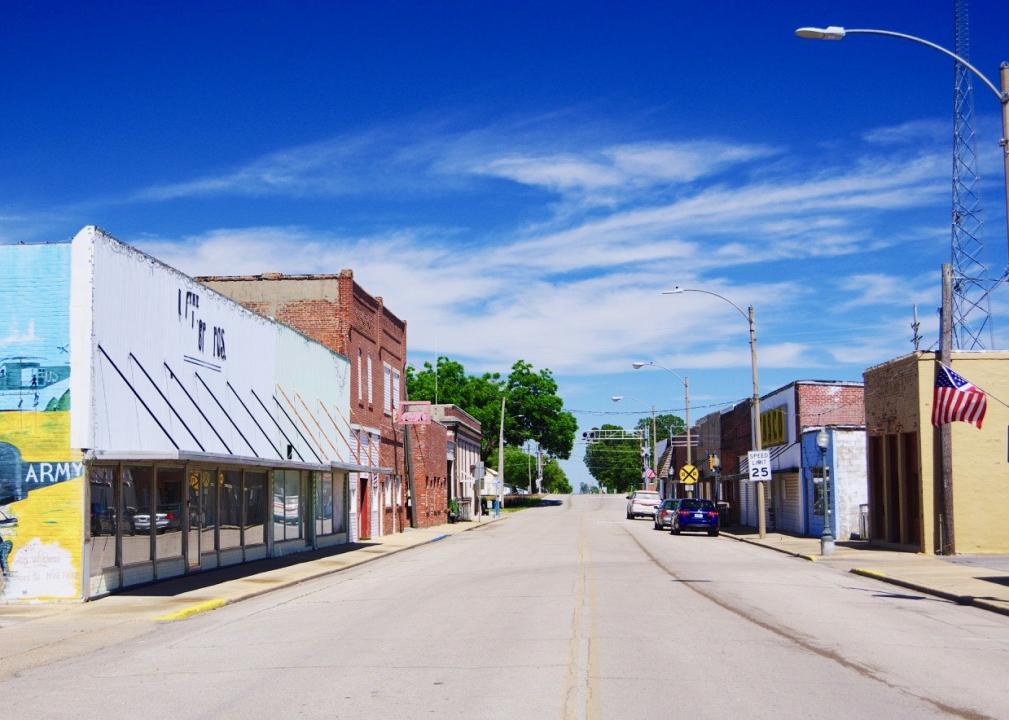
Brian Stansberry // Wikimedia Commons
#45. Stoddard County, MO
– Inpatient beds occupied: 56.0% (16.0% by COVID-19 patients)
— 30.9% more availability than Missouri overall
– ICU beds occupied: 5.0% (.0% by COVID-19 patients)
— 94.0% more availability than Missouri overall
– Cases per 100k in last 7 days: 617 (179 cases)
– Population that is fully vaccinated: 33.3% (9,668 fully vaccinated)
— 29.4% lower vaccination rate than Missouri
Kbh3rd // Wikimedia Commons
#44. Lawrence County, MO
– Inpatient beds occupied: 57.0% (12.0% by COVID-19 patients)
— 29.6% more availability than Missouri overall
– ICU beds occupied: data not available
— 84% full in Missouri overall
– Cases per 100k in last 7 days: 154 (59 cases)
– Population that is fully vaccinated: 33.0% (12,650 fully vaccinated)
— 30.1% lower vaccination rate than Missouri
Kbh3rd // Wikimedia Commons
#43. Clinton County, MO
– Inpatient beds occupied: 58.0% (4.0% by COVID-19 patients)
— 28.4% more availability than Missouri overall
– ICU beds occupied: 73.0% (47.0% by COVID-19 patients)
— 13.1% more availability than Missouri overall
– Cases per 100k in last 7 days: 319 (65 cases)
– Population that is fully vaccinated: 40.3% (8,211 fully vaccinated)
— 14.6% lower vaccination rate than Missouri
Americasroof // Wikimedia Commons
#42. Washington County, MO
– Inpatient beds occupied: 60.0% (21.0% by COVID-19 patients)
— 25.9% more availability than Missouri overall
– ICU beds occupied: data not available
— 84% full in Missouri overall
– Cases per 100k in last 7 days: 348 (86 cases)
– Population that is fully vaccinated: 26.4% (6,539 fully vaccinated)
— 44.1% lower vaccination rate than Missouri
Jpjonesusn // Wikimedia Commons
#41. Bates County, MO
– Inpatient beds occupied: 63.0% (11.0% by COVID-19 patients)
— 22.2% more availability than Missouri overall
– ICU beds occupied: 24.0% (.0% by COVID-19 patients)
— 71.4% more availability than Missouri overall
– Cases per 100k in last 7 days: 346 (56 cases)
– Population that is fully vaccinated: 33.5% (5,413 fully vaccinated)
— 29.0% lower vaccination rate than Missouri
Kbh3rd // Wikimedia Commons
#40. Randolph County, MO
– Inpatient beds occupied: 64.0% (12.0% by COVID-19 patients)
— 21.0% more availability than Missouri overall
– ICU beds occupied: 86.0% (60.0% by COVID-19 patients)
— 2.4% more full than Missouri overall
– Cases per 100k in last 7 days: 246 (61 cases)
– Population that is fully vaccinated: 31.7% (7,846 fully vaccinated)
— 32.8% lower vaccination rate than Missouri
Kbh3rd // Wikimedia Commons
#39. Franklin County, MO
– Inpatient beds occupied: 65.0% (11.0% by COVID-19 patients)
— 19.8% more availability than Missouri overall
– ICU beds occupied: 83.0% (38.0% by COVID-19 patients)
— 1.2% more availability than Missouri overall
– Cases per 100k in last 7 days: 325 (338 cases)
– Population that is fully vaccinated: 46.7% (48,521 fully vaccinated)
— 1.1% lower vaccination rate than Missouri
Pixabay
#38. Boone County, MO
– Inpatient beds occupied: 66.0% (10.0% by COVID-19 patients)
— 18.5% more availability than Missouri overall
– ICU beds occupied: 81.0% (18.0% by COVID-19 patients)
— 3.6% more availability than Missouri overall
– Cases per 100k in last 7 days: 190 (343 cases)
– Population that is fully vaccinated: 53.5% (96,473 fully vaccinated)
— 13.3% higher vaccination rate than Missouri
Paul Sableman // Wikimedia Commons
#37. St. Francois County, MO
– Inpatient beds occupied: 67.0% (31.0% by COVID-19 patients)
— 17.3% more availability than Missouri overall
– ICU beds occupied: 71.0% (59.0% by COVID-19 patients)
— 15.5% more availability than Missouri overall
– Cases per 100k in last 7 days: 400 (269 cases)
– Population that is fully vaccinated: 36.1% (24,253 fully vaccinated)
— 23.5% lower vaccination rate than Missouri
Brian Stansberry // Wikimedia Commons
#36. Pemiscot County, MO
– Inpatient beds occupied: 67.0% (0.0% by COVID-19 patients)
— 17.3% more availability than Missouri overall
– ICU beds occupied: data not available
— 84% full in Missouri overall
– Cases per 100k in last 7 days: 247 (39 cases)
– Population that is fully vaccinated: 22.8% (3,596 fully vaccinated)
— 51.7% lower vaccination rate than Missouri
Katherine Dowler // Wikimedia
#35. Cole County, MO
– Inpatient beds occupied: 69.0% (8.0% by COVID-19 patients)
— 14.8% more availability than Missouri overall
– ICU beds occupied: 63.0% (17.0% by COVID-19 patients)
— 25.0% more availability than Missouri overall
– Cases per 100k in last 7 days: 154 (118 cases)
– Population that is fully vaccinated: 46.6% (35,778 fully vaccinated)
— 1.3% lower vaccination rate than Missouri
Kbh3rd // Wikimedia Commons
#34. Howell County, MO
– Inpatient beds occupied: 69.0% (15.0% by COVID-19 patients)
— 14.8% more availability than Missouri overall
– ICU beds occupied: 80.0% (45.0% by COVID-19 patients)
— 4.8% more availability than Missouri overall
– Cases per 100k in last 7 days: 219 (88 cases)
– Population that is fully vaccinated: 27.8% (11,163 fully vaccinated)
— 41.1% lower vaccination rate than Missouri
Steveewatkins // Wikimedia Commons
#33. Dent County, MO
– Inpatient beds occupied: 70.0% (23.0% by COVID-19 patients)
— 13.6% more availability than Missouri overall
– ICU beds occupied: data not available
— 84% full in Missouri overall
– Cases per 100k in last 7 days: 283 (44 cases)
– Population that is fully vaccinated: 26.1% (4,062 fully vaccinated)
— 44.7% lower vaccination rate than Missouri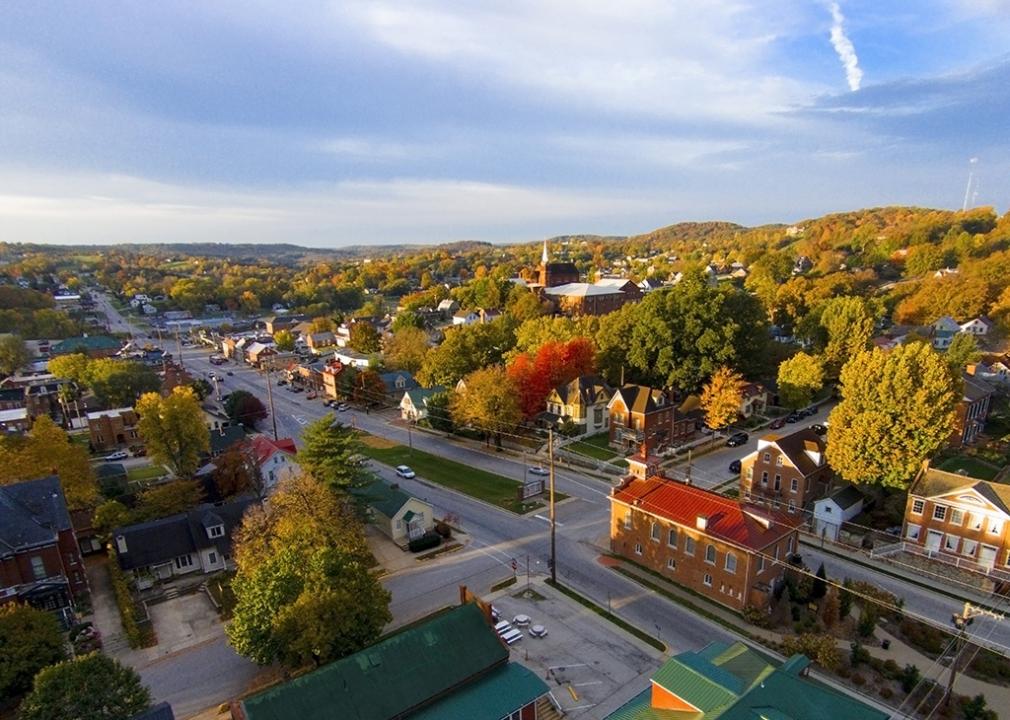
Davekeiser // Wikimedia Commons
#32. Gasconade County, MO
– Inpatient beds occupied: 71.0% (12.0% by COVID-19 patients)
— 12.3% more availability than Missouri overall
– ICU beds occupied: data not available
— 84% full in Missouri overall
– Cases per 100k in last 7 days: 238 (35 cases)
– Population that is fully vaccinated: 45.9% (6,745 fully vaccinated)
— 2.8% lower vaccination rate than Missouri
Americasroof // Wikimedia Commons
#31. Gentry County, MO
– Inpatient beds occupied: 73.0% (11.0% by COVID-19 patients)
— 9.9% more availability than Missouri overall
– ICU beds occupied: data not available
— 84% full in Missouri overall
– Cases per 100k in last 7 days: 457 (30 cases)
– Population that is fully vaccinated: 37.8% (2,486 fully vaccinated)
— 19.9% lower vaccination rate than Missouri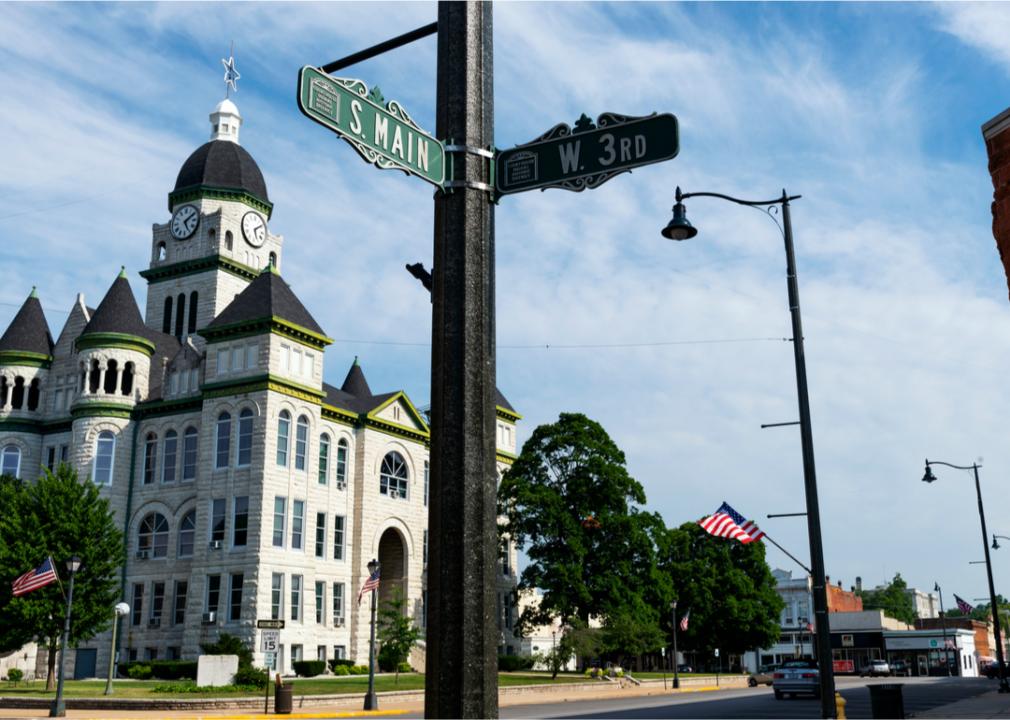
Peek Creative Collective // Shutterstock
#30. Jasper County, MO
– Inpatient beds occupied: 75.0% (11.0% by COVID-19 patients)
— 7.4% more availability than Missouri overall
– ICU beds occupied: 84.0% (34.0% by COVID-19 patients)
— 0.0% more availability than Missouri overall
– Cases per 100k in last 7 days: 187 (227 cases)
– Population that is fully vaccinated: 41.1% (49,883 fully vaccinated)
— 12.9% lower vaccination rate than Missouri
Joseph Sohm // Shutterstock
#29. New Madrid County, MO
– Inpatient beds occupied: 76.0% (22.0% by COVID-19 patients)
— 6.2% more availability than Missouri overall
– ICU beds occupied: 98.0% (71.0% by COVID-19 patients)
— 16.7% more full than Missouri overall
– Cases per 100k in last 7 days: 750 (128 cases)
– Population that is fully vaccinated: 27.5% (4,698 fully vaccinated)
— 41.7% lower vaccination rate than Missouri
Kbh3rd // Wikimedia Commons
#28. Cass County, MO
– Inpatient beds occupied: 78.0% (14.0% by COVID-19 patients)
— 3.7% more availability than Missouri overall
– ICU beds occupied: 87.0% (17.0% by COVID-19 patients)
— 3.6% more full than Missouri overall
– Cases per 100k in last 7 days: 272 (288 cases)
– Population that is fully vaccinated: 43.0% (45,499 fully vaccinated)
— 8.9% lower vaccination rate than Missouri
Markkaempfer // Wikimedia Commons
#27. Perry County, MO
– Inpatient beds occupied: 79.0% (18.0% by COVID-19 patients)
— 2.5% more availability than Missouri overall
– ICU beds occupied: data not available
— 84% full in Missouri overall
– Cases per 100k in last 7 days: 434 (83 cases)
– Population that is fully vaccinated: 33.6% (6,427 fully vaccinated)
— 28.8% lower vaccination rate than Missouri
Andrew.Belair // Wikimedia Commons
#26. Adair County, MO
– Inpatient beds occupied: 80.0% (13.0% by COVID-19 patients)
— 1.2% more availability than Missouri overall
– ICU beds occupied: 81.0% (29.0% by COVID-19 patients)
— 3.6% more availability than Missouri overall
– Cases per 100k in last 7 days: 249 (63 cases)
– Population that is fully vaccinated: 39.0% (9,891 fully vaccinated)
— 17.4% lower vaccination rate than Missouri
Nja1985, retouched by Kbh3rd // Wikimedia Commons
#25. Johnson County, MO
– Inpatient beds occupied: 80.0% (24.0% by COVID-19 patients)
— 1.2% more availability than Missouri overall
– ICU beds occupied: 91.0% (68.0% by COVID-19 patients)
— 8.3% more full than Missouri overall
– Cases per 100k in last 7 days: 337 (182 cases)
– Population that is fully vaccinated: 33.3% (18,026 fully vaccinated)
— 29.4% lower vaccination rate than Missouri
Jose Kevo // Wikicommons
#24. Greene County, MO
– Inpatient beds occupied: 81.0% (10.0% by COVID-19 patients)
— 0.0% more availability than Missouri overall
– ICU beds occupied: 88.0% (27.0% by COVID-19 patients)
— 4.8% more full than Missouri overall
– Cases per 100k in last 7 days: 126 (368 cases)
– Population that is fully vaccinated: 42.9% (125,673 fully vaccinated)
— 9.1% lower vaccination rate than Missouri
Kbh3rd // Wikimedia Commons
#23. Barton County, MO
– Inpatient beds occupied: 81.0% (14.0% by COVID-19 patients)
— 0.0% more availability than Missouri overall
– ICU beds occupied: data not available
— 84% full in Missouri overall
– Cases per 100k in last 7 days: 281 (33 cases)
– Population that is fully vaccinated: 29.4% (3,457 fully vaccinated)
— 37.7% lower vaccination rate than Missouri
NMSU // Wikimedia Commons
#22. Nodaway County, MO
– Inpatient beds occupied: 82.0% (5.0% by COVID-19 patients)
— 1.2% more full than Missouri overall
– ICU beds occupied: 7.0% (.0% by COVID-19 patients)
— 91.7% more availability than Missouri overall
– Cases per 100k in last 7 days: 27 (6 cases)
– Population that is fully vaccinated: 42.1% (9,291 fully vaccinated)
— 10.8% lower vaccination rate than Missouri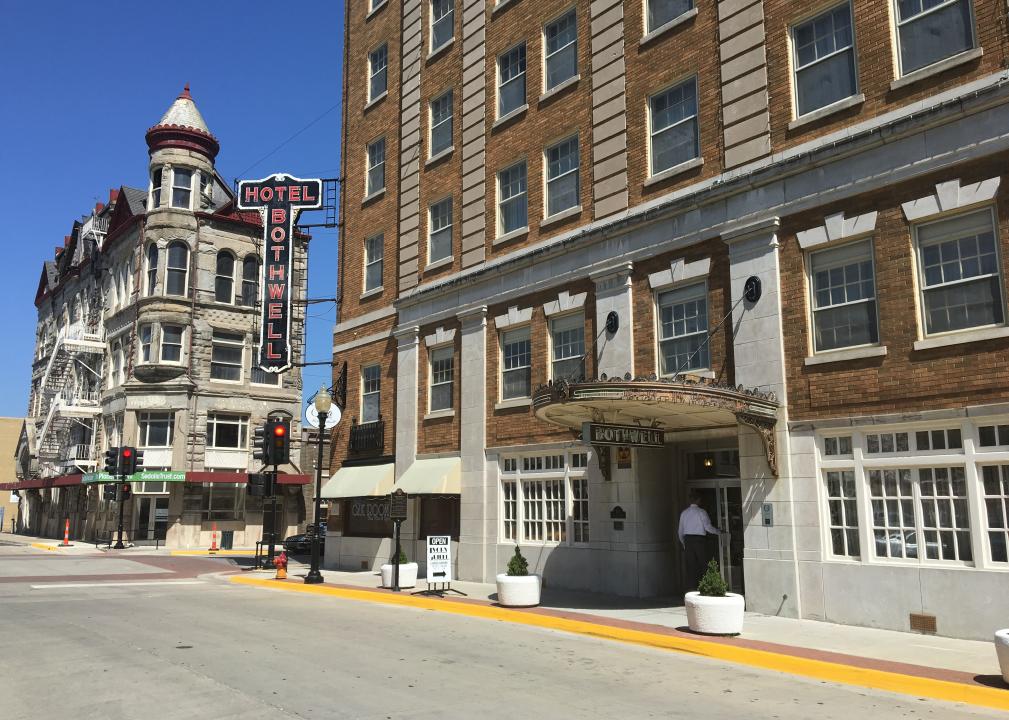
David Wilson // Wikimedia Commons
#21. Pettis County, MO
– Inpatient beds occupied: 82.0% (20.0% by COVID-19 patients)
— 1.2% more full than Missouri overall
– ICU beds occupied: 89.0% (35.0% by COVID-19 patients)
— 6.0% more full than Missouri overall
– Cases per 100k in last 7 days: 279 (118 cases)
– Population that is fully vaccinated: 36.0% (15,229 fully vaccinated)
— 23.7% lower vaccination rate than Missouri
Jon Kraft // Shutterstock
#20. Jackson County, MO
– Inpatient beds occupied: 83.0% (11.0% by COVID-19 patients)
— 2.5% more full than Missouri overall
– ICU beds occupied: 79.0% (27.0% by COVID-19 patients)
— 6.0% more availability than Missouri overall
– Cases per 100k in last 7 days: 277 (1,948 cases)
– Population that is fully vaccinated: 46.2% (324,912 fully vaccinated)
— 2.1% lower vaccination rate than Missouri
Kbh3rd // Wikimedia Commons
#19. Grundy County, MO
– Inpatient beds occupied: 85.0% (0.0% by COVID-19 patients)
— 4.9% more full than Missouri overall
– ICU beds occupied: data not available
— 84% full in Missouri overall
– Cases per 100k in last 7 days: 315 (31 cases)
– Population that is fully vaccinated: 30.3% (2,984 fully vaccinated)
— 35.8% lower vaccination rate than Missouri
Kbh3rd // Wikimedia Commons
#18. Clay County, MO
– Inpatient beds occupied: 86.0% (17.0% by COVID-19 patients)
— 6.2% more full than Missouri overall
– ICU beds occupied: 89.0% (29.0% by COVID-19 patients)
— 6.0% more full than Missouri overall
– Cases per 100k in last 7 days: 110 (274 cases)
– Population that is fully vaccinated: 45.0% (112,500 fully vaccinated)
— 4.7% lower vaccination rate than Missouri
Sean Pavone // Shutterstock
#17. St. Louis city, MO
– Inpatient beds occupied: 86.0% (6.0% by COVID-19 patients)
— 6.2% more full than Missouri overall
– ICU beds occupied: 93.0% (16.0% by COVID-19 patients)
— 10.7% more full than Missouri overall
– Cases per 100k in last 7 days: 113 (340 cases)
– Population that is fully vaccinated: 47.3% (142,045 fully vaccinated)
— 0.2% higher vaccination rate than Missouri
Canva
#16. Jefferson County, MO
– Inpatient beds occupied: 87.0% (14.0% by COVID-19 patients)
— 7.4% more full than Missouri overall
– ICU beds occupied: 84.0% (46.0% by COVID-19 patients)
— 0.0% more availability than Missouri overall
– Cases per 100k in last 7 days: 321 (723 cases)
– Population that is fully vaccinated: 37.3% (84,047 fully vaccinated)
— 21.0% lower vaccination rate than Missouri
Kbh3rd // Wikimedia Commons
#15. St. Louis County, MO
– Inpatient beds occupied: 87.0% (9.0% by COVID-19 patients)
— 7.4% more full than Missouri overall
– ICU beds occupied: 93.0% (27.0% by COVID-19 patients)
— 10.7% more full than Missouri overall
– Cases per 100k in last 7 days: 187 (1,862 cases)
– Population that is fully vaccinated: 53.8% (534,810 fully vaccinated)
— 14.0% higher vaccination rate than Missouri
Lisa Fitzthum Photography // Shutterstock
#14. Camden County, MO
– Inpatient beds occupied: 88.0% (17.0% by COVID-19 patients)
— 8.6% more full than Missouri overall
– ICU beds occupied: 78.0% (43.0% by COVID-19 patients)
— 7.1% more availability than Missouri overall
– Cases per 100k in last 7 days: 244 (113 cases)
– Population that is fully vaccinated: 36.5% (16,911 fully vaccinated)
— 22.7% lower vaccination rate than Missouri
Jacob Boomsma // Shutterstock
#13. Cape Girardeau County, MO
– Inpatient beds occupied: 89.0% (16.0% by COVID-19 patients)
— 9.9% more full than Missouri overall
– ICU beds occupied: 71.0% (38.0% by COVID-19 patients)
— 15.5% more availability than Missouri overall
– Cases per 100k in last 7 days: 365 (288 cases)
– Population that is fully vaccinated: 40.8% (32,179 fully vaccinated)
— 13.6% lower vaccination rate than Missouri
Photos BrianScantlebury // Shutterstock
#12. Marion County, MO
– Inpatient beds occupied: 89.0% (12.0% by COVID-19 patients)
— 9.9% more full than Missouri overall
– ICU beds occupied: 93.0% (24.0% by COVID-19 patients)
— 10.7% more full than Missouri overall
– Cases per 100k in last 7 days: 224 (64 cases)
– Population that is fully vaccinated: 37.0% (10,544 fully vaccinated)
— 21.6% lower vaccination rate than Missouri
Americasroof // Wikimedia Commons
#11. Saline County, MO
– Inpatient beds occupied: 93.0% (10.0% by COVID-19 patients)
— 14.8% more full than Missouri overall
– ICU beds occupied: 69.0% (10.0% by COVID-19 patients)
— 17.9% more availability than Missouri overall
– Cases per 100k in last 7 days: 510 (116 cases)
– Population that is fully vaccinated: 40.3% (9,183 fully vaccinated)
— 14.6% lower vaccination rate than Missouri
Kbh3rd // Wikimedia Commons
#10. Crawford County, MO
– Inpatient beds occupied: 93.0% (26.0% by COVID-19 patients)
— 14.8% more full than Missouri overall
– ICU beds occupied: 69.0% (50.0% by COVID-19 patients)
— 17.9% more availability than Missouri overall
– Cases per 100k in last 7 days: 301 (72 cases)
– Population that is fully vaccinated: 28.2% (6,742 fully vaccinated)
— 40.3% lower vaccination rate than Missouri
Rob Neville Photos // Shutterstock
#9. St. Charles County, MO
– Inpatient beds occupied: 93.0% (15.0% by COVID-19 patients)
— 14.8% more full than Missouri overall
– ICU beds occupied: 83.0% (38.0% by COVID-19 patients)
— 1.2% more availability than Missouri overall
– Cases per 100k in last 7 days: 189 (758 cases)
– Population that is fully vaccinated: 52.8% (212,219 fully vaccinated)
— 11.9% higher vaccination rate than Missouri
Lilith Munck // Shutterstock
#8. Taney County, MO
– Inpatient beds occupied: 93.0% (10.0% by COVID-19 patients)
— 14.8% more full than Missouri overall
– ICU beds occupied: 87.0% (48.0% by COVID-19 patients)
— 3.6% more full than Missouri overall
– Cases per 100k in last 7 days: 175 (98 cases)
– Population that is fully vaccinated: 35.0% (19,591 fully vaccinated)
— 25.8% lower vaccination rate than Missouri
Skye Marthaler // Wikimedia Commons
#7. Butler County, MO
– Inpatient beds occupied: 93.0% (18.0% by COVID-19 patients)
— 14.8% more full than Missouri overall
– ICU beds occupied: 98.0% (57.0% by COVID-19 patients)
— 16.7% more full than Missouri overall
– Cases per 100k in last 7 days: 478 (203 cases)
– Population that is fully vaccinated: 28.6% (12,162 fully vaccinated)
— 39.4% lower vaccination rate than Missouri
Kbh3rd // Wikimedia Commons
#6. Iron County, MO
– Inpatient beds occupied: 93.0% (44.0% by COVID-19 patients)
— 14.8% more full than Missouri overall
– ICU beds occupied: data not available
— 84% full in Missouri overall
– Cases per 100k in last 7 days: 425 (43 cases)
– Population that is fully vaccinated: 32.0% (3,237 fully vaccinated)
— 32.2% lower vaccination rate than Missouri
Kbh3rd // Wikimedia Commons
#5. Phelps County, MO
– Inpatient beds occupied: 94.0% (21.0% by COVID-19 patients)
— 16.0% more full than Missouri overall
– ICU beds occupied: 87.0% (21.0% by COVID-19 patients)
— 3.6% more full than Missouri overall
– Cases per 100k in last 7 days: 197 (88 cases)
– Population that is fully vaccinated: 37.8% (16,827 fully vaccinated)
— 19.9% lower vaccination rate than Missouri
w:User:Malepheasant // Wikimedia Commons
#4. Buchanan County, MO
– Inpatient beds occupied: 97.0% (14.0% by COVID-19 patients)
— 19.8% more full than Missouri overall
– ICU beds occupied: 73.0% (20.0% by COVID-19 patients)
— 13.1% more availability than Missouri overall
– Cases per 100k in last 7 days: 182 (159 cases)
– Population that is fully vaccinated: 32.3% (28,184 fully vaccinated)
— 31.6% lower vaccination rate than Missouri
TommyBrison // Shutterstock
#3. Platte County, MO
– Inpatient beds occupied: 100.0% (14.0% by COVID-19 patients)
— 23.5% more full than Missouri overall
– ICU beds occupied: 100.0% (15.0% by COVID-19 patients)
— 19.0% more full than Missouri overall
– Cases per 100k in last 7 days: 79 (83 cases)
– Population that is fully vaccinated: 47.0% (49,081 fully vaccinated)
— 0.4% lower vaccination rate than Missouri
Art davis // Wikimedia Commons
#2. Vernon County, MO
– Inpatient beds occupied: 100.0% (6.0% by COVID-19 patients)
— 23.5% more full than Missouri overall
– ICU beds occupied: 100.0% (.0% by COVID-19 patients)
— 19.0% more full than Missouri overall
– Cases per 100k in last 7 days: 146 (30 cases)
– Population that is fully vaccinated: 30.1% (6,198 fully vaccinated)
— 36.2% lower vaccination rate than Missouri
Kbh3rd // Wikimedia Commons
#1. Newton County, MO
– Inpatient beds occupied: 100.0% (39.0% by COVID-19 patients)
— 23.5% more full than Missouri overall
– ICU beds occupied: data not available
— 84% full in Missouri overall
– Cases per 100k in last 7 days: 108 (63 cases)
– Population that is fully vaccinated: 22.0% (12,790 fully vaccinated)
— 53.4% lower vaccination rate than Missouri