XRP/USD Daily Chart. Source: TradingView.
Key Support Levels: $0.95, $0.876, $0.8282.
Key Resistance Levels: $1.05, $1.15, $1.25.
XRP fell beneath the $1.05 floor on Monday and ended up below $1, and the 200-day MA until support was found at $0.875 (.618 Fib). This level was further bolstered by the 100-day MA level, which allowed XRP to rebound.
After this, XRP went on to break the 200-day MA at $0.85 and spike back above $1. Unfortunately, the bulls have still not managed to gain ground above $1.00 so far.
Looking ahead, the first resistance lies at $1.05. This is followed by $1.10 (50-day MA & 20-day MA), $1.15, and $1.25 (Feb 2018 Highs).
On the other side, the first support lies at $0.95 (200-day MA). This is followed by $0.876 (.618 Fib & 100-day MA), $0.8282 (2020 highs), and $0.8 (downside 1.272 Fib Extension).
The RSI has been beneath the midline for the majority of September as the selling momentum continues to take hold.
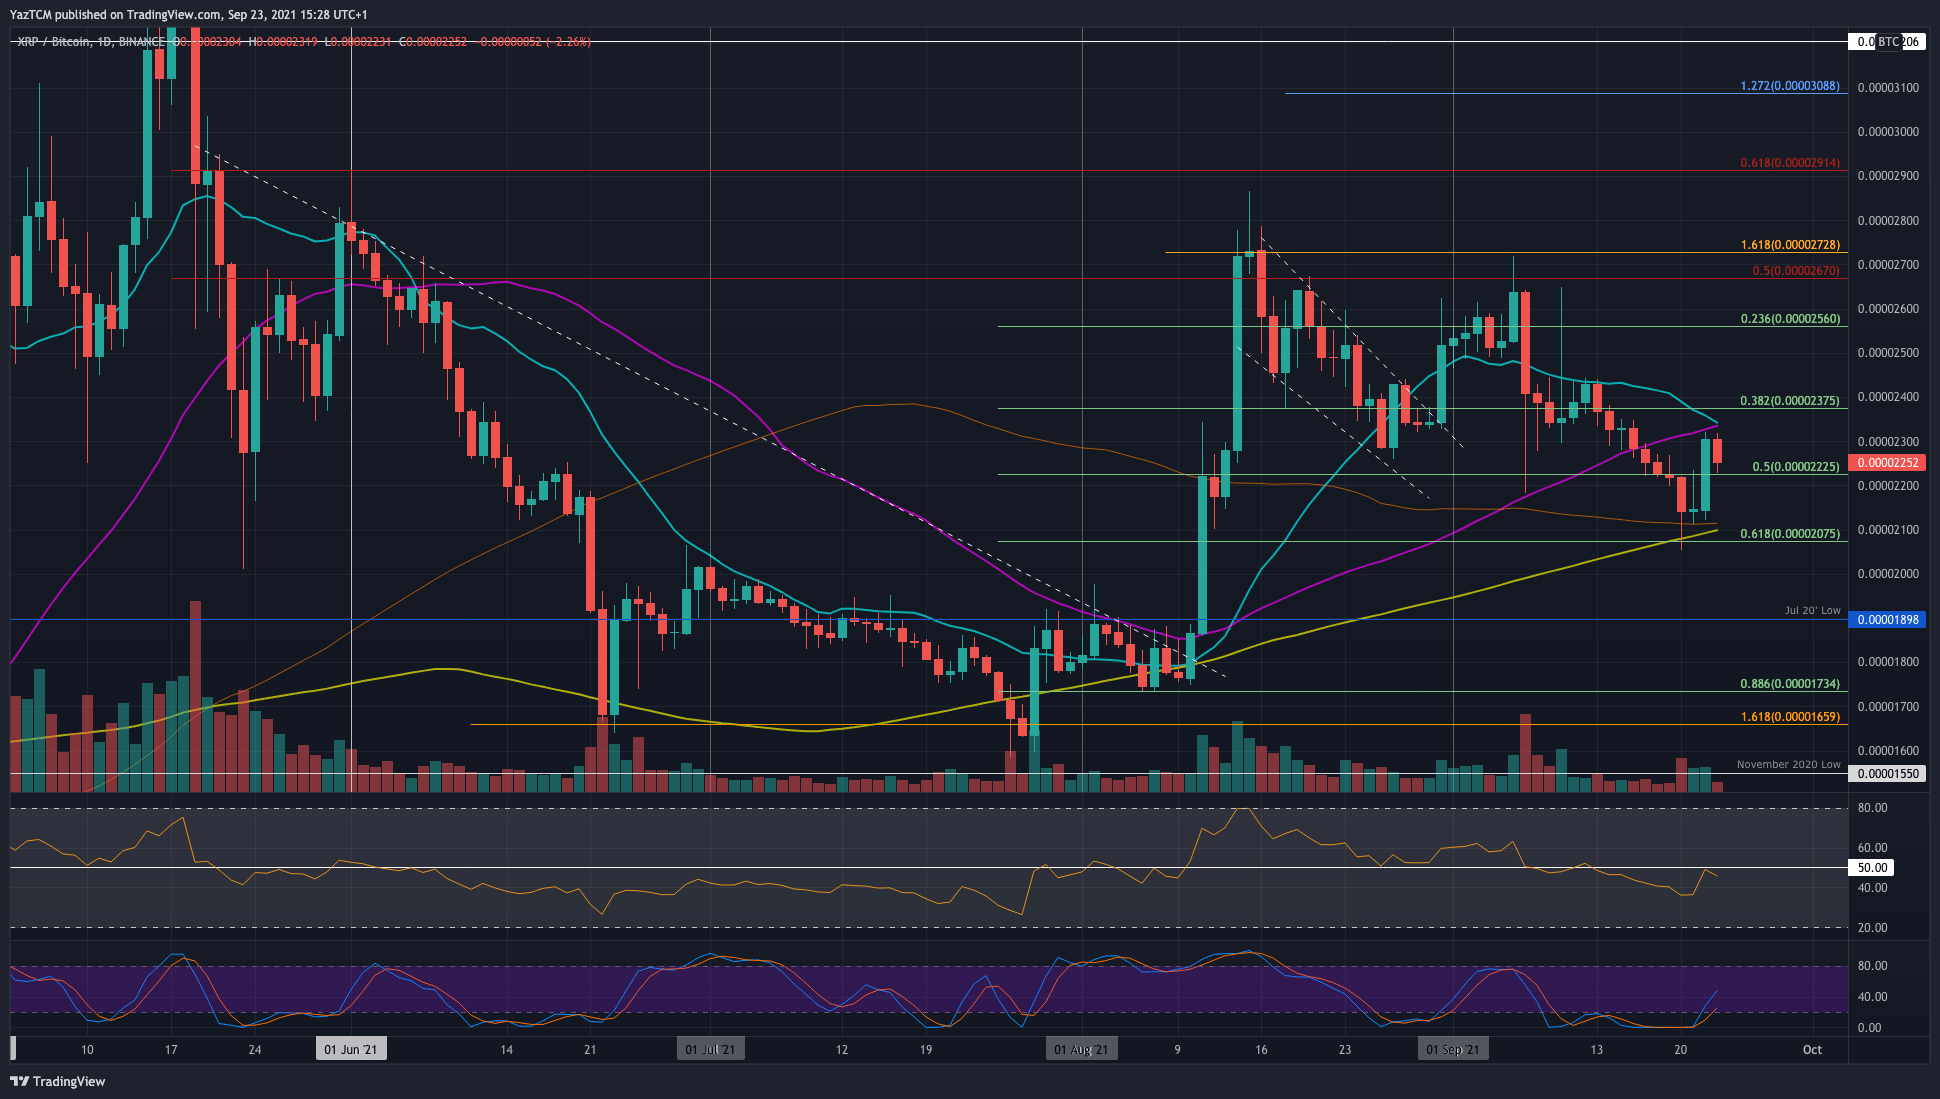
Key Support Levels: 2225 SAT, 2100 SAT, 2075 SAT.
Key Resistance Levels: 2350 SAT, 2400 SAT, 2500 SAT.
XRP is also in a rebound against BTC itself. The cryptocurrency fell beneath 2225 SAT (.5 Fib) on Monday and collapsed as low as 2050 SAT. Luckily, the bulls regrouped above 2150 SAT by the end of the day and managed to use the 100-day MA support at 2100 SAT as support on Tuesday and Wednesday.
Yesterday, XRP bounced from the 100-day MA and surged back above 2200 SAT to reach as high as 2300 SAT. It has since dropped to 2250 SAT today.
Looking ahead, the first resistance lies at 2350 SAT (50-day MA & 20-day MA). This is followed by 2400 SAT, 2500 SAT, and 2670 SAT.
On the other side, the first support lies at 2225 SAT (.5 Fib). This is followed by 2100 SAT (100-day MA & 200-day MA), 2075 SAT (.618 Fib), and 2000 SAT.
Again, the RSI is beneath the midline here, indicating that the sellers remain in control of the market momentum.