Bitcoin
Will Bitcoin’s September blues give way to October highs
By and large, the crypto market has been inert since 7 September. However, the space did witness some dramatic action yesterday, thanks to the Litecoin-Walmart FUD.
Bitcoin’s price too, for that matter, did not witness any major deviation of late. It remained range-bound in the $43k-$47k region for a week now. However, as seen in the TradingView chart below, BTC managed to test, both, its support and resistance target, with the same candle on 13 September.
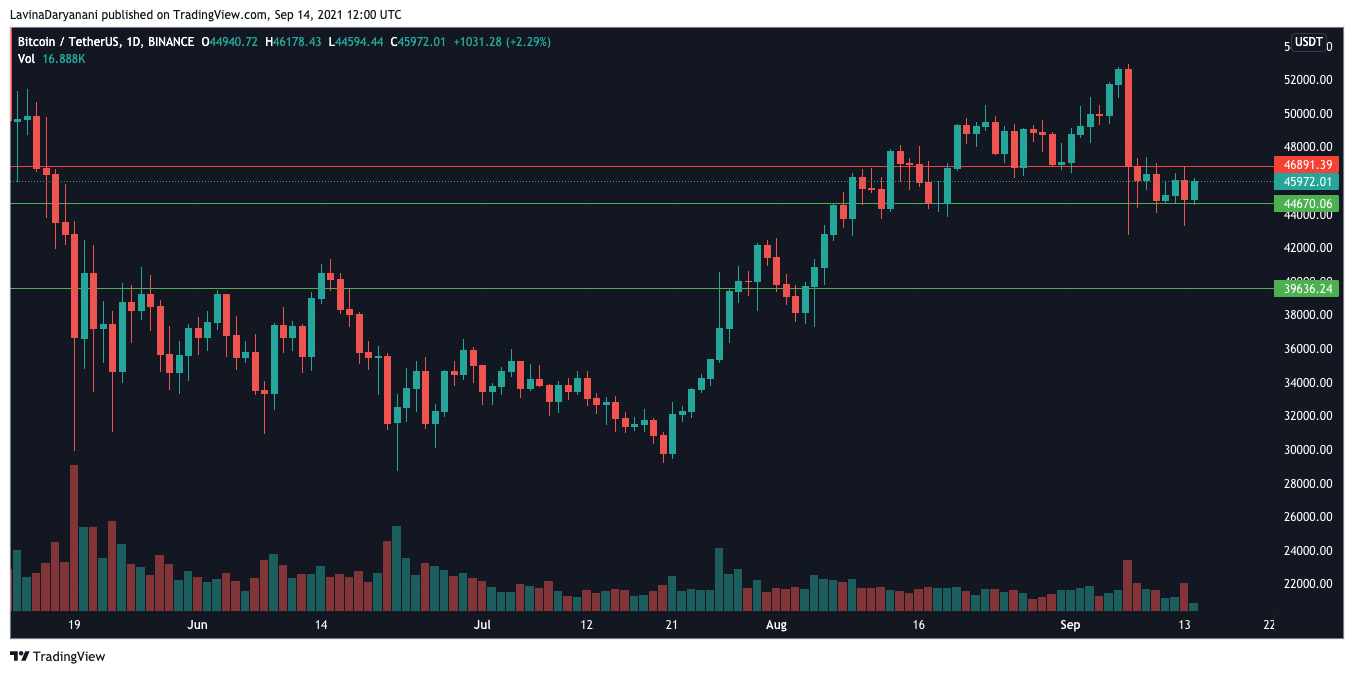
BTC/USDT || Source: TradingView
The volatility was evidently drying away from the market. For the same to increase, Bitcoin needs to break above its current range of $46.8k. Given the insufficient buying-pressure, the odds of Bitcoin jumping above the aforementioned level, seemed to be fairy low at the time of writing.
Having said that, if Bitcoin’s price breaks below $44k, the chances of it re-visiting the $39k region would eventually intensify. The current monotonous phase might end up prolonging itself a little longer.
So, is the consolidation here to stay?
Given the dwindling state of the market, fear is evidently implanted in the minds of market participants. The F&G index’s press time reading [30] supported the aforementioned claim.
Further, crowd FUD associated with Bitcoin has just hit historically low levels. According to Santiment’s algorithm that measures the commentary volume, the weighted social sentiment has never fallen as low as its current level for more than 4 years.

Source: Santiment
Based on precedents, severe negativity, more often than not, led to inevitable price bounces after weak hands dropped out. Interestingly, as per Glassnode’s recent data, newer coins had started exiting the market.
Coins younger than 3-months reached an all-time low of 15.9% of the circulating supply. Young coins reaching a minima, usually signifies the last stage of bear markets. Keeping the current state of the market in mind, it can be asserted that this ‘”last phase” might extend itself until the end of this month.
Further, the revived supply also pointed out a similar trend. High levels of revived supply usually implies a negative shift in investor confidence, while lower values indicate HODLer conviction.
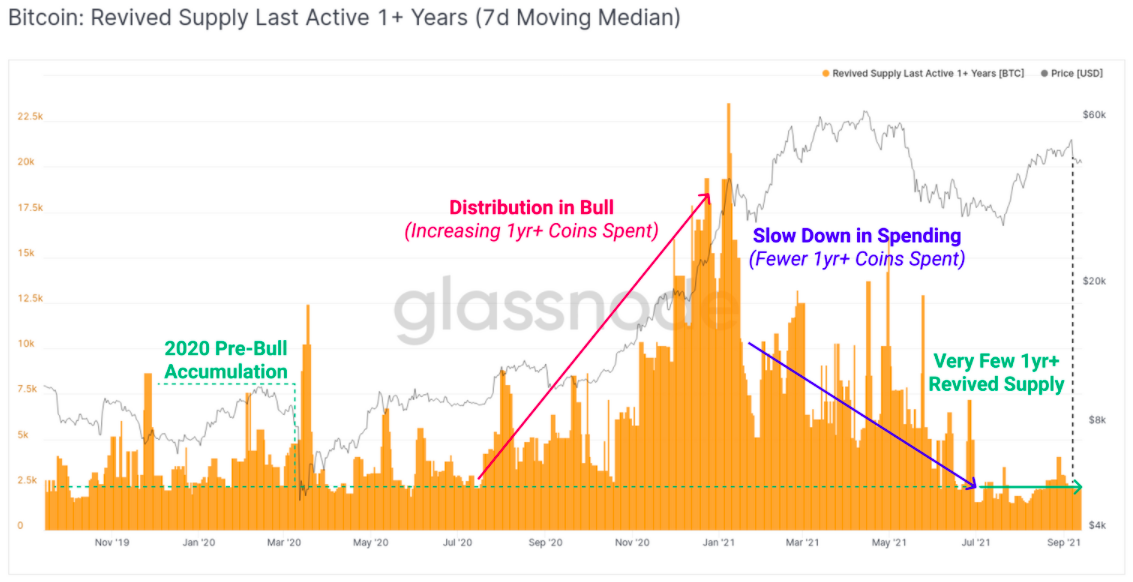
Source: Glassnode
As seen from the chart above, the 1 year+ revived supply fell to remarkably low levels. The same was seen attempting to coincide with what was observed during 2020’s pre-bull run phase. It should typically take a few more days for the same, to exactly match those levels and until then, the consolidation is here to stay. At the end of the day, September has always been an unfavorable month for Bitcoin.