New Jersey Future Blog
Census 2020: New Jersey’s Older and Increasingly Diverse Centers Are Now Leading The State’s Population Growth
September 13th, 2021 by Tim Evans
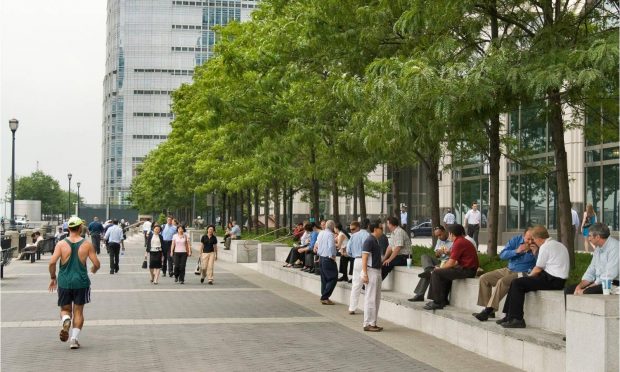
The demographic story of the 2010s in New Jersey was the return of population growth to the state’s walkable, mixed-use centers—cities, towns, and older suburbs with traditional downtowns. Driven in particular by the Millennial generation’s desire for live-work-shop-play environments in which a car is not necessarily needed for every trip, many of the state’s older centers experienced their biggest population increases since before the 1950s.
Newark, the state’s largest city, grew more than twice as fast as the rest of the state this decade, growing by 12.4% between 2010 and 2020 compared to 5.7% for the state as a whole. This is the first time in many decades that Newark has outpaced the statewide growth rate, and 2020 also marks the first time since 1985 that New Jersey has had a city with a population of more than 300,000. Newark’s population dipped below 300,000 in 1986 and continued to decline to a low of 262,862 in 1998 before reversing its slide.
Jersey City, the state’s second-largest city, has been perhaps the most visible star in New Jersey’s urban revival. Its resurgence actually predates the national trend by several decades (Jersey City’s population decreased in the 1950s, 60s, and 70s, but began growing again in the 80s). It grew slowly at first, lagging behind the statewide rate until 2010, but between 2010 and 2020 it grew at more than three times the statewide growth rate (18.1% vs. 5.7%). Like Newark, Jersey City once had more than 300,000 residents, but dropped below that mark in 1950, eventually falling to a low of 220,857 in 1979. But having added almost 45,000 people in the 2010s, its population now stands at 292,449 and is poised to once again surpass 300,000 in the coming decade if its 2020s growth looks anything like its 2010s growth.
The growth of traditional centers is not limited to the state’s biggest cities, however. The 124 New Jersey municipalities that best embody the concept of walkable urbanism and score high on all three New Jersey Future smart growth metrics—high activity densities (people + jobs per square mile), mixed-use downtowns, and well-connected, walkable street grids—together grew by more than 1.5 times the statewide growth rate, accounting for more than half (57.5%) of the statewide population increase in the 2010s, compared to only 13.6% of total growth in the 2000s. Most of these cities, smaller towns, and walkable, first-generation suburbs experienced their peak growth many decades ago. In fact, many of them actually lost population at some point since the 50s.
In contrast, the 158 municipalities with the most car-dependent development patterns—characterized by low densities, single-use subdivisions, and branching street networks that require circuitous car trips—grew by only half the statewide rate in the 2010s (2.8% vs. 5.7% statewide). This is a dramatic change from previous decades; this same group of municipalities grew by 7.1% between 2000 and 2010 and accounted for more than one-third (35.9%) of statewide population growth that decade after comprising 37.8% of the statewide increase in the 90s and 63.8% in the 80s. Younger generations’ preference for in-town living has substantially curbed demand for new subdivisions at the exurban fringe.
The state’s older centers also significantly contribute to New Jersey’s status as one of the most racially diverse states in the country. Much of the media coverage of the release of 2020 Census county and municipal populations focused on increasing diversity, both at the state and local levels. In New Jersey, it’s in the compact, walkable centers where the state’s diversity is most evident. Using a concept called the diversity index, which the Census Bureau uses to show “the probability that two people chosen at random will be from different race and ethnic groups”1 (the higher the score, the more diverse the community), New Jersey’s overall diversity index was 65.7% in 2020, up from 59.3% in 2010. Of the state’s 565 municipalities, 215 have a diversity index greater than 50%, and of these 215, 93 are among the 124 municipalities referenced above that score well on all three New Jersey Future smart growth metrics. Thus, among the municipalities with the most center-like development patterns, 75% (93 out of 124) have a diversity index of 50% or more. In contrast, among the 158 most sprawling, car-dependent municipalities that do not score well on any of the three metrics, only 22.8% (36 out of 158) exceed 50% on the diversity index. (The other two groups of municipalities—those scoring well on either one or two of the metrics—follow the same pattern, in which a greater number of high scores on smart growth metrics is associated with a higher likelihood of having a diversity index of 50% or more.)
New growth in older centers is happening, in part, thanks to the rise of redevelopment—the reuse of land that had previously been developed for some other purpose—as New Jersey’s default development pattern. The 270 New Jersey municipalities that were at least 90% built-out as of 2007 together accounted for nearly two-thirds (65.1%) of the state’s population increase in the 2010s, after having contributed just 12.2% of the statewide increase in the 2000s. That the state’s population growth is now dominated by redevelopment areas represents a remarkable shift compared to the several preceding decades, which were characterized by low-density growth on the suburban fringe. The trend toward redevelopment illustrates that “built-out” does not mean “full,” and that there are plenty of opportunities to absorb new residents in the state’s cities, towns, and older suburbs.
Creating new opportunities for growth in these older centers is key to attracting and retaining members of younger generations who are looking for an in-town lifestyle. New Jersey should focus on reforming local zoning to allow more of the kinds of housing younger households are looking for (e.g., townhouses, duplexes, small apartment buildings, apartments above stores, smaller single-family homes on small lots) in the kinds of places they want to live. Encouraging growth in already-developed areas has the added benefit of using our transportation and energy infrastructure more efficiently and avoiding the building of new sprawling infrastructure and then having to maintain it. The move to redevelopment also takes pressure off the state’s remaining open lands, helping to preserve the state’s overall quality of life by allowing those lands to continue being used for agriculture, recreation, and wildlife habitats.
1The diversity index is dependent on the number of different mutually-exclusive race categories that are used in the analysis. The Census Bureau uses eight categories in its analysis. New Jersey Future’s analysis condenses these to five—non-Hispanic white, non-Hispanic Black, Hispanic, non-Hispanic Asian, and other—by grouping four of the Census Bureau’s categories into the “other” group, because their numbers are individually very small in New Jersey. Using five categories, the index has a maximum value of 0.8, or 80%.
Related Posts
 July 20, 2023 With Recession in the Forecast, How Prepared is NJ’s Economy for Upcoming Rain?
 October 13, 2021 Hispanic Heritage Month and the Growth of New Jersey’s Latinx Population
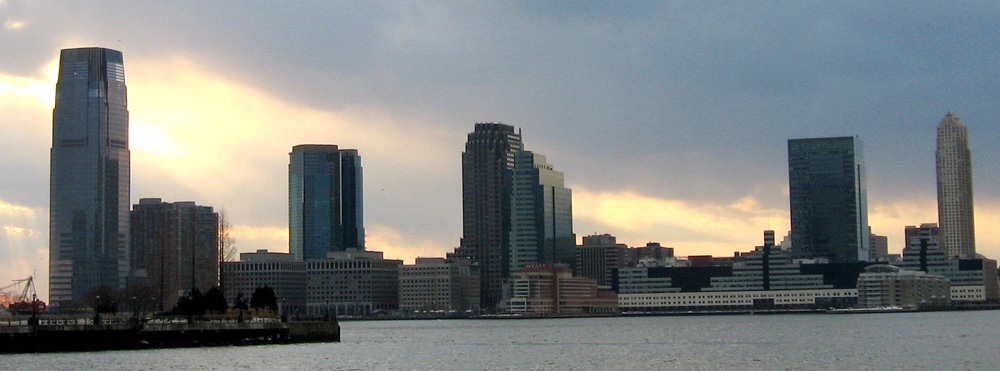 March 3, 2011 Is Jersey City a Suburb? Joel Kotkin Thinks So.
 April 28, 2010 By the Numbers: County Population Estimates Defy Earlier Trends
 January 29, 2024 New Report Digs Deeper into Diversity in Morris and Monmouth Counties
Tags: Census, cities, Demographics, Population, population increases


