
/cdn.vox-cdn.com/uploads/chorus_image/image/69821122/1234918362.0.jpg)
I’ve chosen to look at three games for this which all resulted in a 1-0 Sunderland victory - the best place to find out what has changed about Sunderland is by viewing the Average Location, and passes in possession.
Game Data
Phil Parkinson: v Crewe, 2020/21
:format(webp):no_upscale()/cdn.vox-cdn.com/uploads/chorus_asset/file/22828001/PP.PNG)
Starting with Phil Parkinson, we played a 3-5-1-1 this game.
Now looking at this visual, you could guess almost anything for the formation based on the location of the players.
Denver Hume (33) and Lynden Gooch (11) are the wing-backs but also two of our highest placed players according to the game data. What this looks like is organised chaos - there is no real structure to the team in defence or midfield.
Lee Johnson: v Swindon, 2020/21
:format(webp):no_upscale()/cdn.vox-cdn.com/uploads/chorus_asset/file/22828003/LJ.PNG)
Lee Johnson arrives and we move onto Swindon from the 20/21 season. This is the start of where Sunderland begin to show some form of structural and tactical shape.
A typically organised and structured team should form a V or U shape in the defence whilst in possession. We can see this with Sunderland, McFadzean (25), O’Nien (13), Sanderson (16) and Power (6) make up the back four with Burge in goal.
If you look closely, we can see that structure in place. O’Nien is slightly higher than Sanderson but that is likely due to O’Nien playing out of position.
Lee Johnson: v Wimbledon, 2021/22
:format(webp):no_upscale()/cdn.vox-cdn.com/uploads/chorus_asset/file/22828004/LJ1.PNG)
We skip to Sunderland 1-0 Wimbledon from August, where we can see the evolution of the team. We can see that V shape once again in the defence, this is critical as it allows players to pass with an angle as well.
The critical change between last season and this season is the central midfielders.
:format(webp):no_upscale()/cdn.vox-cdn.com/uploads/chorus_asset/file/22828018/PlayingStyle.PNG)
If I show you a comparison from all three put together, this may help you see what changed from Parkinson to Johnson.
In the first two, Sunderland have no real central midfield structure.
This changes though for this season, as O’Nien now playing in his natural central position alongside Embleton (8) fills that gap in the centre of the park, but most importantly, allows them access to move the football with more efficiency.
This will likely change our passing stats as we no longer need to make five passes to open space - the positioning of our two central midfielders should cut out the pointless passing.
Performance Data
I am comparing data from seasons since we fell into League One, rather than individual matches for this section. Unfortunately, there isn’t much data from the 18/19 season, but we are going to cover it where possible.
2019/20 Season
:format(webp):no_upscale()/cdn.vox-cdn.com/uploads/chorus_asset/file/22828005/1920Percentile.PNG)
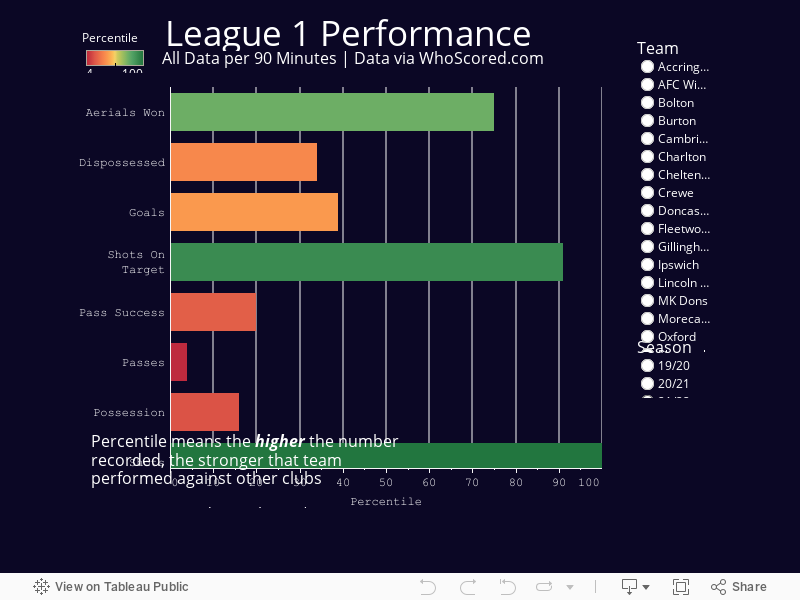
As stated along the bottom of the visual, the higher the metric (up to 100), the better Sunderland performed compared to League One clubs.
Think of it like playing Top Trumps - higher scores are better.
The 19/20 season was a disaster for many reasons, and the data is no exception. The passing stats are the only standout on the data here, but the majority of our data shows how bad we played during that campaign.
2020/21 Season
:format(webp):no_upscale()/cdn.vox-cdn.com/uploads/chorus_asset/file/22828008/2021Percentile.PNG)
However, the 2020/21 season shows an excellent set of results with our data.
I started following the data side mid-season and based on what we can see, Sunderland should have been promoted. Poor game management cost us the most.
2021/22 Season
:format(webp):no_upscale()/cdn.vox-cdn.com/uploads/chorus_asset/file/22828009/2122Percentile.PNG)
So far in the 2021/22 season, our stats look worse. The playing style has changed away from being possession-based, and this reflects in what we can see. The previous two visuals show Sunderland to be a strong team with passing, but so far this season that hasn’t been the case.
However, we have only played five league matches, and until we have played around 15 games (33% of the season) the likelihood of these numbers moving around is high - so, I’ll re-visit this later in the season.
If you’d like, you can view any team from League One since the start of the 2019/20 season below by using the team and season filters. I do recommend that you click full screen in the bottom right-hand corner.
xG Comparison
:format(webp):no_upscale()/cdn.vox-cdn.com/uploads/chorus_asset/file/22828012/Capture.PNG)
xG can be a contentious stat and I don’t always trust it, but it can show if you under or overperform in matches.
Net xG is when you subtract opposition xG against your own - and above, we can see how badly we performed in that regard during the 2018/19 and 2019/20 seasons.
Most of the data I can see on the 2018/19 campaign under Jack Ross doesn’t look great, and suggests we overperformed early in the season.
This season however has been good so far - we started well via xG last season as well, but that tailed off as the campaign progressed.
We are only five games in, but all the data is trending in the right direction. Sunderland have a clear plan, and looking at the shape of the team from Parkinson to Johnson I can only see progress at this stage. We’ll revisit some of these stats later in the season, but the most important thing for Sunderland is that we are playing good, and are top of the league.
Long may it continue!
Loading comments...