Editor’s Note: CNN weather is launching a weekly column, publishing Mondays with the weather news you should be aware of and the week’s hurricane outlook. Find updates each week here.
A familiar graphic may be misleading residents in a storm’s path into thinking they are safe from a hurricane’s impacts, according to new research from Colorado State University.
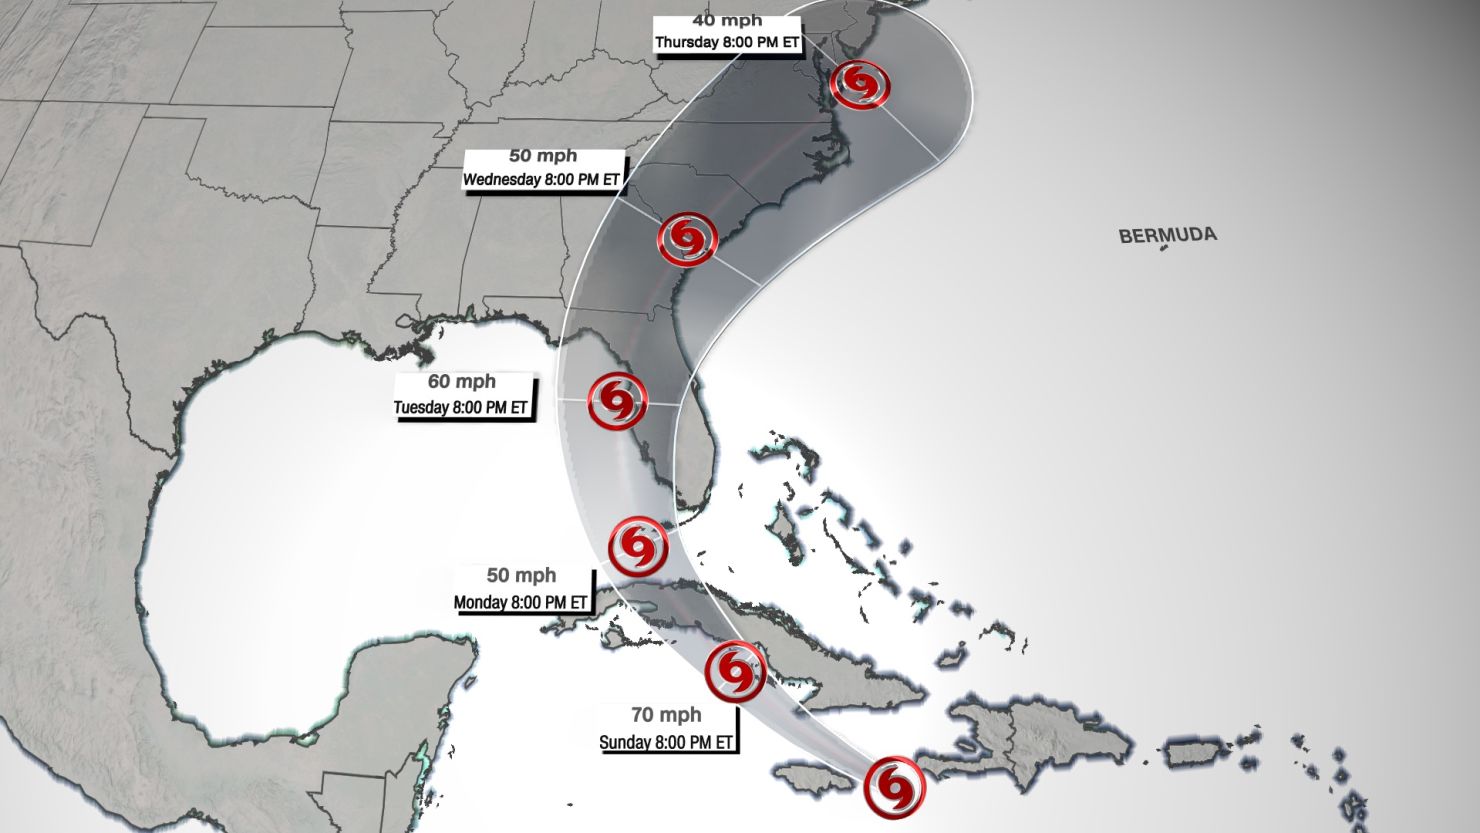
The graphic is the track of the hurricane issued by the National Hurricane Center, but even more specifically the track forecast cone – colloquially known as the “cone of uncertainty.”
keep scrolling this week's weather column to...
The cone represents the probable track of the center of a tropical system and extends up to five days in 12-hour increments, according to the hurricane center.
Even though the center of a storm remains within the cone 60% to 70% of the time, according to data from the hurricane center over the last five years, the effects of tropical storms and hurricanes often extend much farther than this defined boundary.
Now, researchers at Colorado State University (CSU) may have come up with a better way to inform the public about hurricanes to help keep them safe.
The problem stems from how people perceive the boundaries of the track forecast cone.
In general, people perceive areas that are highlighted within the cone as “at risk” and areas that are outside of the cone as being “safe.” Researchers refer to this perceived notion as the “containment effect.”
Enter the new tool designed by researchers at CSU. It is a series of moving dots, called “zoomies,” rather than a static image of a cone, and it seems to be more effective.
Read more about this innovative solution here.
Hurricane outlook
It has been three and a half weeks since the last advisory was issued for a tropical system in the Atlantic – July 9 for Hurricane Elsa.
However, the season remains well ahead of pace, reaching five named storms earlier than any previous season on record. Elsa was named on July 1. On average, the fifth named storm of the season doesn’t typically form until the end of August. The previous record was set last year when Tropical Storm Edouard formed on July 6, 2020.
In recent weeks, the tropical Atlantic has been relatively quiet, in large part due to dry air and dust from the Saharan desert limiting storm development. It is important to note though that the month of July is one of the least active months of hurricane season.
So, we typically expect this slow spell. Now we approach the season within the season. The majority of storms are seen from mid-August to mid-October.
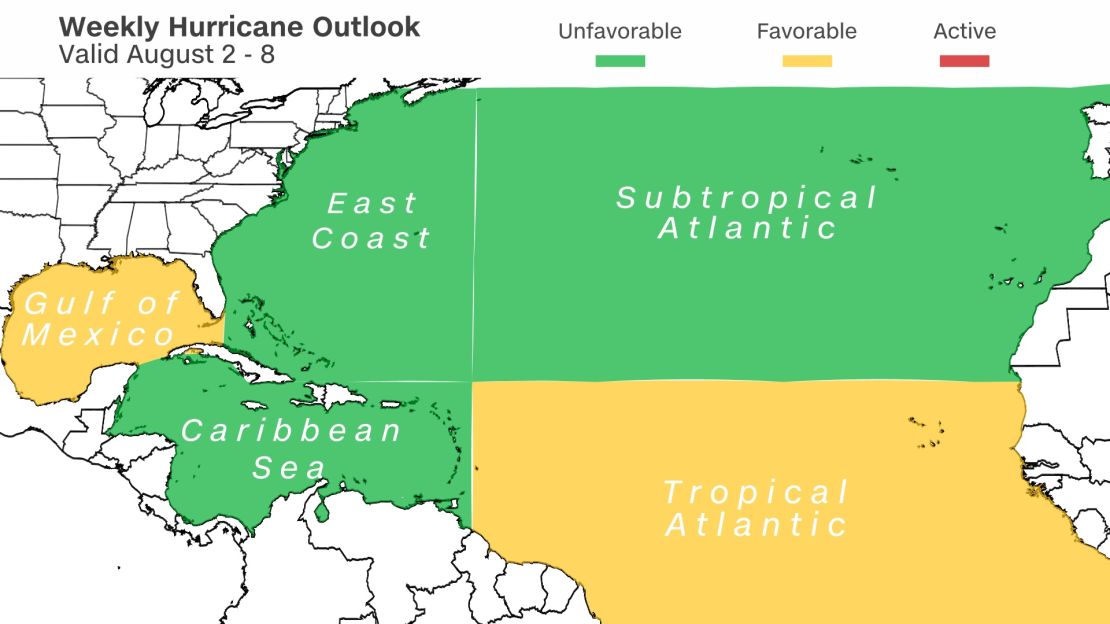
This week, even though sea surface temperatures are warm enough for tropical development across the tropical Atlantic and Gulf of Mexico, dry air and vertical wind shear – the changing of wind speed and direction with height – continue to suppress any new systems emerging.
Still, expert forecasters expect this season to be an above-average season. Just give it a couple more weeks and storms will likely start swirling.
Seen from Space
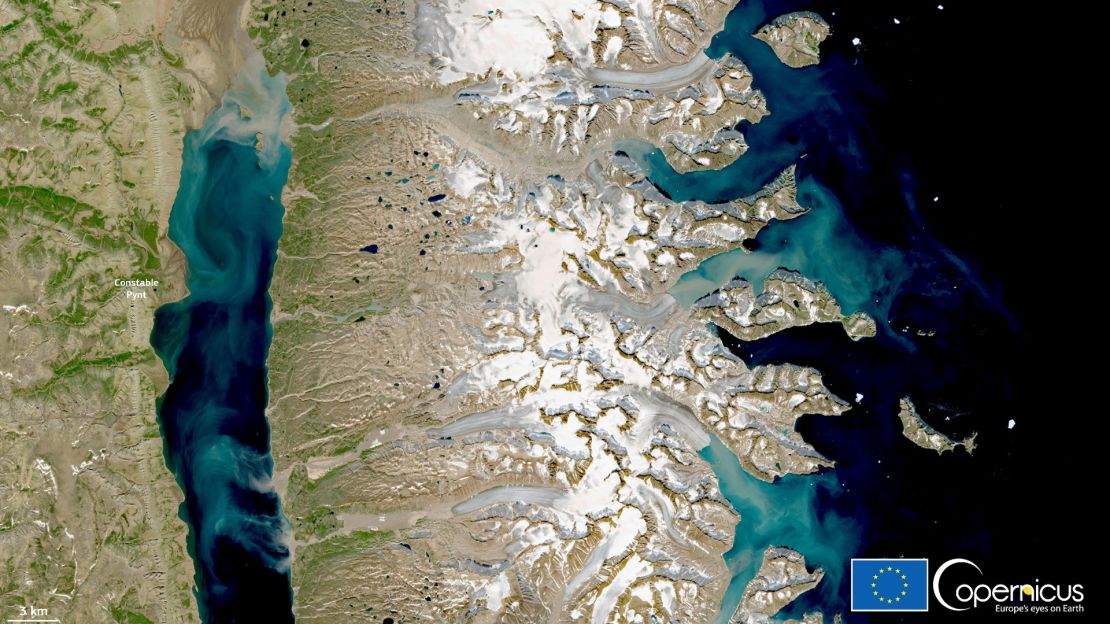
This image shows a substantial discharge of sediment into the Arctic Ocean taken from the Copernicus Sentinel-2 satellite last week. The release comes from glaciers melting due to unusually hot temperatures near Constable Pynt, which is on the east coast of Greenland.
The amount of ice that melted last Tuesday alone would be enough to cover the entire state of Florida in two inches of water.
Read more about how climate change is impacting Greenland’s ice sheet here.
West drought update
The highest drought levels worsened and expanded across California and the Pacific Northwest last week as wildfires continue to plague the region.
Exceptional drought – the worst level of drought – covers nearly 50% of California and the population within the worst drought category is now nearly 14.5 million people. Washington and Oregon continue to see record levels of exceptional drought across both states.
Across the Southwest, however, robust monsoon rainfall made a dent in the drought conditions, improving classifications across several states.
“In Arizona, Tucson received more rain in 6 days than during all of 2020, when annual precipitation of 4.17 inches was the lowest on record,” according to the summary. In addition to Arizona, improvement was noted in New Mexico, southwestern Colorado and southern portions of Utah and Nevada.
Over the weekend, another monsoon rain event brought even more rain, not only to the Southwest but as far north as Washington state. The impact of this weekend’s rain event will be factored into this week’s drought update on Thursday.
Weather number of the week
83
The total number of flash flood warnings issued by the National Weather Service (NWS) office in Tucson, Arizona. That is significantly ahead of pace compared to previous years. The 20-year average is 30 warnings.
The monsoon rains for Arizona have been able to put a big dent in the state’s drought levels over the past week. Tucson picked up over 8 inches of rain in July, nearly four times the city’s normal rainfall for the month.
This year’s monsoon lightning has already exceeded all of 2019’s and doubled all of last year’s cloud to ground strikes, according to the NWS in Phoenix. By this metric, it is the most active monsoon start since 2014.
Weather in focus

A large sandstorm wreaked havoc in Dunhuang City in northwestern China on July 25. The sandstorm created a wall as high as 100 meters (328 feet), engulfing an expressway and reducing visibility to less than 5 meters (16 feet). Local police imposed traffic controls on the city’s expressway as visibility reduced to less than five meters.
Olympics contends with sultry heat in Tokyo
Since the start of the Olympic Games, the temperatures across Tokyo have not only been hot, but very humid as well. Some have called the heat “the worst in the history of the Olympics’.’”
High temperatures over the weekend climbed into the 90s but the heat indices climbed well into the triple digits, reaching at least 106 degrees Fahrenheit on Sunday. These “feels like temperatures” have caused over two dozen people to suffer from heat-related illness.
With one more week left before the closing ceremony, temperatures will remain hot and humid with high temperatures climbing as high as 95 degrees and afternoon ‘feels like temperatures’ climbing into the triple digits.
Get the latest on the Tokyo Olympics here.
CNN’s Brandon Miller and Hannah Gard contributed to this story