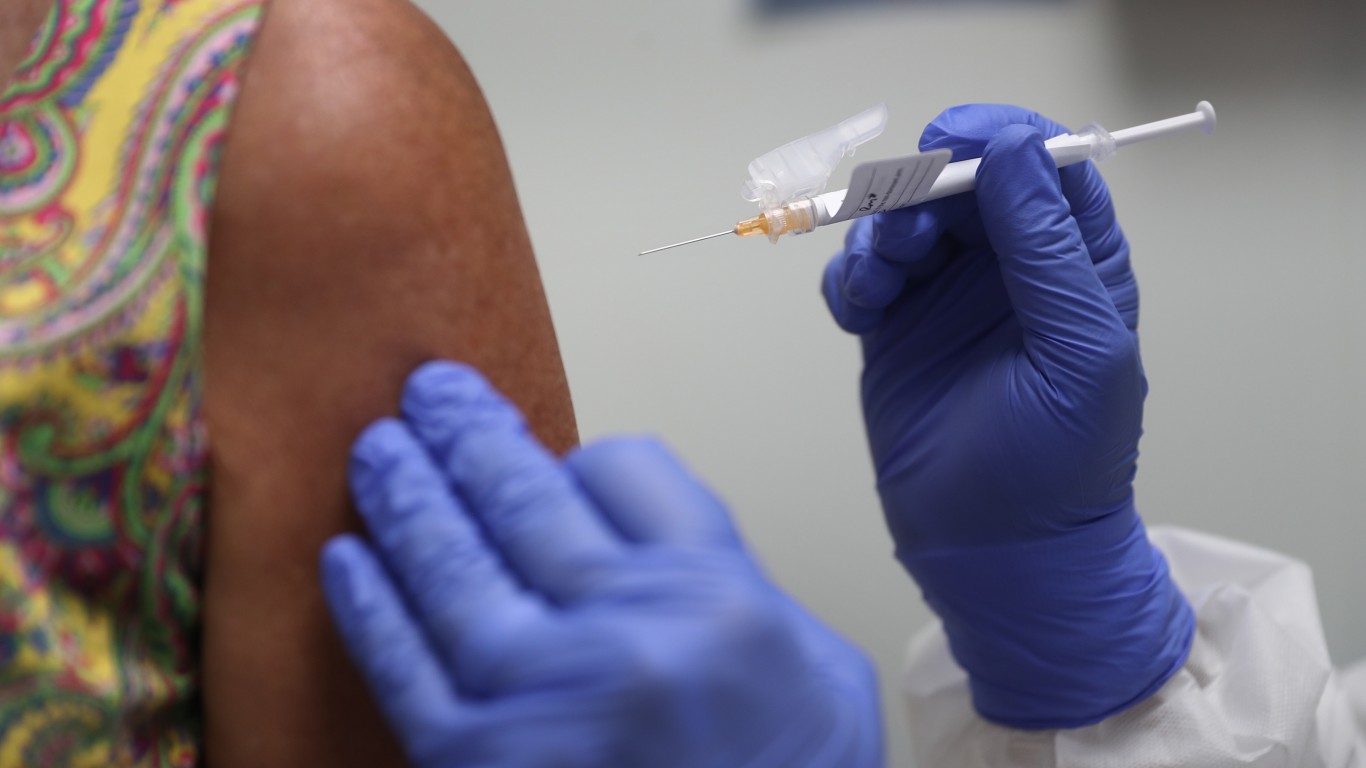

An estimated 161,631,676 Americans have been fully vaccinated, or 49.4% of the U.S. population.
So far, states have largely managed their own vaccination coordination efforts — and some have proven more efficient at it than others. In Utah, 44.6% of the population are fully vaccinated, lower than the U.S. average.
Lower than average vaccination rates in Utah appear to be attributable in part to less efficient vaccination rollout. As of July 20, Utah has received about 3,301,300 vaccinations and administered about 89.0% of those doses.
As the virus mutates and new variants spread, vaccinating the population as rapidly as possible is critical. In total, there have been 422,619 confirmed cases of the virus in Utah as of July 20 — or 13,369 for every 100,000 people. For context, there have been 10,313 known infections for every 100,000 people nationwide.
All COVID-19 and vaccination data used in this story are current as of July 20, 2021.
These are all the counties in Utah where COVID-19 is slowing (and where it’s still getting worse).
| Rank | Place | Share of pop. fully vaccinated | Fully vaccinated residents | Total COVID-19 cases per 100k people |
|---|---|---|---|---|
| 1 | Vermont | 66.8% | 418,339 | 3,661 |
| 2 | Maine | 63.2% | 845,498 | 5,191 |
| 3 | Massachusetts | 63.1% | 4,357,007 | 10,320 |
| 4 | Connecticut | 62.3% | 2,225,346 | 9,816 |
| 5 | Rhode Island | 60.7% | 641,930 | 14,468 |
| 6 | Maryland | 57.9% | 3,500,639 | 7,682 |
| 7 | New Hampshire | 57.9% | 785,697 | 7,365 |
| 8 | Washington | 57.3% | 4,320,331 | 6,105 |
| 9 | New Jersey | 57.0% | 5,077,581 | 11,550 |
| 10 | New Mexico | 56.3% | 1,179,876 | 9,888 |
| 11 | New York | 55.9% | 10,915,227 | 10,875 |
| 12 | Oregon | 55.7% | 2,334,446 | 5,059 |
| 13 | Washington D.C. | 55.7% | 381,131 | 7,254 |
| 14 | Colorado | 54.2% | 3,086,226 | 9,925 |
| 15 | Virginia | 53.8% | 4,580,737 | 8,042 |
| 16 | Minnesota | 53.4% | 2,997,756 | 10,827 |
| 17 | Hawaii | 52.8% | 750,266 | 2,655 |
| 18 | Delaware | 52.2% | 504,923 | 11,413 |
| 19 | California | 51.8% | 20,480,346 | 9,476 |
| 20 | Pennsylvania | 51.3% | 6,575,932 | 9,499 |
| 21 | Wisconsin | 51.2% | 2,979,114 | 11,694 |
| 22 | Iowa | 49.1% | 1,549,216 | 11,905 |
| 23 | Nebraska | 49.0% | 944,969 | 11,707 |
| 24 | Michigan | 48.3% | 4,826,819 | 10,038 |
| 25 | Florida | 48.3% | 10,277,618 | 11,300 |
| 26 | Illinois | 47.5% | 6,053,831 | 10,988 |
| 27 | South Dakota | 46.5% | 409,951 | 14,140 |
| 28 | Ohio | 45.9% | 5,368,516 | 9,557 |
| 29 | Arizona | 45.3% | 3,245,176 | 12,664 |
| 30 | Kentucky | 44.8% | 2,003,228 | 10,512 |
| 31 | Alaska | 44.6% | 329,206 | 9,418 |
| 32 | Utah | 44.6% | 1,409,162 | 13,369 |
| 33 | Nevada | 44.1% | 1,339,499 | 11,307 |
| 34 | Montana | 44.1% | 468,821 | 10,794 |
| 35 | Indiana | 43.8% | 2,933,840 | 11,359 |
| 36 | North Carolina | 43.5% | 4,519,991 | 9,851 |
| 37 | Texas | 43.4% | 12,456,699 | 10,554 |
| 38 | Kansas | 43.1% | 1,255,255 | 11,107 |
| 39 | South Carolina | 40.5% | 2,057,399 | 11,849 |
| 40 | Missouri | 40.4% | 2,472,883 | 10,567 |
| 41 | North Dakota | 39.7% | 301,939 | 14,605 |
| 42 | Oklahoma | 39.7% | 1,566,238 | 11,803 |
| 43 | Tennessee | 38.8% | 2,628,470 | 12,917 |
| 44 | West Virginia | 38.5% | 696,124 | 9,133 |
| 45 | Georgia | 38.3% | 4,025,666 | 10,894 |
| 46 | Idaho | 37.6% | 660,309 | 11,222 |
| 47 | Louisiana | 36.1% | 1,684,060 | 10,643 |
| 48 | Wyoming | 36.1% | 208,489 | 10,995 |
| 49 | Arkansas | 35.5% | 1,069,679 | 12,031 |
| 50 | Alabama | 33.9% | 1,654,644 | 11,476 |
| 51 | Mississippi | 33.8% | 1,008,740 | 10,943 |
Sponsored: Attention Savvy Investors: Speak to 3 Financial Experts – FREE
Ever wanted an extra set of eyes on an investment you’re considering? Now you can speak with up to 3 financial experts in your area for FREE. By simply
clicking here you can begin to match with financial professionals who can help guide you through the financial decisions you’re making. And the best part? The first conversation with them is free.
Click here to match with up to 3 financial pros who would be excited to help you make financial decisions.
Thank you for reading! Have some feedback for us?
Contact the 24/7 Wall St. editorial team.


