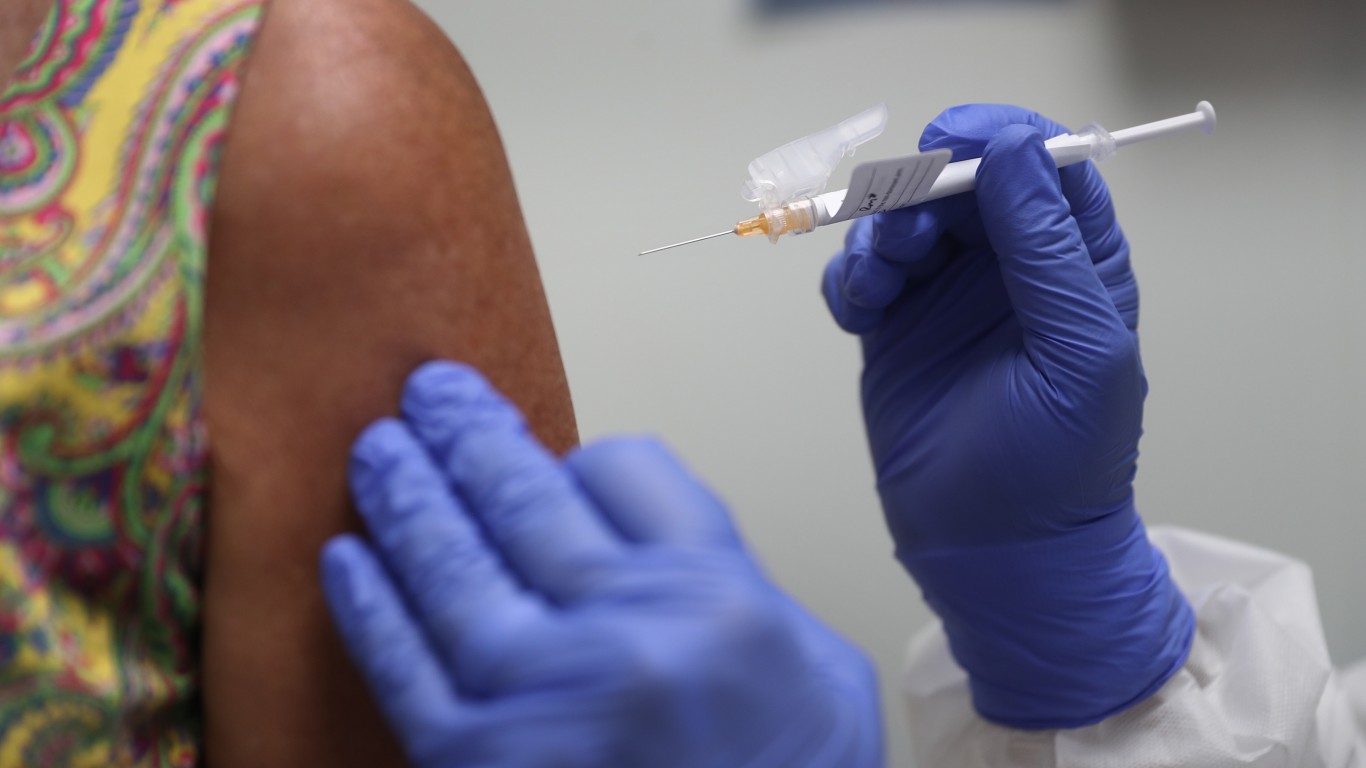

The Biden Administration announced a target goal fully vaccinating 160 million American adults by July 4. Whether or not this timeline is achievable remains to be seen. Currently, 150,424,675 people have been fully vaccinated, or 46.0% of the U.S. population.
So far, states have largely managed their own vaccination coordination efforts — and some have proven more efficient at it than others. In California, 48.3% of the population are fully vaccinated, higher than the U.S. average.
Though California is doing a better job vaccinating its population than other states, there still appears to be some room for improvement. As of June 22, California has received about 48,682,100 vaccinations and administered about 85.5% of those doses.
As the virus mutates and new variants spread, vaccinating the population as rapidly as possible is critical. In total, there have been 3,702,882 confirmed cases of the virus in California as of June 22 — or 9,361 for every 100,000 people. For context, there have been 10,153 known infections for every 100,000 people nationwide.
All COVID-19 and vaccination data used in this story are current as of June 22, 2021.
| Rank | Place | Share of pop. fully vaccinated | Fully vaccinated residents | Total COVID-19 cases per 100k people |
|---|---|---|---|---|
| 1 | Vermont | 64.2% | 402,130 | 3,890 |
| 2 | Maine | 60.5% | 809,799 | 5,142 |
| 3 | Massachusetts | 60.0% | 4,142,425 | 10,278 |
| 4 | Connecticut | 59.0% | 2,107,541 | 9,759 |
| 5 | Rhode Island | 57.5% | 608,186 | 14,412 |
| 6 | New Hampshire | 55.0% | 746,009 | 7,317 |
| 7 | New Jersey | 54.8% | 4,879,364 | 11,463 |
| 8 | Maryland | 54.0% | 3,265,050 | 7,641 |
| 9 | Washington | 53.5% | 4,030,746 | 5,935 |
| 10 | New Mexico | 52.5% | 1,100,922 | 9,769 |
| 11 | Washington D.C. | 52.4% | 358,432 | 7,194 |
| 12 | New York | 52.1% | 10,178,064 | 10,796 |
| 13 | Oregon | 52.0% | 2,178,921 | 4,934 |
| 14 | Colorado | 50.9% | 2,897,391 | 9,725 |
| 15 | Hawaii | 50.8% | 721,474 | 2,537 |
| 16 | Minnesota | 50.6% | 2,839,353 | 10,773 |
| 17 | Virginia | 50.6% | 4,307,288 | 7,968 |
| 18 | Pennsylvania | 48.6% | 6,220,429 | 9,451 |
| 19 | Delaware | 48.4% | 468,110 | 11,327 |
| 20 | California | 48.3% | 19,106,214 | 9,361 |
| 21 | Wisconsin | 48.1% | 2,794,260 | 11,640 |
| 22 | Iowa | 47.1% | 1,486,467 | 11,822 |
| 23 | Michigan | 46.1% | 4,608,073 | 9,986 |
| 24 | Nebraska | 45.8% | 883,644 | 11,610 |
| 25 | South Dakota | 44.8% | 395,412 | 14,100 |
| 26 | Florida | 44.6% | 9,493,764 | 10,867 |
| 27 | Illinois | 44.2% | 5,636,577 | 10,899 |
| 28 | Ohio | 43.7% | 5,112,670 | 9,486 |
| 29 | Kentucky | 42.3% | 1,888,620 | 10,369 |
| 30 | Montana | 41.9% | 445,020 | 10,653 |
| 31 | Alaska | 41.5% | 306,072 | 9,225 |
| 32 | Nevada | 41.3% | 1,252,492 | 10,838 |
| 33 | Kansas | 41.1% | 1,195,293 | 10,872 |
| 34 | Texas | 40.3% | 11,558,001 | 10,368 |
| 35 | Arizona | 39.8% | 2,852,375 | 12,406 |
| 36 | Indiana | 39.3% | 2,631,397 | 11,226 |
| 37 | North Carolina | 39.1% | 4,057,362 | 9,728 |
| 38 | North Dakota | 38.4% | 291,720 | 14,547 |
| 39 | Missouri | 38.2% | 2,338,257 | 9,972 |
| 40 | South Carolina | 37.5% | 1,908,149 | 11,716 |
| 41 | Oklahoma | 37.5% | 1,478,500 | 11,553 |
| 42 | Utah | 37.0% | 1,169,726 | 13,021 |
| 43 | West Virginia | 36.3% | 655,022 | 9,047 |
| 44 | Idaho | 36.0% | 631,014 | 11,059 |
| 45 | Georgia | 35.8% | 3,760,962 | 10,752 |
| 46 | Tennessee | 34.9% | 2,361,149 | 12,792 |
| 47 | Wyoming | 33.8% | 195,259 | 10,643 |
| 48 | Louisiana | 33.8% | 1,572,948 | 10,246 |
| 49 | Arkansas | 33.5% | 1,008,252 | 11,467 |
| 50 | Alabama | 32.1% | 1,566,908 | 11,232 |
| 51 | Mississippi | 29.0% | 866,979 | 10,713 |
Sponsored: Find a Qualified Financial Advisor
Finding a qualified financial advisor doesn’t have to be hard. SmartAsset’s free tool matches you with up to 3 fiduciary financial advisors in your area in 5 minutes. Each advisor has been vetted by SmartAsset and is held to a fiduciary standard to act in your best interests. If you’re ready to be matched with local advisors that can help you achieve your financial goals, get started now.
Thank you for reading! Have some feedback for us?
Contact the 24/7 Wall St. editorial team.


