undefined
Posts
undefined
Followers
Biggest Boomtowns in the West
By Heather Taylor,
2024-12-25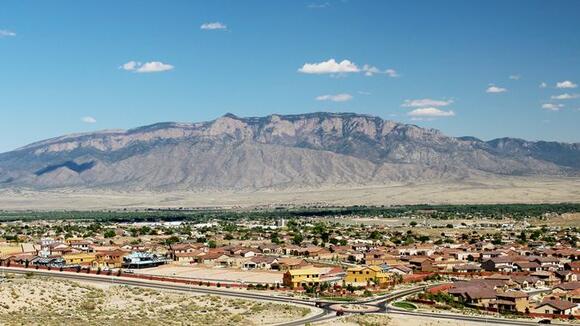
Think you’re familiar with the biggest boomtown in every Western state? It’s possible you might even be a resident or planning to spend your retirement in one of these metros.
Find Out: How Much Money Is Needed To Be Considered Middle Class in Every State?
Learn More: How Much a Comfortable Retirement Will Cost You in Each State
By analyzing data from the U.S. Census American Community Survey in the years 2014, 2017, 2021 and 2022, GOBankingRates was able to uncover every state’s biggest boomtown. Additional information sourced from each survey included each boomtown’s total population, owner-occupied housing, occupied housing united and per-capita income.
Keep reading to find out where the biggest boomtowns in the West are.
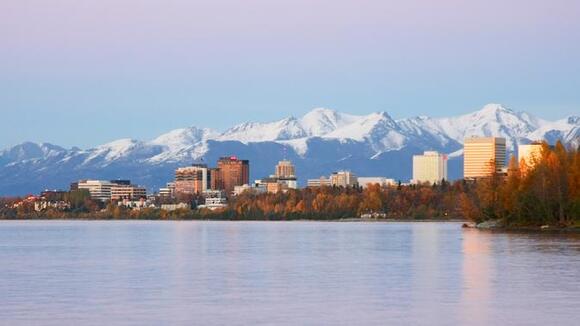
Anchorage, Alaska
- Change in population since 2014: (7,054) (-2.6%)
- Population: 290,674
- Change in per-capita income: 21.6%
- Per-capita income: $46,554
- Change in occupied housing units: 1,970 (1.8%)
- Change in owner-occupied housing units: 5,428 (7.9%)
Be Aware: How Far $750,000 in Retirement Savings Plus Social Security Goes in Every State
Read More: How Long $1 Million in Retirement Will Last in Every State
Trending Now: Suze Orman's Secret to a Wealthy Retirement--Have You Made This Money Move?
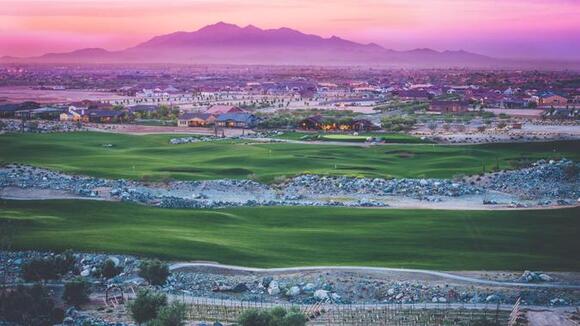
Buckeye, Arizona
- Change in population since 2014: 40,115 (42.2%)
- Population: 95,042
- Change in per-capita income: 37.3%
- Per-capita income: $32,141
- Change in occupied housing units: 12,709 (45.2%)
- Change in owner-occupied housing units: 13,734 (57.3%)
For You: Here’s the Cost of Living in Every State
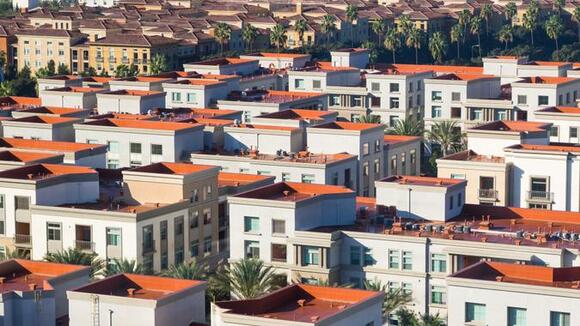
Irvine, California
- Change in population since 2014: 74,677 (24.5%)
- Population: 304,527
- Change in per-capita income: 26.8%
- Per-capita income: $59,354
- Change in occupied housing units: 27,144 (24.6%)
- Change in owner-occupied housing units: 7,427 (15.3%)
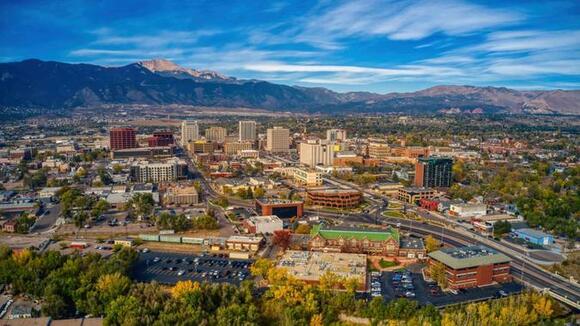
Colorado Springs, Colorado
- Change in population since 2014: 46,065 (9.6%)
- Population: 479,612
- Change in per-capita income: 29.9%
- Per-capita income: $41,849
- Change in occupied housing units: 22,876 (11.8%)
- Change in owner-occupied housing units: 17,864 (15.1%)
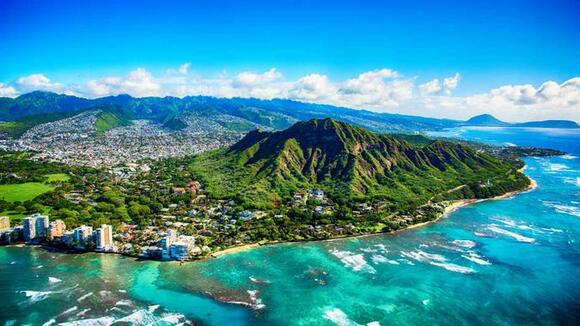
Honolulu, Hawaii
- Change in population since 2014: 3,417 (1.0%)
- Population: 348,547
- Change in per-capita income: 32.0%
- Per-capita income: $45,784
- Change in occupied housing units: 6,335 (4.7%)
- Change in owner-occupied housing units: 9,306 (14.4%)
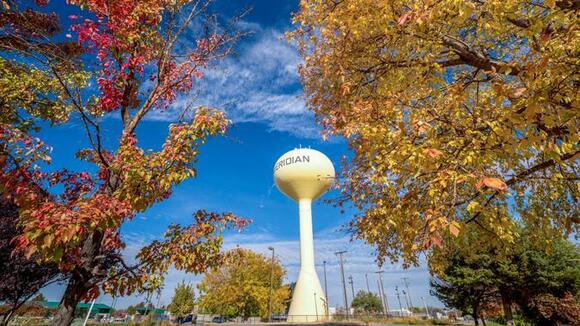
Meridian, Idaho
- Change in population since 2014: 38,847 (32.4%)
- Population: 119,872
- Change in per-capita income: 40%
- Per-capita income: $44,540
- Change in occupied housing units: 14,412 (33.6%)
- Change in owner-occupied housing units: 11,319 (34.6%)
Learn More: Here’s How Much You Need To Earn To Be ‘Rich’ in Every State
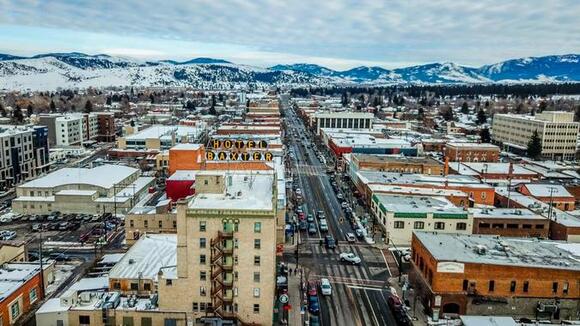
Bozeman, Montana
- Change in population since 2014: 14,377 (26.9%)
- Population: 53,500
- Change in per-capita income: 41.5%
- Per-capita income: $45,037
- Change in occupied housing units: 5,968 (27.1%)
- Change in owner-occupied housing units: 2,322 (24.1%)

Henderson, Nevada
- Change in population since 2014: 51,818 (16.3%)
- Population: 318,063
- Change in per-capita income: 29.1%
- Per-capita income: $46,882
- Change in occupied housing units: 22,575 (18.1%)
- Change in owner-occupied housing units: 17,923 (22.1%)
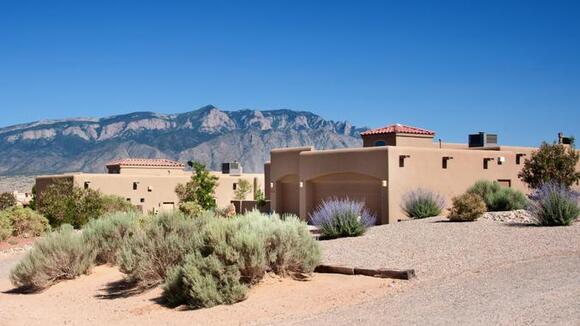
Rio Rancho, New Mexico
- Change in population since 2014: 13,724 (13.2%)
- Population: 104,351
- Change in per-capita income: 24.4%
- Per-capita income: $36,247
- Change in occupied housing units: 5,616 (14.7%)
- Change in owner-occupied housing units: 5,396 (17.4%)
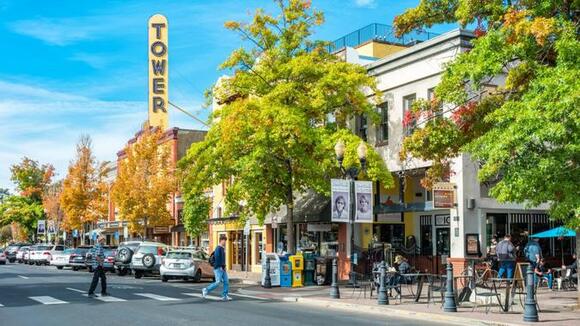
Bend, Oregon
- Change in population since 2014: 19,744 (19.9%)
- Population: 99,442
- Change in per-capita income: 39.6%
- Per-capita income: $51,254
- Change in occupied housing units: 9,709 (23%)
- Change in owner-occupied housing units: 6,900 (26.7%)
Explore Next: Real Estate: 10 Housing Markets Buyers Are Flocking To as Rates Drop
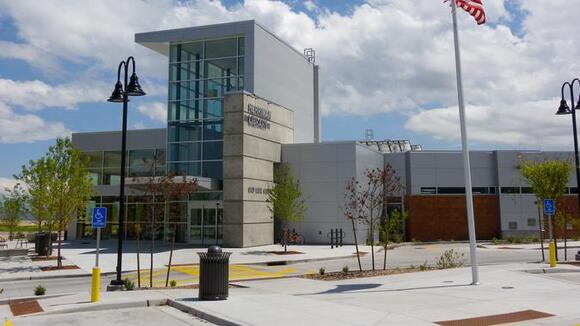
Herriman, Utah
- Change in population since 2014: 30,279 (54.8%)
- Population: 55,301
- Change in per-capita income: 38.8%
- Per-capita income: $37,331
- Change in occupied housing units: 9,818 (61.1%)
- Change in owner-occupied housing units: 8,305 (63.5%)
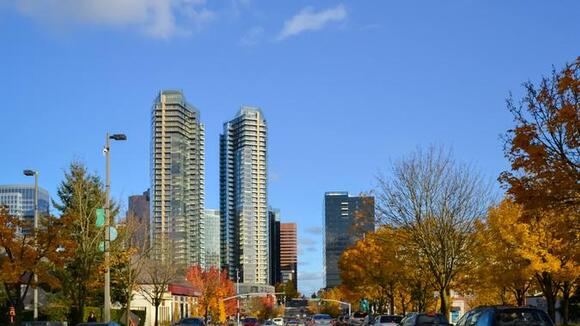
Redmond, Washington
- Change in population since 2014: 17,024 (23.1%)
- Population: 73,728
- Change in per-capita income: 38.5%
- Per-capita income: $82,565
- Change in occupied housing units: 6,670 (22.1%)
- Change in owner-occupied housing units: 2,096 (14.9%)
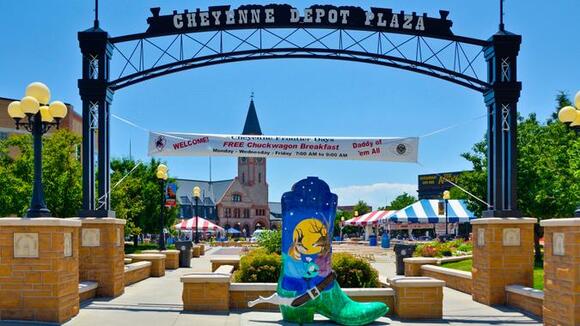
Cheyenne, Wyoming
- Change in population since 2014: 3,325 (5.1%)
- Population: 64,795
- Change in per-capita income: 32%
- Per-capita income: $41,908
- Change in occupied housing units: 3,299 (11.7%)
- Change in owner-occupied housing units: 3,978 (20.3%)
Methodology: GOBankingRates analyzed the American Community Survey data in the United States Census to find the biggest boomtowns in every state. Using the surveys from 2022, 2021, 2017 and 2014, GOBankingRates found total population, owner-occupied housing, occupied housing units and per-capita income. The highest scoring city was kept for each state and a number of factors were found for each city, including total population, total households and household median income, all sourced from the American Community Survey. The cost-of-living indexes were sourced from Sperling’s BestPlaces and include the grocery, healthcare, housing, utilities, transportation and miscellaneous cost-of-living indexes. Using the cost-of-living indexes and the national average expenditure costs, as sourced from the Bureau of Labor Statistics Consumer Expenditure Survey, the average expenditure cost for each location was calculated. The average single family home value was sourced from Zillow Home Value Index for September 2024. All data was collected on and is up to date as of Oct. 21, 2024.
This article originally appeared on GOBankingRates.com : Biggest Boomtowns in the West
 Add to Preferred Sources
